Saitama Airbnb Market Analysis 2026: Short Term Rental Data & Vacation Rental Statistics in Saitama Prefecture, Japan
Is Airbnb profitable in Saitama in 2026? Explore comprehensive Airbnb analytics for Saitama, Saitama Prefecture, Japan to uncover income potential. This 2026 STR market report for Saitama, based on AirROI data from February 2025 to January 2026, reveals key trends in the niche market of 75 active listings.
Whether you're considering an Airbnb investment in Saitama, optimizing your existing vacation rental, or exploring rental arbitrage opportunities, understanding the Saitama Airbnb data is crucial. Navigating the high regulation landscape is key to maximizing your short term rental income potential. Let's dive into the specifics.
Key Saitama Airbnb Performance Metrics Overview
Monthly Airbnb Revenue Variations & Income Potential in Saitama (2026)
Understanding the monthly revenue variations for Airbnb listings in Saitama is key to maximizing your short term rental income potential. Seasonality significantly impacts earnings. Our analysis, based on data from the past 12 months, shows that the peak revenue month for STRs in Saitama is typically April, while September often presents the lowest earnings, highlighting opportunities for strategic pricing adjustments during shoulder and low seasons. Explore the typical Airbnb income in Saitama across different performance tiers:
- Best-in-class properties (Top 10%) achieve $2,524+ monthly, often utilizing dynamic pricing and superior guest experiences.
- Strong performing properties (Top 25%) earn $1,281 or more, indicating effective management and desirable locations/amenities.
- Typical properties (Median) generate around $890 per month, representing the average market performance.
- Entry-level properties (Bottom 25%) see earnings around $607, often with potential for optimization.
Average Monthly Airbnb Earnings Trend in Saitama
Saitama Airbnb Occupancy Rate Trends (2026)
Maximize your bookings by understanding the Saitama STR occupancy trends. Seasonal demand shifts significantly influence how often properties are booked. Typically, Aprilsees the highest demand (peak season occupancy), while January experiences the lowest (low season). Effective strategies, like adjusting minimum stays or offering promotions, can boost occupancy during slower periods. Here's how different property tiers perform in Saitama:
- Best-in-class properties (Top 10%) achieve 80%+ occupancy, indicating high desirability and potentially optimized availability.
- Strong performing properties (Top 25%) maintain 65% or higher occupancy, suggesting good market fit and guest satisfaction.
- Typical properties (Median) have an occupancy rate around 46%.
- Entry-level properties (Bottom 25%) average 29% occupancy, potentially facing higher vacancy.
Average Monthly Occupancy Rate Trend in Saitama
Average Daily Rate (ADR) Airbnb Trends in Saitama (2026)
Effective short term rental pricing strategy in Saitama involves understanding monthly ADR fluctuations. The Average Daily Rate (ADR) for Airbnb in Saitama typically peaks in July and dips lowest during January. Leveraging Airbnb dynamic pricing tools or strategies based on this seasonality can significantly boost revenue. Here's a look at the typical nightly rates achieved:
- Best-in-class properties (Top 10%) command rates of $174+ per night, often due to premium features or locations.
- Strong performing properties (Top 25%) achieve nightly rates of $98 or more.
- Typical properties (Median) charge around $62 per night.
- Entry-level properties (Bottom 25%) earn around $47 per night.
Average Daily Rate (ADR) Trend by Month in Saitama
Get Live Saitama Market Intelligence 👇

Explore Real-time Analytics
Airbnb Seasonality Analysis & Trends in Saitama (2026)
Peak Season (April, March, November)
- Revenue averages $1,595 per month
- Occupancy rates average 57.3%
- Daily rates average $86
Shoulder Season
- Revenue averages $1,271 per month
- Occupancy maintains around 45.1%
- Daily rates hold near $88
Low Season (January, June, September)
- Revenue drops to average $938 per month
- Occupancy decreases to average 40.7%
- Daily rates adjust to average $85
Seasonality Insights for Saitama
- The Airbnb seasonality in Saitama shows moderate seasonality with distinct peak and low periods. While the sections above show seasonal averages, it's also insightful to look at the extremes:
- During the high season, the absolute peak month showcases Saitama's highest earning potential, with monthly revenues capable of climbing to $1,723, occupancy reaching a high of 58.0%, and ADRs peaking at $96.
- Conversely, the slowest single month of the year, typically falling within the low season, marks the market's lowest point. In this month, revenue might dip to $865, occupancy could drop to 39.7%, and ADRs may adjust down to $78.
- Understanding both the seasonal averages and these monthly peaks and troughs in revenue, occupancy, and ADR is crucial for maximizing your Airbnb profit potential in Saitama.
Seasonal Strategies for Maximizing Profit
- Peak Season: Maximize revenue through premium pricing and potentially longer minimum stays. Ensure high availability.
- Low Season: Offer competitive pricing, special promotions (e.g., extended stay discounts), and flexible cancellation policies. Target off-season travelers like remote workers or budget-conscious guests.
- Shoulder Seasons: Implement dynamic pricing that balances peak and low rates. Target weekend travelers or specific events. Offer slightly more flexible terms than peak season.
- Regularly analyze your own performance against these Saitama seasonality benchmarks and adjust your pricing and availability strategy accordingly.
Best Areas for Airbnb Investment in Saitama (2026)
Exploring the top neighborhoods for short-term rentals in Saitama? This section highlights key areas, outlining why they are attractive for hosts and guests, along with notable local attractions. Consider these locations based on your target guest profile and investment strategy.
| Neighborhood / Area | Why Host Here? (Target Guests & Appeal) | Key Attractions & Landmarks |
|---|---|---|
| Omiya | Omiya is a key transportation hub in Saitama, making it attractive for both travelers and business visitors. It features a vibrant shopping district and easy access to Tokyo. | Omiya Park, The Railway Museum, Saitama Super Arena, Omiya Sonic City, Hibari Park |
| Kawaguchi | Kawaguchi offers a balance of urban convenience and residential life, close to Tokyo. It's ideal for families and tourists wanting a quieter atmosphere while still being close to city attractions. | Kawaguchi Lakeside Park, Tokyo Tower, Ryuno Park, Kawaguchi City Cultural Centre, Aokicho Park |
| Tokorozawa | Known for its parks and as a green space near Tokyo, Tokorozawa attracts nature lovers and families looking for leisure activities and quiet retreats away from the bustling city. | Seibu-en Amusement Park, Tokorozawa Aviation Museum, Showa Kinen Park, Nature Reserve, Civic Center |
| Saitama City | Saitama City, the capital of Saitama Prefecture, is a cultural hub with significant attractions, shopping, and dining, making it appealing for tourists and business travelers alike. | Saitama Super Arena, Omiya Bonsai Village, Nack5 Stadium, Saitama Prefectural Museum of History, Kita-Urawa Park |
| Ageo | Ageo is a quieter area with local charm and accessibility to Tokyo via train. It's ideal for housing travelers looking for residential neighborhoods with local experiences. | Ageo Park, Shirakobato Park, Mizuhonomori Park, Ageo City Museum, Hokubu Park |
| Hanyu | Hanyu, located near popular tourist spots like the Kumagaya Sports Life Park, is appealing for those looking to escape urban settings while still having easy access to city activities. | Kumagaya Sports Life Park, Hanyu City Folk Museum, Hanyu Shrine, Sakura Hill, Chikatsu Asakura Shrine |
| Misato | With a mix of urban and suburban living, Misato attracts families and travelers looking for convenience and comfort while being close to metropolitan Tokyo. | Misato City Museum, Misato Central Park, Inagi Park, Sakura no Yama Park, Misato Sports Park |
| Koshigaya | Koshigaya boasts major shopping centers and entertainment options, perfect for visitors who want to enjoy retail therapy and local dining experiences. | Koshigaya Laketown, Mizuna Park, Koshigaya City Museum, Hikawa Shrine, Koshigaya Park |
Understanding Airbnb License Requirements & STR Laws in Saitama (2026)
Yes, Saitama, Saitama Prefecture, Japan enforces high STR regulations. Obtaining a license and ensuring compliance is almost certainly required according to current 2026 STR laws. Always verify the latest short term rental regulations and Airbnb license requirements directly with local government authorities for Saitama to ensure full compliance before hosting.
(Source: AirROI data, 2026, based on 95% licensed listings)
Top Performing Airbnb Properties in Saitama (2026)
Benchmark your potential! Explore examples of top-performing Airbnb properties in Saitamabased on Trailing Twelve Month (TTM) revenue. Analyze their characteristics, revenue, occupancy rate, and ADR to understand what drives success in this market.
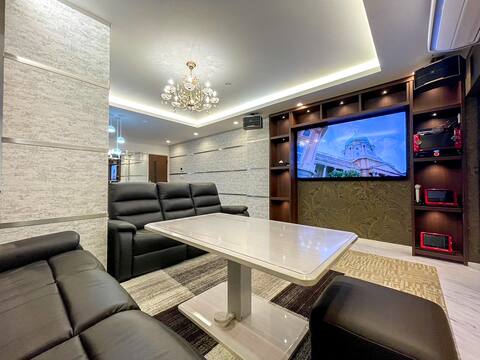
Karaoke / BBQ / Sauna / Stone Bath / Suite Room
Entire Place • 1 bedroom
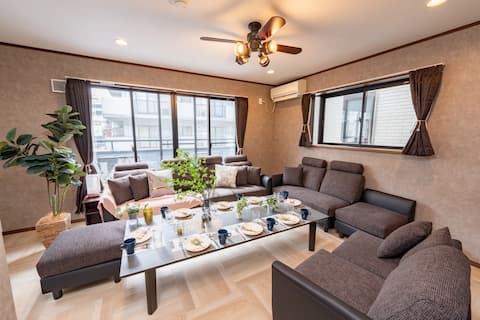
![[Shinjuku, 25 minutes by train (without transfer)] Spacious and relaxing designer house, 110 square](https://a0.muscache.com/im/pictures/hosting/Hosting-U3RheVN1cHBseUxpc3Rpbmc6MTE1OTQyODI1MzUzODE0MjY1Ng%3D%3D/original/44490b76-15a6-4a00-9e44-1d7a9d5d9b04.jpeg?im_w=480&im_format=avif)
[Shinjuku, 25 minutes by train (without transfer)] Spacious and relaxing designer house, 110 square
Entire Place • 4 bedrooms
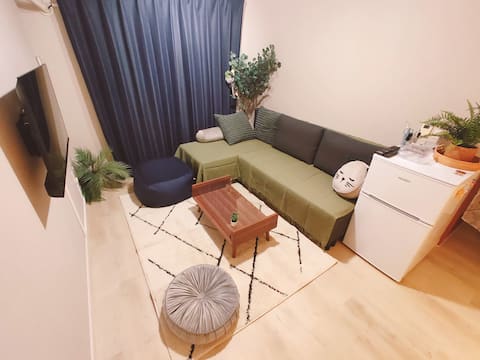
7-minute walk from Omiya Station/Entire house for rent/Free parking/About 2 km from Saitama Super Ar
Private Room • 3 bedrooms

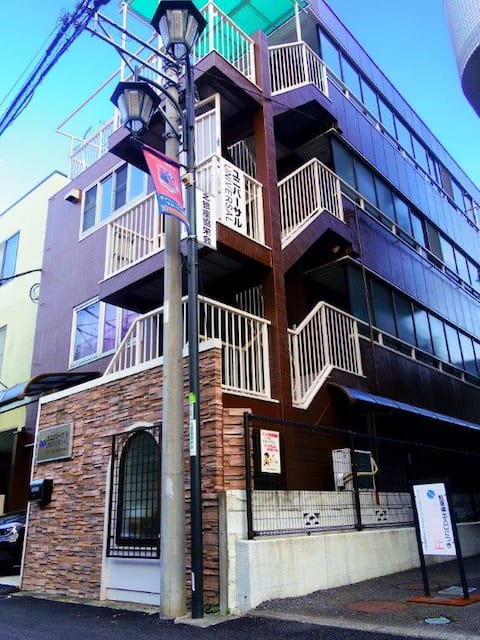
8-minute walk from Saitama Shintoshin Station | Within walking distance of Saitama Super Arena | Ide
Entire Place • 2 bedrooms
1 minute from the station | Family friendly, can accommodate up to 8 people
Entire Place • 2 bedrooms
Affordable accommodation in Omiya/Saitama Shintoshin, 3F, available for up to 5 people
Entire Place • 3 bedrooms
Note: Performance varies based on location, size, amenities, seasonality, and management quality. Data reflects the past 12 months.
Top Performing Airbnb Hosts in Saitama (2026)
Learn from the best! This table showcases top-performing Airbnb hosts in Saitama based on the number of properties managed and estimated total revenue over the past year. Analyze their scale and performance metrics.
| Host Name | Properties | Grossing Revenue | Stay Reviews | Avg Rating |
|---|---|---|---|---|
| Rainbow | 19 | $227,715 | 629 | 4.85/5.0 |
| Home | 11 | $126,283 | 355 | 4.67/5.0 |
| 隼人 | 1 | $100,122 | 49 | 4.90/5.0 |
| Local Stay | 1 | $59,752 | 79 | 4.95/5.0 |
| Tsuyoshi | 1 | $47,967 | 63 | 4.90/5.0 |
| Voyan Hotels | 1 | $44,257 | 46 | 4.85/5.0 |
| Taka | 4 | $43,552 | 114 | 4.95/5.0 |
| Junichi | 2 | $34,006 | 158 | 4.88/5.0 |
| Blue | 3 | $28,156 | 7 | 5.00/5.0 |
| Hiroshi&Natsu | 2 | $26,596 | 184 | 4.96/5.0 |
Analyzing the strategies of top hosts, such as their property selection, pricing, and guest communication, can offer valuable lessons for optimizing your own Airbnb operations in Saitama.
Dive Deeper: Advanced Saitama STR Market Data (2026)
Ready to unlock more insights? AirROI provides access to advanced metrics and comprehensive Airbnb data for Saitama. Explore detailed analytics beyond this report to refine your investment strategy, optimize pricing, and maximize your vacation rental profits.
Explore Advanced MetricsSaitama Short-Term Rental Market Composition (2026): Property & Room Types
Room Type Distribution
Property Type Distribution
Market Composition Insights for Saitama
- The Saitama Airbnb market composition is heavily skewed towards Entire Home/Apt listings, which make up 58.7% of the 75 active rentals. This indicates strong guest preference for privacy and space.
- However, a notable 41.3% share for Private Rooms suggests opportunities for budget-conscious travelers or hosts renting out spare rooms.
- Looking at the property type distribution in Saitama, Apartment/Condo properties are the most common (66.7%), reflecting the local real estate landscape.
- Houses represent a significant 33.3% portion, catering likely to families or larger groups.
Saitama Airbnb Room Capacity Analysis (2026): Bedroom Distribution
Distribution of Listings by Number of Bedrooms
Room Capacity Insights for Saitama
- The dominant room capacity in Saitama is 1 bedroom listings, making up 44% of the market. This suggests a strong demand for properties suitable for couples or solo travelers.
- Together, 1 bedroom and 2 bedrooms properties represent 53.3% of the active Airbnb listings in Saitama, indicating a high concentration in these sizes.
Saitama Vacation Rental Guest Capacity Trends (2026)
Distribution of Listings by Guest Capacity
Guest Capacity Insights for Saitama
- The most common guest capacity trend in Saitama vacation rentals is listings accommodating 2 guests (20%). This suggests the primary traveler segment is likely couples or solo travelers.
- Properties designed for 2 guests and 8+ guests dominate the Saitama STR market, accounting for 36.0% of listings.
- 20.0% of properties accommodate 6+ guests, serving the market segment for larger families or group travel in Saitama.
- On average, properties in Saitama are equipped to host 2.8 guests.
Saitama Airbnb Booking Patterns (2026): Available vs. Booked Days
Available Days Distribution
Booked Days Distribution
Booking Pattern Insights for Saitama
- The most common availability pattern in Saitama falls within the 181-270 days range, representing 41.3% of listings. This suggests many properties have significant open periods on their calendars.
- Approximately 60.0% of listings show high availability (181+ days open annually), indicating potential for increased bookings or specific owner usage patterns.
- For booked days, the 91-180 days range is most frequent in Saitama (40%), reflecting common guest stay durations or potential owner blocking patterns.
- A notable 41.3% of properties secure long booking periods (181+ days booked per year), highlighting successful long-term rental strategies or significant owner usage.
Saitama Airbnb Minimum Stay Requirements Analysis
Distribution of Listings by Minimum Night Requirement
1 Night
58 listings
77.3% of total
2 Nights
3 listings
4% of total
3 Nights
2 listings
2.7% of total
7-29 Nights
1 listings
1.3% of total
30+ Nights
11 listings
14.7% of total
Key Insights
- The most prevalent minimum stay requirement in Saitama is 1 Night, adopted by 77.3% of listings. This highlights the market's preference for shorter, flexible bookings.
- A strong majority (81.3%) of the Saitama Airbnb data shows acceptance of very short stays (1-2 nights), indicating a dynamic, high-turnover market.
- A significant segment (14.7%) caters to monthly stays (30+ nights) in Saitama, pointing to opportunities in the extended-stay market.
Recommendations
- Align with the market by considering a 1 Night minimum stay, as 77.3% of Saitama hosts use this setting.
- Explore offering discounts for stays of 30+ nights to attract the 14.7% of the market seeking extended stays.
- Adjust minimum nights based on seasonality – potentially shorter during low season and longer during peak demand periods in Saitama.
Saitama Airbnb Cancellation Policy Trends Analysis (2026)
Flexible
8 listings
10.7% of total
Moderate
34 listings
45.3% of total
Firm
9 listings
12% of total
Strict
24 listings
32% of total
Cancellation Policy Insights for Saitama
- The prevailing Airbnb cancellation policy trend in Saitama is Moderate, used by 45.3% of listings.
- There's a relatively balanced mix between guest-friendly (56.0%) and stricter (44.0%) policies, offering choices for different guest needs.
Recommendations for Hosts
- Consider adopting a Moderate policy to align with the 45.3% market standard in Saitama.
- With 32% using Strict terms, this is a viable option in Saitama, particularly for high-value properties or during peak demand periods.
- Regularly review your cancellation policy against competitors and market demand shifts in Saitama.
Saitama STR Booking Lead Time Analysis (2026)
Average Booking Lead Time by Month
Booking Lead Time Insights for Saitama
- The overall average booking lead time for vacation rentals in Saitama is 35 days.
- Guests book furthest in advance for stays during August (average 47 days), likely coinciding with peak travel demand or local events.
- The shortest booking windows occur for stays in February (average 22 days), indicating more last-minute travel plans during this time.
- Seasonally, Fall (42 days avg.) sees the longest lead times, while Winter (30 days avg.) has the shortest, reflecting typical travel planning cycles.
Recommendations for Hosts
- Use the overall average lead time (35 days) as a baseline for your pricing and availability strategy in Saitama.
- For August stays, consider implementing length-of-stay discounts or slightly higher rates for bookings made less than 47 days out to capitalize on advance planning.
- Target marketing efforts for the Fall season well in advance (at least 42 days) to capture early planners.
- Monitor your own booking lead times against these Saitama averages to identify opportunities for dynamic pricing adjustments.
Popular & Essential Airbnb Amenities in Saitama (2026)
Amenity Prevalence
Amenity Insights for Saitama
- Essential amenities in Saitama that guests expect include: Wifi, Air conditioning, Microwave, Hair dryer, TV, Smoke alarm. Lacking these (any) could significantly impact bookings.
- Popular amenities like Heating, Shampoo, Fire extinguisher are common but not universal. Offering these can provide a competitive edge.
Recommendations for Hosts
- Ensure your listing includes all essential amenities for Saitama: Wifi, Air conditioning, Microwave, Hair dryer, TV, Smoke alarm.
- Prioritize adding missing essentials: Microwave, Hair dryer, TV, Smoke alarm.
- Consider adding popular differentiators like Heating or Shampoo to increase appeal.
- Highlight unique or less common amenities you offer (e.g., hot tub, dedicated workspace, EV charger) in your listing description and photos.
- Regularly check competitor amenities in Saitama to stay competitive.
Saitama Airbnb Guest Demographics & Profile Analysis (2026)
Guest Profile Summary for Saitama
- The typical guest profile for Airbnb in Saitama consists of predominantly international visitors (73%), with top international origins including United States, typically belonging to the Post-2000s (Gen Z/Alpha) group (50%), primarily speaking English or Japanese.
- Domestic travelers account for 27.1% of guests.
- Key international markets include Japan (27.1%) and United States (17%).
- Top languages spoken are English (39.4%) followed by Japanese (22.1%).
- A significant demographic segment is the Post-2000s (Gen Z/Alpha) group, representing 50% of guests.
Recommendations for Hosts
- Focus marketing internationally, particularly towards travelers from United States.
- Tailor amenities and listing descriptions to appeal to the dominant Post-2000s (Gen Z/Alpha) demographic (e.g., highlight fast WiFi, smart home features, local guides).
- Highlight unique local experiences or amenities relevant to the primary guest profile.
- Consider seasonal promotions aligned with peak travel times for key origin markets.
Nearby Short-Term Rental Market Comparison
How does the Saitama Airbnb market stack up against its neighbors? Compare key performance metrics like average monthly revenue, ADR, and occupancy rates in surrounding areas to understand the broader regional STR landscape.
| Market | Active Properties | Monthly Revenue | Daily Rate | Avg. Occupancy |
|---|---|---|---|---|
| Shinagawa City | 50 | $7,769 | $428.93 | 62% |
| Futtsu | 31 | $5,187 | $369.80 | 44% |
| Kyonan | 15 | $5,099 | $419.89 | 42% |
| Adachi City | 47 | $4,752 | $301.69 | 50% |
| Kita | 15 | $4,563 | $305.24 | 57% |
| Shirako | 22 | $4,439 | $359.94 | 34% |
| Nagatoro | 10 | $4,035 | $249.70 | 52% |
| Kamogawa | 36 | $4,007 | $296.27 | 37% |
| Hakone | 335 | $3,905 | $289.84 | 48% |
| Karuizawa | 121 | $3,852 | $396.31 | 39% |