Otari Airbnb Market Analysis 2026: Short Term Rental Data & Vacation Rental Statistics in Nagano Prefecture, Japan
Is Airbnb profitable in Otari in 2026? Explore comprehensive Airbnb analytics for Otari, Nagano Prefecture, Japan to uncover income potential. This 2026 STR market report for Otari, based on AirROI data from February 2025 to January 2026, reveals key trends in the niche market of 58 active listings.
Whether you're considering an Airbnb investment in Otari, optimizing your existing vacation rental, or exploring rental arbitrage opportunities, understanding the Otari Airbnb data is crucial. Navigating the high regulation landscape is key to maximizing your short term rental income potential. Let's dive into the specifics.
Key Otari Airbnb Performance Metrics Overview
Monthly Airbnb Revenue Variations & Income Potential in Otari (2026)
Understanding the monthly revenue variations for Airbnb listings in Otari is key to maximizing your short term rental income potential. Seasonality significantly impacts earnings. Our analysis, based on data from the past 12 months, shows that the peak revenue month for STRs in Otari is typically February, while October often presents the lowest earnings, highlighting opportunities for strategic pricing adjustments during shoulder and low seasons. Explore the typical Airbnb income in Otari across different performance tiers:
- Best-in-class properties (Top 10%) achieve $8,864+ monthly, often utilizing dynamic pricing and superior guest experiences.
- Strong performing properties (Top 25%) earn $2,495 or more, indicating effective management and desirable locations/amenities.
- Typical properties (Median) generate around $824 per month, representing the average market performance.
- Entry-level properties (Bottom 25%) see earnings around $336, often with potential for optimization.
Average Monthly Airbnb Earnings Trend in Otari
Otari Airbnb Occupancy Rate Trends (2026)
Maximize your bookings by understanding the Otari STR occupancy trends. Seasonal demand shifts significantly influence how often properties are booked. Typically, Februarysees the highest demand (peak season occupancy), while May experiences the lowest (low season). Effective strategies, like adjusting minimum stays or offering promotions, can boost occupancy during slower periods. Here's how different property tiers perform in Otari:
- Best-in-class properties (Top 10%) achieve 66%+ occupancy, indicating high desirability and potentially optimized availability.
- Strong performing properties (Top 25%) maintain 39% or higher occupancy, suggesting good market fit and guest satisfaction.
- Typical properties (Median) have an occupancy rate around 19%.
- Entry-level properties (Bottom 25%) average 9% occupancy, potentially facing higher vacancy.
Average Monthly Occupancy Rate Trend in Otari
Average Daily Rate (ADR) Airbnb Trends in Otari (2026)
Effective short term rental pricing strategy in Otari involves understanding monthly ADR fluctuations. The Average Daily Rate (ADR) for Airbnb in Otari typically peaks in January and dips lowest during May. Leveraging Airbnb dynamic pricing tools or strategies based on this seasonality can significantly boost revenue. Here's a look at the typical nightly rates achieved:
- Best-in-class properties (Top 10%) command rates of $557+ per night, often due to premium features or locations.
- Strong performing properties (Top 25%) achieve nightly rates of $237 or more.
- Typical properties (Median) charge around $120 per night.
- Entry-level properties (Bottom 25%) earn around $70 per night.
Average Daily Rate (ADR) Trend by Month in Otari
Get Live Otari Market Intelligence 👇

Explore Real-time Analytics
Airbnb Seasonality Analysis & Trends in Otari (2026)
Peak Season (February, June, July)
- Revenue averages $4,068 per month
- Occupancy rates average 36.6%
- Daily rates average $214
Shoulder Season
- Revenue averages $2,358 per month
- Occupancy maintains around 29.4%
- Daily rates hold near $226
Low Season (May, September, October)
- Revenue drops to average $1,048 per month
- Occupancy decreases to average 11.3%
- Daily rates adjust to average $212
Seasonality Insights for Otari
- The Airbnb seasonality in Otari shows highly seasonal trends requiring careful strategy. While the sections above show seasonal averages, it's also insightful to look at the extremes:
- During the high season, the absolute peak month showcases Otari's highest earning potential, with monthly revenues capable of climbing to $4,992, occupancy reaching a high of 62.5%, and ADRs peaking at $261.
- Conversely, the slowest single month of the year, typically falling within the low season, marks the market's lowest point. In this month, revenue might dip to $974, occupancy could drop to 7.5%, and ADRs may adjust down to $201.
- Understanding both the seasonal averages and these monthly peaks and troughs in revenue, occupancy, and ADR is crucial for maximizing your Airbnb profit potential in Otari.
Seasonal Strategies for Maximizing Profit
- Peak Season: Maximize revenue through premium pricing and potentially longer minimum stays. Ensure high availability.
- Low Season: Offer competitive pricing, special promotions (e.g., extended stay discounts), and flexible cancellation policies. Target off-season travelers like remote workers or budget-conscious guests.
- Shoulder Seasons: Implement dynamic pricing that balances peak and low rates. Target weekend travelers or specific events. Offer slightly more flexible terms than peak season.
- Regularly analyze your own performance against these Otari seasonality benchmarks and adjust your pricing and availability strategy accordingly.
Best Areas for Airbnb Investment in Otari (2026)
Exploring the top neighborhoods for short-term rentals in Otari? This section highlights key areas, outlining why they are attractive for hosts and guests, along with notable local attractions. Consider these locations based on your target guest profile and investment strategy.
| Neighborhood / Area | Why Host Here? (Target Guests & Appeal) | Key Attractions & Landmarks |
|---|---|---|
| In Matsukawa Village | A tranquil area with beautiful natural surroundings, ideal for those seeking a quiet retreat. Close to hot springs and suitable for winter sports enthusiasts. | Hotaka Onsen, Matsumoto Castle, Shiga Kogen Ski Area, Onioshidasi Onsen, Matsumoto City Museum of Art |
| Kita-Otari | The northern part of Otari, famous for its accessibility to ski resorts and hiking trails. Attracts outdoor lovers and winter sports fans looking for adventure. | Hakuba Valley Ski Resorts, Otari Village Nature Trail, Saigyouji Temple, Hakubanafuga Ski area |
| Otari Village Center | Central hub for local attractions and amenities. Great for guests who want to explore the local culture and community. | Otari Village Museum, Local shrines, Cafes and shops, Festivals and events |
| Hakuba Valley | World-renowned ski destination with a variety of slopes. Ideal for winter sports enthusiasts and summer activities like hiking and mountain biking. | Hakuba 47 Winter Sports Park, Goryu Ski Resort, Ski jumping stadium, Muro loji ski resort |
| Matsumoto | Nearby city with rich cultural heritage and history. Ideal for guests who want to explore Japanese history and relax in traditional settings. | Matsumoto Castle, Nakamachi Street, Matsumoto Folk Museum, Kamikochi National Park |
| Onioshidasi Onsen | Known for its hot springs and scenic beauty, great for relaxation and enjoying nature. A perfect retreat for guests looking for wellness. | Onioshidasi Hot Springs, Beautiful hiking trails, Local artisans and crafts, Seasonal events |
| Shiga Kogen | One of the largest ski areas in Japan, popular all year round for skiing and hiking. Great for adventure travelers and nature lovers. | Shiga Kogen Ski Area, Hiking trails, Breathtaking alpine scenery, Ryuoo Ski Park |
| Tsugaike Kogen | Well-known ski resort and summer hiking destination. It appeals to families and outdoor enthusiasts looking for a fun and active getaway. | Tsugaike Nature Park, Tsugaike Kogen Ski Resort, Summer flower parks, Lovely panoramic views |
Understanding Airbnb License Requirements & STR Laws in Otari (2026)
Yes, Otari, Nagano Prefecture, Japan enforces high STR regulations. Obtaining a license and ensuring compliance is almost certainly required according to current 2026 STR laws. Always verify the latest short term rental regulations and Airbnb license requirements directly with local government authorities for Otari to ensure full compliance before hosting.
(Source: AirROI data, 2026, based on 93% licensed listings)
Top Performing Airbnb Properties in Otari (2026)
Benchmark your potential! Explore examples of top-performing Airbnb properties in Otaribased on Trailing Twelve Month (TTM) revenue. Analyze their characteristics, revenue, occupancy rate, and ADR to understand what drives success in this market.
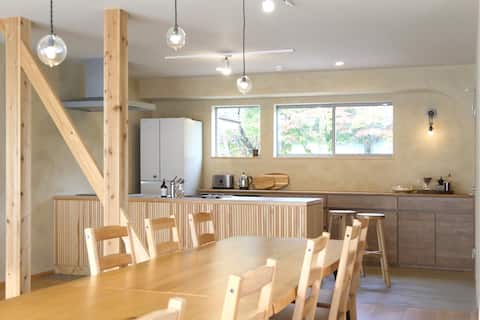
Ski in out / Private Lodge / Tsugaike snow resort
Entire Place • 5 bedrooms
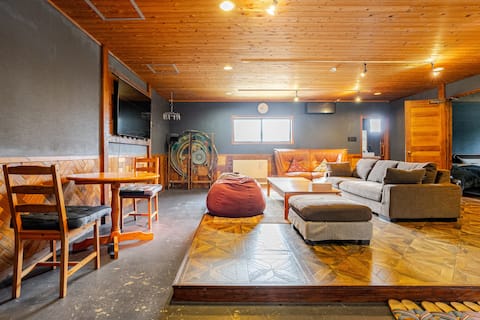
Hakuba Lodge OMUSUBI / ski in ski out location
Entire Place • 2 bedrooms
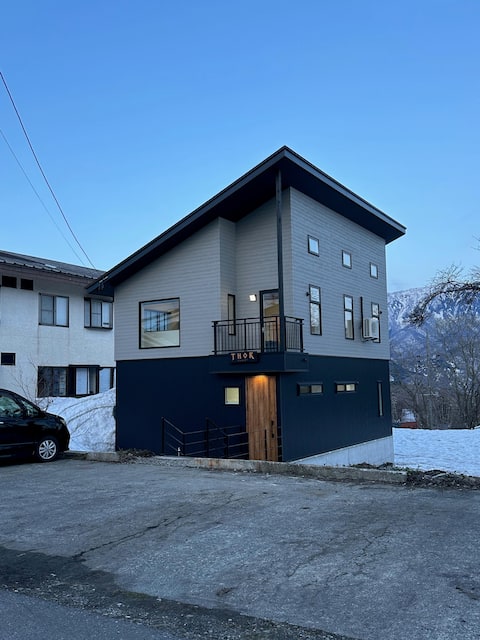
Self Contained chalet ski in/out to Nori/Cortina
Entire Place • 3 bedrooms

Cortina Apartment- ski in-out.
Entire Place • 3 bedrooms

Sunnsnow Tall House ski in/out Hakuba Norikura/car
Entire Place • 2 bedrooms
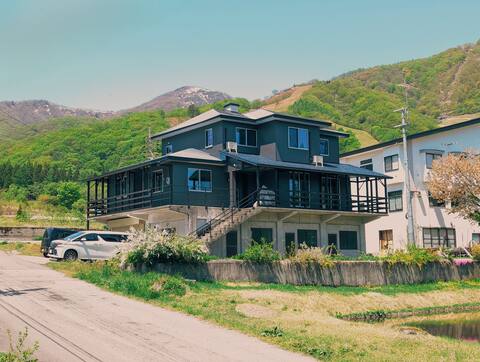
Crows Nest Norikura-walk to lift
Entire Place • 5 bedrooms
Note: Performance varies based on location, size, amenities, seasonality, and management quality. Data reflects the past 12 months.
Top Performing Airbnb Hosts in Otari (2026)
Learn from the best! This table showcases top-performing Airbnb hosts in Otari based on the number of properties managed and estimated total revenue over the past year. Analyze their scale and performance metrics.
| Host Name | Properties | Grossing Revenue | Stay Reviews | Avg Rating |
|---|---|---|---|---|
| Lodge | 4 | $120,847 | 104 | 4.99/5.0 |
| Mark | 3 | $87,241 | 59 | 4.95/5.0 |
| Ryuichi | 1 | $76,395 | 55 | 5.00/5.0 |
| Matt | 4 | $69,057 | 78 | 4.91/5.0 |
| Jason | 1 | $52,558 | 18 | 5.00/5.0 |
| Ado | 12 | $47,641 | 276 | 4.68/5.0 |
| Kazuki | 2 | $41,866 | 13 | 4.59/5.0 |
| Jamsz Pro Team | 1 | $33,135 | 9 | 5.00/5.0 |
| Hamon | 5 | $30,191 | 33 | 4.82/5.0 |
| Kamoshika Japan | 1 | $27,243 | 43 | 4.51/5.0 |
Analyzing the strategies of top hosts, such as their property selection, pricing, and guest communication, can offer valuable lessons for optimizing your own Airbnb operations in Otari.
Dive Deeper: Advanced Otari STR Market Data (2026)
Ready to unlock more insights? AirROI provides access to advanced metrics and comprehensive Airbnb data for Otari. Explore detailed analytics beyond this report to refine your investment strategy, optimize pricing, and maximize your vacation rental profits.
Explore Advanced MetricsOtari Short-Term Rental Market Composition (2026): Property & Room Types
Room Type Distribution
Property Type Distribution
Market Composition Insights for Otari
- The Otari Airbnb market composition is heavily skewed towards Private Room listings, which make up 69% of the 58 active rentals. This indicates strong guest preference for privacy and space.
- Looking at the property type distribution in Otari, Outdoor/Unique properties are the most common (34.5%), reflecting the local real estate landscape.
- Houses represent a significant 29.3% portion, catering likely to families or larger groups.
- The presence of 22.4% Hotel/Boutique listings indicates integration with traditional hospitality.
Otari Airbnb Room Capacity Analysis (2026): Bedroom Distribution
Distribution of Listings by Number of Bedrooms
Room Capacity Insights for Otari
- The dominant room capacity in Otari is 1 bedroom listings, making up 44.8% of the market. This suggests a strong demand for properties suitable for couples or solo travelers.
- Together, 1 bedroom and 5+ bedrooms properties represent 70.7% of the active Airbnb listings in Otari, indicating a high concentration in these sizes.
- A significant 31.0% of listings offer 3+ bedrooms, catering to larger groups and families seeking more space in Otari.
Otari Vacation Rental Guest Capacity Trends (2026)
Distribution of Listings by Guest Capacity
Guest Capacity Insights for Otari
- The most common guest capacity trend in Otari vacation rentals is listings accommodating 2 guests (22.4%). This suggests the primary traveler segment is likely couples or solo travelers.
- Properties designed for 2 guests and 8+ guests dominate the Otari STR market, accounting for 43.1% of listings.
- 27.6% of properties accommodate 6+ guests, serving the market segment for larger families or group travel in Otari.
- On average, properties in Otari are equipped to host 3.6 guests.
Otari Airbnb Booking Patterns (2026): Available vs. Booked Days
Available Days Distribution
Booked Days Distribution
Booking Pattern Insights for Otari
- The most common availability pattern in Otari falls within the 271-366 days range, representing 87.9% of listings. This suggests many properties have significant open periods on their calendars.
- Approximately 98.2% of listings show high availability (181+ days open annually), indicating potential for increased bookings or specific owner usage patterns.
- For booked days, the 1-30 days range is most frequent in Otari (50%), reflecting common guest stay durations or potential owner blocking patterns.
- A notable 1.7% of properties secure long booking periods (181+ days booked per year), highlighting successful long-term rental strategies or significant owner usage.
Otari Airbnb Minimum Stay Requirements Analysis
Distribution of Listings by Minimum Night Requirement
1 Night
17 listings
29.3% of total
2 Nights
6 listings
10.3% of total
3 Nights
1 listings
1.7% of total
4-6 Nights
3 listings
5.2% of total
7-29 Nights
2 listings
3.4% of total
30+ Nights
29 listings
50% of total
Key Insights
- The most prevalent minimum stay requirement in Otari is 30+ Nights, adopted by 50% of listings. This highlights the market's preference for longer commitments.
- A significant segment (50%) caters to monthly stays (30+ nights) in Otari, pointing to opportunities in the extended-stay market.
Recommendations
- Align with the market by considering a 30+ Nights minimum stay, as 50% of Otari hosts use this setting.
- If feasible, allowing 1-night stays, especially midweek or during low season, could capture last-minute bookings, as only 29.3% currently do.
- Explore offering discounts for stays of 30+ nights to attract the 50% of the market seeking extended stays.
- Adjust minimum nights based on seasonality – potentially shorter during low season and longer during peak demand periods in Otari.
Otari Airbnb Cancellation Policy Trends Analysis (2026)
Super Strict 60 Days
7 listings
12.1% of total
Super Strict 30 Days
6 listings
10.3% of total
Flexible
2 listings
3.4% of total
Moderate
1 listings
1.7% of total
Firm
19 listings
32.8% of total
Strict
23 listings
39.7% of total
Cancellation Policy Insights for Otari
- The prevailing Airbnb cancellation policy trend in Otari is Strict, used by 39.7% of listings.
- A majority (72.5%) of hosts in Otari utilize Firm or Strict policies, indicating a market where hosts prioritize booking security.
Recommendations for Hosts
- Consider adopting a Strict policy to align with the 39.7% market standard in Otari.
- With 39.7% using Strict terms, this is a viable option in Otari, particularly for high-value properties or during peak demand periods.
- Regularly review your cancellation policy against competitors and market demand shifts in Otari.
Otari STR Booking Lead Time Analysis (2026)
Average Booking Lead Time by Month
Booking Lead Time Insights for Otari
- The overall average booking lead time for vacation rentals in Otari is 83 days.
- Guests book furthest in advance for stays during January (average 141 days), likely coinciding with peak travel demand or local events.
- The shortest booking windows occur for stays in April (average 5 days), indicating more last-minute travel plans during this time.
- Seasonally, Winter (108 days avg.) sees the longest lead times, while Summer (24 days avg.) has the shortest, reflecting typical travel planning cycles.
Recommendations for Hosts
- Use the overall average lead time (83 days) as a baseline for your pricing and availability strategy in Otari.
- For January stays, consider implementing length-of-stay discounts or slightly higher rates for bookings made less than 141 days out to capitalize on advance planning.
- During April, focus on last-minute booking availability and promotions, as guests book with very short notice (5 days avg.).
- Target marketing efforts for the Winter season well in advance (at least 108 days) to capture early planners.
- Monitor your own booking lead times against these Otari averages to identify opportunities for dynamic pricing adjustments.
Popular & Essential Airbnb Amenities in Otari (2026)
Amenity Prevalence
Amenity Insights for Otari
- Essential amenities in Otari that guests expect include: Free parking on premises, Wifi, Fire extinguisher. Lacking these (any) could significantly impact bookings.
- Popular amenities like Heating, Smoke alarm, Shampoo are common but not universal. Offering these can provide a competitive edge.
Recommendations for Hosts
- Ensure your listing includes all essential amenities for Otari: Free parking on premises, Wifi, Fire extinguisher.
- Prioritize adding missing essentials: Fire extinguisher.
- Consider adding popular differentiators like Heating or Smoke alarm to increase appeal.
- Highlight unique or less common amenities you offer (e.g., hot tub, dedicated workspace, EV charger) in your listing description and photos.
- Regularly check competitor amenities in Otari to stay competitive.
Otari Airbnb Guest Demographics & Profile Analysis (2026)
Guest Profile Summary for Otari
- The typical guest profile for Airbnb in Otari consists of predominantly international visitors (87%), with top international origins including United States, typically belonging to the Post-2000s (Gen Z/Alpha) group (50%), primarily speaking English or Chinese.
- Domestic travelers account for 13.5% of guests.
- Key international markets include Australia (23.6%) and United States (19.1%).
- Top languages spoken are English (47.4%) followed by Chinese (13.2%).
- A significant demographic segment is the Post-2000s (Gen Z/Alpha) group, representing 50% of guests.
Recommendations for Hosts
- Focus marketing internationally, particularly towards travelers from United States.
- Tailor amenities and listing descriptions to appeal to the dominant Post-2000s (Gen Z/Alpha) demographic (e.g., highlight fast WiFi, smart home features, local guides).
- Highlight unique local experiences or amenities relevant to the primary guest profile.
- Consider seasonal promotions aligned with peak travel times for key origin markets.
Nearby Short-Term Rental Market Comparison
How does the Otari Airbnb market stack up against its neighbors? Compare key performance metrics like average monthly revenue, ADR, and occupancy rates in surrounding areas to understand the broader regional STR landscape.
| Market | Active Properties | Monthly Revenue | Daily Rate | Avg. Occupancy |
|---|---|---|---|---|
| Karuizawa | 121 | $3,852 | $396.31 | 39% |
| Miyota | 41 | $3,773 | $284.31 | 43% |
| Fujikawaguchiko | 473 | $3,594 | $242.94 | 51% |
| Shirakawa | 10 | $3,426 | $241.42 | 63% |
| Oshino | 11 | $3,377 | $274.05 | 37% |
| Yamanakako | 181 | $3,294 | $300.49 | 43% |
| Hakuba | 585 | $3,204 | $430.00 | 36% |
| Kusatsu | 37 | $3,105 | $311.94 | 36% |
| Narusawa | 28 | $2,951 | $283.58 | 37% |
| Tsuru | 23 | $2,948 | $218.43 | 50% |