Miyota Airbnb Market Analysis 2026: Short Term Rental Data & Vacation Rental Statistics in Nagano Prefecture, Japan
Is Airbnb profitable in Miyota in 2026? Explore comprehensive Airbnb analytics for Miyota, Nagano Prefecture, Japan to uncover income potential. This 2026 STR market report for Miyota, based on AirROI data from February 2025 to January 2026, reveals key trends in the niche market of 41 active listings.
Whether you're considering an Airbnb investment in Miyota, optimizing your existing vacation rental, or exploring rental arbitrage opportunities, understanding the Miyota Airbnb data is crucial. Navigating the high regulation landscape is key to maximizing your short term rental income potential. Let's dive into the specifics.
Key Miyota Airbnb Performance Metrics Overview
Monthly Airbnb Revenue Variations & Income Potential in Miyota (2026)
Understanding the monthly revenue variations for Airbnb listings in Miyota is key to maximizing your short term rental income potential. Seasonality significantly impacts earnings. Our analysis, based on data from the past 12 months, shows that the peak revenue month for STRs in Miyota is typically August, while January often presents the lowest earnings, highlighting opportunities for strategic pricing adjustments during shoulder and low seasons. Explore the typical Airbnb income in Miyota across different performance tiers:
- Best-in-class properties (Top 10%) achieve $10,529+ monthly, often utilizing dynamic pricing and superior guest experiences.
- Strong performing properties (Top 25%) earn $5,710 or more, indicating effective management and desirable locations/amenities.
- Typical properties (Median) generate around $2,805 per month, representing the average market performance.
- Entry-level properties (Bottom 25%) see earnings around $1,170, often with potential for optimization.
Average Monthly Airbnb Earnings Trend in Miyota
Miyota Airbnb Occupancy Rate Trends (2026)
Maximize your bookings by understanding the Miyota STR occupancy trends. Seasonal demand shifts significantly influence how often properties are booked. Typically, Augustsees the highest demand (peak season occupancy), while January experiences the lowest (low season). Effective strategies, like adjusting minimum stays or offering promotions, can boost occupancy during slower periods. Here's how different property tiers perform in Miyota:
- Best-in-class properties (Top 10%) achieve 84%+ occupancy, indicating high desirability and potentially optimized availability.
- Strong performing properties (Top 25%) maintain 71% or higher occupancy, suggesting good market fit and guest satisfaction.
- Typical properties (Median) have an occupancy rate around 41%.
- Entry-level properties (Bottom 25%) average 21% occupancy, potentially facing higher vacancy.
Average Monthly Occupancy Rate Trend in Miyota
Average Daily Rate (ADR) Airbnb Trends in Miyota (2026)
Effective short term rental pricing strategy in Miyota involves understanding monthly ADR fluctuations. The Average Daily Rate (ADR) for Airbnb in Miyota typically peaks in August and dips lowest during February. Leveraging Airbnb dynamic pricing tools or strategies based on this seasonality can significantly boost revenue. Here's a look at the typical nightly rates achieved:
- Best-in-class properties (Top 10%) command rates of $548+ per night, often due to premium features or locations.
- Strong performing properties (Top 25%) achieve nightly rates of $384 or more.
- Typical properties (Median) charge around $213 per night.
- Entry-level properties (Bottom 25%) earn around $138 per night.
Average Daily Rate (ADR) Trend by Month in Miyota
Get Live Miyota Market Intelligence 👇

Explore Real-time Analytics
Airbnb Seasonality Analysis & Trends in Miyota (2026)
Peak Season (August, September, March)
- Revenue averages $5,962 per month
- Occupancy rates average 54.4%
- Daily rates average $308
Shoulder Season
- Revenue averages $3,874 per month
- Occupancy maintains around 43.9%
- Daily rates hold near $282
Low Season (January, April, November)
- Revenue drops to average $3,243 per month
- Occupancy decreases to average 41.0%
- Daily rates adjust to average $262
Seasonality Insights for Miyota
- The Airbnb seasonality in Miyota shows highly seasonal trends requiring careful strategy. While the sections above show seasonal averages, it's also insightful to look at the extremes:
- During the high season, the absolute peak month showcases Miyota's highest earning potential, with monthly revenues capable of climbing to $8,662, occupancy reaching a high of 63.8%, and ADRs peaking at $364.
- Conversely, the slowest single month of the year, typically falling within the low season, marks the market's lowest point. In this month, revenue might dip to $2,924, occupancy could drop to 34.8%, and ADRs may adjust down to $253.
- Understanding both the seasonal averages and these monthly peaks and troughs in revenue, occupancy, and ADR is crucial for maximizing your Airbnb profit potential in Miyota.
Seasonal Strategies for Maximizing Profit
- Peak Season: Maximize revenue through premium pricing and potentially longer minimum stays. Ensure high availability.
- Low Season: Offer competitive pricing, special promotions (e.g., extended stay discounts), and flexible cancellation policies. Target off-season travelers like remote workers or budget-conscious guests.
- Shoulder Seasons: Implement dynamic pricing that balances peak and low rates. Target weekend travelers or specific events. Offer slightly more flexible terms than peak season.
- Regularly analyze your own performance against these Miyota seasonality benchmarks and adjust your pricing and availability strategy accordingly.
Best Areas for Airbnb Investment in Miyota (2026)
Exploring the top neighborhoods for short-term rentals in Miyota? This section highlights key areas, outlining why they are attractive for hosts and guests, along with notable local attractions. Consider these locations based on your target guest profile and investment strategy.
| Neighborhood / Area | Why Host Here? (Target Guests & Appeal) | Key Attractions & Landmarks |
|---|---|---|
| Miyota Town Center | The heart of Miyota, filled with local shops, cafes, and restaurants. Ideal for guests wanting to experience the local lifestyle and accessibility to public transport. | Miyota Village Park, Local markets, Miyota Town Museum, Shops and restaurants |
| Matsukawa Onsen | A serene hot spring area known for its relaxing atmosphere and stunning natural beauty. Perfect for guests looking to unwind and enjoy the outdoors. | Matsukawa Hot Springs, Hiking trails, Scenic views of the mountains, Local ryokans (traditional inns) |
| Kita Yatsugatake | This area offers breathtaking views and outdoor activities like hiking and skiing, making it a great choice for adventure seekers and nature lovers. | Yatsugatake Mountains, Hiking trails in summer, Ski resorts in winter, Scenic lakes |
| Nagano Soccer Park | A sports-centric location that hosts various tournaments and events, appealing to sports enthusiasts and families visiting for competitions. | Nagano Soccer Park facilities, Sports events, Recreational areas, Playgrounds |
| Miyota Kogen | A scenic highland area offering lush nature and a tranquil environment. Great for tourists seeking peace and natural beauty. | Nature trails, Mountain views, Local wildlife, Picnic spots |
| Yachiho Highland | Known for its cool climate and beautiful landscapes, this area attracts visitors for its outdoor sports and relaxation opportunities. | Hiking, Cycling, Scenic viewpoints, Campsites |
| Shinshu Wine Valley | Famous for its vineyards and wineries, attracting wine lovers and tourists searching for unique local experiences. | Local wineries, Wine tasting tours, Beautiful vineyard scenery, Farmers markets |
| Matsumoto City | Nearby Matsumoto offers a cultural experience with historical sites, festivals, and vibrant local life, a short distance from Miyota. | Matsumoto Castle, Nakamachi Street, Matsumoto Art Museum, local festivals |
Understanding Airbnb License Requirements & STR Laws in Miyota (2026)
Yes, Miyota, Nagano Prefecture, Japan enforces high STR regulations. Obtaining a license and ensuring compliance is almost certainly required according to current 2026 STR laws. Always verify the latest short term rental regulations and Airbnb license requirements directly with local government authorities for Miyota to ensure full compliance before hosting.
(Source: AirROI data, 2026, based on 100% licensed listings)
Top Performing Airbnb Properties in Miyota (2026)
Benchmark your potential! Explore examples of top-performing Airbnb properties in Miyotabased on Trailing Twelve Month (TTM) revenue. Analyze their characteristics, revenue, occupancy rate, and ADR to understand what drives success in this market.
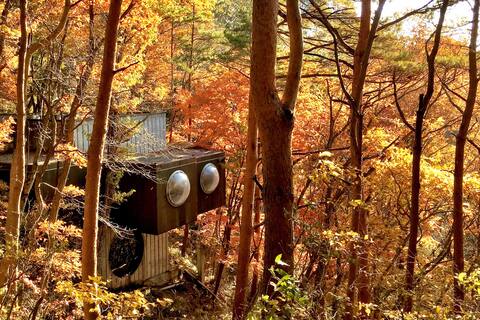
Capsule House-K, a monumental capsule house in nature designed by Kisho Kurokawa
Entire Place • 4 bedrooms

Tsukimichi ~ Karuizawa Sauna · BBQ Facilities Included, Entire Hotel Rental ~
Entire Place • 3 bedrooms

Newly built in 2022, featured on TV many times, luxury secret base for adults, 120㎡ sauna, jacuzzi,
Entire Place • 3 bedrooms

Newly built in 2022 · Luxurious secret base for adults 120 ㎡ Sauna, Jacuzzi, Stone bath, Bonfire, BB
Entire Place • 3 bedrooms

Dog-Friendly Vacation Rental in West Karuizawa
Entire Place • 2 bedrooms

Karuizawa villa with a stream flowing through it
Entire Place • 2 bedrooms
Note: Performance varies based on location, size, amenities, seasonality, and management quality. Data reflects the past 12 months.
Top Performing Airbnb Hosts in Miyota (2026)
Learn from the best! This table showcases top-performing Airbnb hosts in Miyota based on the number of properties managed and estimated total revenue over the past year. Analyze their scale and performance metrics.
| Host Name | Properties | Grossing Revenue | Stay Reviews | Avg Rating |
|---|---|---|---|---|
| Saunaforestcabin | 4 | $427,209 | 793 | 4.89/5.0 |
| Tetsuya | 2 | $193,993 | 45 | 4.75/5.0 |
| レンタヴィラ | 7 | $185,919 | 298 | 4.82/5.0 |
| 沖 | 2 | $175,763 | 124 | 4.67/5.0 |
| 黒川 | 1 | $162,754 | 20 | 5.00/5.0 |
| 株式会社トライハク | 1 | $114,310 | 21 | 4.90/5.0 |
| Tinycabintategu | 2 | $109,744 | 340 | 4.77/5.0 |
| Fuu And Shu | 1 | $81,996 | 235 | 4.71/5.0 |
| DogrunCafe And Resorts JENNIE | 7 | $71,118 | 405 | 4.54/5.0 |
| Annex | 1 | $70,514 | 109 | 4.91/5.0 |
Analyzing the strategies of top hosts, such as their property selection, pricing, and guest communication, can offer valuable lessons for optimizing your own Airbnb operations in Miyota.
Dive Deeper: Advanced Miyota STR Market Data (2026)
Ready to unlock more insights? AirROI provides access to advanced metrics and comprehensive Airbnb data for Miyota. Explore detailed analytics beyond this report to refine your investment strategy, optimize pricing, and maximize your vacation rental profits.
Explore Advanced MetricsMiyota Short-Term Rental Market Composition (2026): Property & Room Types
Room Type Distribution
Property Type Distribution
Market Composition Insights for Miyota
- The Miyota Airbnb market composition is heavily skewed towards Entire Home/Apt listings, which make up 92.7% of the 41 active rentals. This indicates strong guest preference for privacy and space.
- Looking at the property type distribution in Miyota, House properties are the most common (68.3%), reflecting the local real estate landscape.
- Houses represent a significant 68.3% portion, catering likely to families or larger groups.
- Smaller segments like hotel/boutique (combined 4.9%) offer potential for unique stay experiences.
Miyota Airbnb Room Capacity Analysis (2026): Bedroom Distribution
Distribution of Listings by Number of Bedrooms
Room Capacity Insights for Miyota
- The dominant room capacity in Miyota is 1 bedroom listings, making up 39% of the market. This suggests a strong demand for properties suitable for couples or solo travelers.
- Together, 1 bedroom and 2 bedrooms properties represent 75.6% of the active Airbnb listings in Miyota, indicating a high concentration in these sizes.
- A significant 24.4% of listings offer 3+ bedrooms, catering to larger groups and families seeking more space in Miyota.
Miyota Vacation Rental Guest Capacity Trends (2026)
Distribution of Listings by Guest Capacity
Guest Capacity Insights for Miyota
- The most common guest capacity trend in Miyota vacation rentals is listings accommodating 2 guests (26.8%). This suggests the primary traveler segment is likely couples or solo travelers.
- Properties designed for 2 guests and 8+ guests dominate the Miyota STR market, accounting for 48.8% of listings.
- 46.4% of properties accommodate 6+ guests, serving the market segment for larger families or group travel in Miyota.
- On average, properties in Miyota are equipped to host 5.0 guests.
Miyota Airbnb Booking Patterns (2026): Available vs. Booked Days
Available Days Distribution
Booked Days Distribution
Booking Pattern Insights for Miyota
- The most common availability pattern in Miyota falls within the 271-366 days range, representing 39% of listings. This suggests many properties have significant open periods on their calendars.
- Approximately 63.4% of listings show high availability (181+ days open annually), indicating potential for increased bookings or specific owner usage patterns.
- For booked days, the 91-180 days range is most frequent in Miyota (26.8%), reflecting common guest stay durations or potential owner blocking patterns.
- A notable 36.6% of properties secure long booking periods (181+ days booked per year), highlighting successful long-term rental strategies or significant owner usage.
Miyota Airbnb Minimum Stay Requirements Analysis
Distribution of Listings by Minimum Night Requirement
1 Night
29 listings
70.7% of total
2 Nights
4 listings
9.8% of total
30+ Nights
8 listings
19.5% of total
Key Insights
- The most prevalent minimum stay requirement in Miyota is 1 Night, adopted by 70.7% of listings. This highlights the market's preference for shorter, flexible bookings.
- A strong majority (80.5%) of the Miyota Airbnb data shows acceptance of very short stays (1-2 nights), indicating a dynamic, high-turnover market.
- A significant segment (19.5%) caters to monthly stays (30+ nights) in Miyota, pointing to opportunities in the extended-stay market.
Recommendations
- Align with the market by considering a 1 Night minimum stay, as 70.7% of Miyota hosts use this setting.
- Explore offering discounts for stays of 30+ nights to attract the 19.5% of the market seeking extended stays.
- Adjust minimum nights based on seasonality – potentially shorter during low season and longer during peak demand periods in Miyota.
Miyota Airbnb Cancellation Policy Trends Analysis (2026)
Flexible
2 listings
4.9% of total
Moderate
15 listings
36.6% of total
Firm
21 listings
51.2% of total
Strict
3 listings
7.3% of total
Cancellation Policy Insights for Miyota
- The prevailing Airbnb cancellation policy trend in Miyota is Firm, used by 51.2% of listings.
- A majority (58.5%) of hosts in Miyota utilize Firm or Strict policies, indicating a market where hosts prioritize booking security.
- Strict cancellation policies are quite rare (7.3%), potentially making listings with this policy less competitive unless justified by high demand or property type.
Recommendations for Hosts
- Consider adopting a Firm policy to align with the 51.2% market standard in Miyota.
- Using a Strict policy might deter some guests, as only 7.3% of listings use it. Evaluate if potential revenue protection outweighs possible lower booking rates.
- Regularly review your cancellation policy against competitors and market demand shifts in Miyota.
Miyota STR Booking Lead Time Analysis (2026)
Average Booking Lead Time by Month
Booking Lead Time Insights for Miyota
- The overall average booking lead time for vacation rentals in Miyota is 34 days.
- Guests book furthest in advance for stays during August (average 56 days), likely coinciding with peak travel demand or local events.
- The shortest booking windows occur for stays in March (average 18 days), indicating more last-minute travel plans during this time.
- Seasonally, Summer (44 days avg.) sees the longest lead times, while Spring (26 days avg.) has the shortest, reflecting typical travel planning cycles.
Recommendations for Hosts
- Use the overall average lead time (34 days) as a baseline for your pricing and availability strategy in Miyota.
- For August stays, consider implementing length-of-stay discounts or slightly higher rates for bookings made less than 56 days out to capitalize on advance planning.
- Target marketing efforts for the Summer season well in advance (at least 44 days) to capture early planners.
- Monitor your own booking lead times against these Miyota averages to identify opportunities for dynamic pricing adjustments.
Popular & Essential Airbnb Amenities in Miyota (2026)
Amenity Prevalence
Amenity Insights for Miyota
- Essential amenities in Miyota that guests expect include: Shampoo, Heating, Air conditioning, Body soap, Hair dryer, Conditioner, Free parking on premises, Wifi, Essentials. Lacking these (any) could significantly impact bookings.
- Popular amenities like Fire extinguisher are common but not universal. Offering these can provide a competitive edge.
Recommendations for Hosts
- Ensure your listing includes all essential amenities for Miyota: Shampoo, Heating, Air conditioning, Body soap, Hair dryer, Conditioner, Free parking on premises, Wifi, Essentials.
- Prioritize adding missing essentials: Air conditioning, Body soap, Hair dryer, Conditioner, Free parking on premises, Wifi, Essentials.
- Consider adding popular differentiators like Fire extinguisher to increase appeal.
- Highlight unique or less common amenities you offer (e.g., hot tub, dedicated workspace, EV charger) in your listing description and photos.
- Regularly check competitor amenities in Miyota to stay competitive.
Miyota Airbnb Guest Demographics & Profile Analysis (2026)
Guest Profile Summary for Miyota
- The typical guest profile for Airbnb in Miyota consists of a mix of domestic (52%) and international guests, often arriving from nearby Yokohama, typically belonging to the Post-2000s (Gen Z/Alpha) group (50%), primarily speaking English or Japanese.
- Domestic travelers account for 51.8% of guests.
- Key international markets include Japan (51.8%) and Singapore (11.5%).
- Top languages spoken are English (40%) followed by Japanese (33.8%).
- A significant demographic segment is the Post-2000s (Gen Z/Alpha) group, representing 50% of guests.
Recommendations for Hosts
- Balance marketing efforts between domestic and international channels based on the guest mix.
- Tailor amenities and listing descriptions to appeal to the dominant Post-2000s (Gen Z/Alpha) demographic (e.g., highlight fast WiFi, smart home features, local guides).
- Highlight unique local experiences or amenities relevant to the primary guest profile.
- Consider seasonal promotions aligned with peak travel times for key origin markets.
Nearby Short-Term Rental Market Comparison
How does the Miyota Airbnb market stack up against its neighbors? Compare key performance metrics like average monthly revenue, ADR, and occupancy rates in surrounding areas to understand the broader regional STR landscape.
| Market | Active Properties | Monthly Revenue | Daily Rate | Avg. Occupancy |
|---|---|---|---|---|
| Shinagawa City | 50 | $7,769 | $428.93 | 62% |
| Futtsu | 31 | $5,187 | $369.80 | 44% |
| Kyonan | 15 | $5,099 | $419.89 | 42% |
| Adachi City | 47 | $4,752 | $301.69 | 50% |
| Kita | 15 | $4,563 | $305.24 | 57% |
| Nagatoro | 10 | $4,035 | $249.70 | 52% |
| Hakone | 335 | $3,905 | $289.84 | 48% |
| Karuizawa | 121 | $3,852 | $396.31 | 39% |
| Minato City | 99 | $3,809 | $311.75 | 53% |
| Fujikawaguchiko | 473 | $3,594 | $242.94 | 51% |