Kumamoto Airbnb Market Analysis 2026: Short Term Rental Data & Vacation Rental Statistics in Kumamoto Prefecture, Japan
Is Airbnb profitable in Kumamoto in 2026? Explore comprehensive Airbnb analytics for Kumamoto, Kumamoto Prefecture, Japan to uncover income potential. This 2026 STR market report for Kumamoto, based on AirROI data from February 2025 to January 2026, reveals key trends in the market of 266 active listings.
Whether you're considering an Airbnb investment in Kumamoto, optimizing your existing vacation rental, or exploring rental arbitrage opportunities, understanding the Kumamoto Airbnb data is crucial. Navigating the high regulation landscape is key to maximizing your short term rental income potential. Let's dive into the specifics.
Key Kumamoto Airbnb Performance Metrics Overview
Monthly Airbnb Revenue Variations & Income Potential in Kumamoto (2026)
Understanding the monthly revenue variations for Airbnb listings in Kumamoto is key to maximizing your short term rental income potential. Seasonality significantly impacts earnings. Our analysis, based on data from the past 12 months, shows that the peak revenue month for STRs in Kumamoto is typically March, while January often presents the lowest earnings, highlighting opportunities for strategic pricing adjustments during shoulder and low seasons. Explore the typical Airbnb income in Kumamoto across different performance tiers:
- Best-in-class properties (Top 10%) achieve $2,888+ monthly, often utilizing dynamic pricing and superior guest experiences.
- Strong performing properties (Top 25%) earn $1,778 or more, indicating effective management and desirable locations/amenities.
- Typical properties (Median) generate around $985 per month, representing the average market performance.
- Entry-level properties (Bottom 25%) see earnings around $529, often with potential for optimization.
Average Monthly Airbnb Earnings Trend in Kumamoto
Kumamoto Airbnb Occupancy Rate Trends (2026)
Maximize your bookings by understanding the Kumamoto STR occupancy trends. Seasonal demand shifts significantly influence how often properties are booked. Typically, Februarysees the highest demand (peak season occupancy), while January experiences the lowest (low season). Effective strategies, like adjusting minimum stays or offering promotions, can boost occupancy during slower periods. Here's how different property tiers perform in Kumamoto:
- Best-in-class properties (Top 10%) achieve 84%+ occupancy, indicating high desirability and potentially optimized availability.
- Strong performing properties (Top 25%) maintain 71% or higher occupancy, suggesting good market fit and guest satisfaction.
- Typical properties (Median) have an occupancy rate around 52%.
- Entry-level properties (Bottom 25%) average 29% occupancy, potentially facing higher vacancy.
Average Monthly Occupancy Rate Trend in Kumamoto
Average Daily Rate (ADR) Airbnb Trends in Kumamoto (2026)
Effective short term rental pricing strategy in Kumamoto involves understanding monthly ADR fluctuations. The Average Daily Rate (ADR) for Airbnb in Kumamoto typically peaks in July and dips lowest during February. Leveraging Airbnb dynamic pricing tools or strategies based on this seasonality can significantly boost revenue. Here's a look at the typical nightly rates achieved:
- Best-in-class properties (Top 10%) command rates of $174+ per night, often due to premium features or locations.
- Strong performing properties (Top 25%) achieve nightly rates of $104 or more.
- Typical properties (Median) charge around $69 per night.
- Entry-level properties (Bottom 25%) earn around $47 per night.
Average Daily Rate (ADR) Trend by Month in Kumamoto
Get Live Kumamoto Market Intelligence 👇

Explore Real-time Analytics
Airbnb Seasonality Analysis & Trends in Kumamoto (2026)
Peak Season (March, August, October)
- Revenue averages $1,511 per month
- Occupancy rates average 55.0%
- Daily rates average $88
Shoulder Season
- Revenue averages $1,378 per month
- Occupancy maintains around 51.6%
- Daily rates hold near $88
Low Season (January, June, September)
- Revenue drops to average $1,169 per month
- Occupancy decreases to average 43.6%
- Daily rates adjust to average $86
Seasonality Insights for Kumamoto
- The Airbnb seasonality in Kumamoto shows moderate seasonality with distinct peak and low periods. While the sections above show seasonal averages, it's also insightful to look at the extremes:
- During the high season, the absolute peak month showcases Kumamoto's highest earning potential, with monthly revenues capable of climbing to $1,561, occupancy reaching a high of 59.9%, and ADRs peaking at $94.
- Conversely, the slowest single month of the year, typically falling within the low season, marks the market's lowest point. In this month, revenue might dip to $1,019, occupancy could drop to 35.7%, and ADRs may adjust down to $83.
- Understanding both the seasonal averages and these monthly peaks and troughs in revenue, occupancy, and ADR is crucial for maximizing your Airbnb profit potential in Kumamoto.
Seasonal Strategies for Maximizing Profit
- Peak Season: Maximize revenue through premium pricing and potentially longer minimum stays. Ensure high availability.
- Low Season: Offer competitive pricing, special promotions (e.g., extended stay discounts), and flexible cancellation policies. Target off-season travelers like remote workers or budget-conscious guests.
- Shoulder Seasons: Implement dynamic pricing that balances peak and low rates. Target weekend travelers or specific events. Offer slightly more flexible terms than peak season.
- Regularly analyze your own performance against these Kumamoto seasonality benchmarks and adjust your pricing and availability strategy accordingly.
Best Areas for Airbnb Investment in Kumamoto (2026)
Exploring the top neighborhoods for short-term rentals in Kumamoto? This section highlights key areas, outlining why they are attractive for hosts and guests, along with notable local attractions. Consider these locations based on your target guest profile and investment strategy.
| Neighborhood / Area | Why Host Here? (Target Guests & Appeal) | Key Attractions & Landmarks |
|---|---|---|
| Kumamoto Castle Area | A historic area known for its beautiful castle and surrounding gardens. A prime choice for tourists wanting to explore Japanese history and culture. | Kumamoto Castle, Suizenji Jojuen Garden, Contemporary Art Museum Kumamoto, Shinmachi Furumachi, Kumamoto Prefectural Traditional Craft Centre |
| Shimotori Shopping District | A bustling shopping area filled with stores, restaurants, and entertainment options. Great for tourists looking for local shopping and urban experiences. | Shimotori Street, Kamikawa Shrine, Kumamoto Shoten, various cafes and eateries, local artisan shops |
| Kikuchi Valley | Known for its natural beauty, hot springs, and outdoor activities. Attracts nature lovers and those looking for a relaxing retreat. | Kikuchi Valley Hot Springs, Kikuchi Park, Hiking trails, Cafes with scenic views, Nature observation spots |
| Tsuetate Onsen | A famous hot spring area surrounded by beautiful mountains, attracting visitors seeking relaxation and wellness. | Tsuetate Onsen Hot Springs, Kusasenrigahama, Natural hot spring baths, Local ryokan, Scenic mountain views |
| Kumamoto City Centre | The vibrant heart of Kumamoto, with numerous dining, shopping, and entertainment options. Ideal for urban travelers and business visitors. | Shinshigai Shopping Arcade, Cultural facilities, Restaurants and izakaya, Public transportation hubs, City parks |
| Yatsushiro | Offers a mix of historical sites and natural landscapes, attracting visitors interested in both culture and nature. | Yatsushiro Castle Ruins, Kamo River, Local festivals, Historical museums, Scenic walking trails |
| Takamori | Nestled in the mountains, this area is perfect for outdoor enthusiasts and those looking for a retreat in nature. | Aso Kuju National Park, Hiking and trekking routes, Local farms, Nature experiences, Scenic views of Mt. Aso |
| Mount Aso | An active volcanic area known for its breathtaking landscapes and outdoor activities, attracting adventurous travelers. | Aso caldera, Viewpoints, Hot springs, Hiking trails, Nature parks |
Understanding Airbnb License Requirements & STR Laws in Kumamoto (2026)
Yes, Kumamoto, Kumamoto Prefecture, Japan enforces high STR regulations. Obtaining a license and ensuring compliance is almost certainly required according to current 2026 STR laws. Always verify the latest short term rental regulations and Airbnb license requirements directly with local government authorities for Kumamoto to ensure full compliance before hosting.
(Source: AirROI data, 2026, based on 98% licensed listings)
Top Performing Airbnb Properties in Kumamoto (2026)
Benchmark your potential! Explore examples of top-performing Airbnb properties in Kumamotobased on Trailing Twelve Month (TTM) revenue. Analyze their characteristics, revenue, occupancy rate, and ADR to understand what drives success in this market.
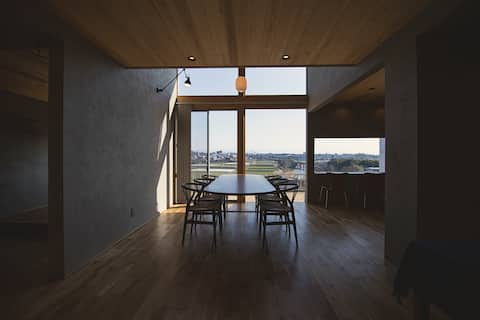
Limited to one group per day, this inn with a private sauna has a view of Mt. Aso and the Shirakawa
Entire Place • 4 bedrooms
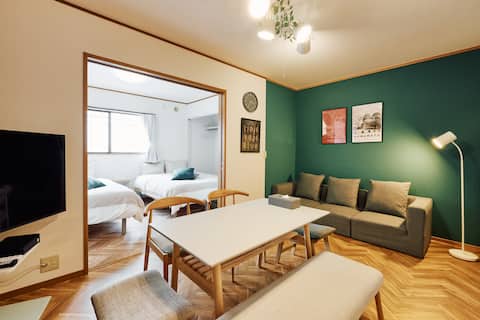
2-Story House / near City Center & Castle
Entire Place • 3 bedrooms
Opensale30%off/KumamoStation/freeparking/game/WiFi
Entire Place • 4 bedrooms
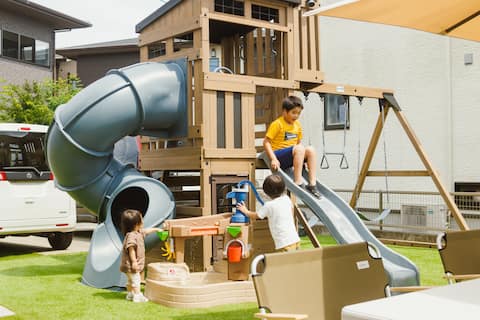
Full stock of baby supplies!/Play Ground & BBQ/Family fun with a large TV/Theater room/13 people all
Entire Place • 3 bedrooms

Sumitsugu House Station/Entire House/Free Parking
Entire Place • 3 bedrooms

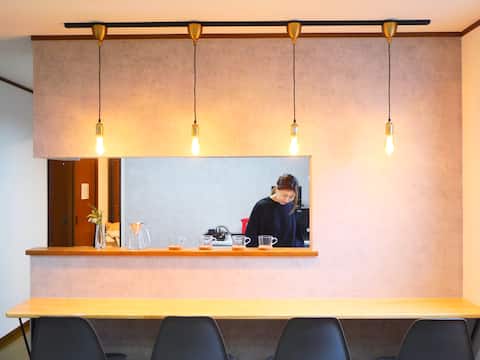
8 min. walk from Kumamoto sta,Japanese style villa
Entire Place • 3 bedrooms
Note: Performance varies based on location, size, amenities, seasonality, and management quality. Data reflects the past 12 months.
Top Performing Airbnb Hosts in Kumamoto (2026)
Learn from the best! This table showcases top-performing Airbnb hosts in Kumamoto based on the number of properties managed and estimated total revenue over the past year. Analyze their scale and performance metrics.
| Host Name | Properties | Grossing Revenue | Stay Reviews | Avg Rating |
|---|---|---|---|---|
| Owners.Inn | 32 | $551,340 | 2040 | 4.71/5.0 |
| Your Room | 14 | $337,929 | 1368 | 4.79/5.0 |
| Ken BandS | 54 | $321,621 | 1524 | 4.54/5.0 |
| Estlife | 31 | $248,392 | 1859 | 4.54/5.0 |
| Vettä | 10 | $179,796 | 363 | 4.73/5.0 |
| Team Life Is Journey | 9 | $178,067 | 3060 | 4.82/5.0 |
| Sho Family | 3 | $106,886 | 313 | 4.80/5.0 |
| Yoon | 1 | $103,318 | 158 | 4.97/5.0 |
| Shinta | 2 | $93,493 | 234 | 4.96/5.0 |
| 料理谷邸 葛籠〜つづら〜 | 7 | $76,331 | 120 | 4.84/5.0 |
Analyzing the strategies of top hosts, such as their property selection, pricing, and guest communication, can offer valuable lessons for optimizing your own Airbnb operations in Kumamoto.
Dive Deeper: Advanced Kumamoto STR Market Data (2026)
Ready to unlock more insights? AirROI provides access to advanced metrics and comprehensive Airbnb data for Kumamoto. Explore detailed analytics beyond this report to refine your investment strategy, optimize pricing, and maximize your vacation rental profits.
Explore Advanced MetricsKumamoto Short-Term Rental Market Composition (2026): Property & Room Types
Room Type Distribution
Property Type Distribution
Market Composition Insights for Kumamoto
- The Kumamoto Airbnb market composition is heavily skewed towards Entire Home/Apt listings, which make up 85% of the 266 active rentals. This indicates strong guest preference for privacy and space.
- Looking at the property type distribution in Kumamoto, Apartment/Condo properties are the most common (70.3%), reflecting the local real estate landscape.
- Houses represent a significant 24.1% portion, catering likely to families or larger groups.
- Smaller segments like outdoor/unique, hotel/boutique (combined 5.6%) offer potential for unique stay experiences.
Kumamoto Airbnb Room Capacity Analysis (2026): Bedroom Distribution
Distribution of Listings by Number of Bedrooms
Room Capacity Insights for Kumamoto
- The dominant room capacity in Kumamoto is 1 bedroom listings, making up 54.1% of the market. This suggests a strong demand for properties suitable for couples or solo travelers.
- Together, 1 bedroom and 2 bedrooms properties represent 75.2% of the active Airbnb listings in Kumamoto, indicating a high concentration in these sizes.
- With over half the market (54.1%) consisting of studios or 1-bedroom units, Kumamoto is particularly well-suited for individuals or couples.
Kumamoto Vacation Rental Guest Capacity Trends (2026)
Distribution of Listings by Guest Capacity
Guest Capacity Insights for Kumamoto
- The most common guest capacity trend in Kumamoto vacation rentals is listings accommodating 4 guests (19.9%). This suggests the primary traveler segment is likely small families or groups.
- Properties designed for 4 guests and 3 guests dominate the Kumamoto STR market, accounting for 39.1% of listings.
- 31.6% of properties accommodate 6+ guests, serving the market segment for larger families or group travel in Kumamoto.
- On average, properties in Kumamoto are equipped to host 4.2 guests.
Kumamoto Airbnb Booking Patterns (2026): Available vs. Booked Days
Available Days Distribution
Booked Days Distribution
Booking Pattern Insights for Kumamoto
- The most common availability pattern in Kumamoto falls within the 91-180 days range, representing 35.7% of listings. This suggests many properties have significant open periods on their calendars.
- Approximately 56.0% of listings show high availability (181+ days open annually), indicating potential for increased bookings or specific owner usage patterns.
- For booked days, the 181-270 days range is most frequent in Kumamoto (35%), reflecting common guest stay durations or potential owner blocking patterns.
- A notable 44.8% of properties secure long booking periods (181+ days booked per year), highlighting successful long-term rental strategies or significant owner usage.
Kumamoto Airbnb Minimum Stay Requirements Analysis
Distribution of Listings by Minimum Night Requirement
1 Night
155 listings
58.3% of total
2 Nights
73 listings
27.4% of total
3 Nights
1 listings
0.4% of total
4-6 Nights
5 listings
1.9% of total
30+ Nights
32 listings
12% of total
Key Insights
- The most prevalent minimum stay requirement in Kumamoto is 1 Night, adopted by 58.3% of listings. This highlights the market's preference for shorter, flexible bookings.
- A strong majority (85.7%) of the Kumamoto Airbnb data shows acceptance of very short stays (1-2 nights), indicating a dynamic, high-turnover market.
- A significant segment (12%) caters to monthly stays (30+ nights) in Kumamoto, pointing to opportunities in the extended-stay market.
Recommendations
- Align with the market by considering a 1 Night minimum stay, as 58.3% of Kumamoto hosts use this setting.
- Explore offering discounts for stays of 30+ nights to attract the 12% of the market seeking extended stays.
- Adjust minimum nights based on seasonality – potentially shorter during low season and longer during peak demand periods in Kumamoto.
Kumamoto Airbnb Cancellation Policy Trends Analysis (2026)
Limited
1 listings
0.4% of total
Flexible
36 listings
13.5% of total
Moderate
162 listings
60.9% of total
Firm
61 listings
22.9% of total
Strict
6 listings
2.3% of total
Cancellation Policy Insights for Kumamoto
- The prevailing Airbnb cancellation policy trend in Kumamoto is Moderate, used by 60.9% of listings.
- The market strongly favors guest-friendly terms, with 74.4% of listings offering Flexible or Moderate policies. This suggests guests in Kumamoto may expect booking flexibility.
- Strict cancellation policies are quite rare (2.3%), potentially making listings with this policy less competitive unless justified by high demand or property type.
Recommendations for Hosts
- Consider adopting a Moderate policy to align with the 60.9% market standard in Kumamoto.
- Using a Strict policy might deter some guests, as only 2.3% of listings use it. Evaluate if potential revenue protection outweighs possible lower booking rates.
- Regularly review your cancellation policy against competitors and market demand shifts in Kumamoto.
Kumamoto STR Booking Lead Time Analysis (2026)
Average Booking Lead Time by Month
Booking Lead Time Insights for Kumamoto
- The overall average booking lead time for vacation rentals in Kumamoto is 39 days.
- Guests book furthest in advance for stays during November (average 49 days), likely coinciding with peak travel demand or local events.
- The shortest booking windows occur for stays in June (average 34 days), indicating more last-minute travel plans during this time.
- Seasonally, Fall (46 days avg.) sees the longest lead times, while Summer (37 days avg.) has the shortest, reflecting typical travel planning cycles.
Recommendations for Hosts
- Use the overall average lead time (39 days) as a baseline for your pricing and availability strategy in Kumamoto.
- Target marketing efforts for the Fall season well in advance (at least 46 days) to capture early planners.
- Monitor your own booking lead times against these Kumamoto averages to identify opportunities for dynamic pricing adjustments.
Popular & Essential Airbnb Amenities in Kumamoto (2026)
Amenity Prevalence
Amenity Insights for Kumamoto
- Essential amenities in Kumamoto that guests expect include: Air conditioning, Smoke alarm, Wifi, Hair dryer, Shampoo. Lacking these (any) could significantly impact bookings.
- Popular amenities like Hangers, Washer, Essentials are common but not universal. Offering these can provide a competitive edge.
Recommendations for Hosts
- Ensure your listing includes all essential amenities for Kumamoto: Air conditioning, Smoke alarm, Wifi, Hair dryer, Shampoo.
- Prioritize adding missing essentials: Smoke alarm, Wifi, Hair dryer, Shampoo.
- Consider adding popular differentiators like Hangers or Washer to increase appeal.
- Highlight unique or less common amenities you offer (e.g., hot tub, dedicated workspace, EV charger) in your listing description and photos.
- Regularly check competitor amenities in Kumamoto to stay competitive.
Kumamoto Airbnb Guest Demographics & Profile Analysis (2026)
Guest Profile Summary for Kumamoto
- The typical guest profile for Airbnb in Kumamoto consists of predominantly international visitors (88%), with top international origins including Taiwan, typically belonging to the Post-2000s (Gen Z/Alpha) group (50%), primarily speaking English or Chinese.
- Domestic travelers account for 11.8% of guests.
- Key international markets include Japan (11.8%) and Taiwan (10.9%).
- Top languages spoken are English (41%) followed by Chinese (20.7%).
- A significant demographic segment is the Post-2000s (Gen Z/Alpha) group, representing 50% of guests.
Recommendations for Hosts
- Focus marketing internationally, particularly towards travelers from Taiwan.
- Tailor amenities and listing descriptions to appeal to the dominant Post-2000s (Gen Z/Alpha) demographic (e.g., highlight fast WiFi, smart home features, local guides).
- Highlight unique local experiences or amenities relevant to the primary guest profile.
- Consider seasonal promotions aligned with peak travel times for key origin markets.
Nearby Short-Term Rental Market Comparison
How does the Kumamoto Airbnb market stack up against its neighbors? Compare key performance metrics like average monthly revenue, ADR, and occupancy rates in surrounding areas to understand the broader regional STR landscape.
| Market | Active Properties | Monthly Revenue | Daily Rate | Avg. Occupancy |
|---|---|---|---|---|
| Itoshima | 71 | $3,149 | $227.42 | 49% |
| Yufu | 125 | $3,017 | $251.22 | 45% |
| Minamioguni | 21 | $2,829 | $276.75 | 42% |
| Minamiaso | 29 | $2,758 | $179.23 | 56% |
| Aso | 37 | $2,432 | $191.56 | 47% |
| Dazaifu | 40 | $2,233 | $167.44 | 45% |
| Asakura | 12 | $2,232 | $172.43 | 45% |
| Fukuoka | 1,326 | $2,177 | $143.36 | 53% |
| Chuo Ward | 33 | $2,070 | $159.15 | 57% |
| Ukiha | 16 | $2,049 | $202.39 | 33% |