Aso Airbnb Market Analysis 2026: Short Term Rental Data & Vacation Rental Statistics in Kumamoto Prefecture, Japan
Is Airbnb profitable in Aso in 2026? Explore comprehensive Airbnb analytics for Aso, Kumamoto Prefecture, Japan to uncover income potential. This 2026 STR market report for Aso, based on AirROI data from February 2025 to January 2026, reveals key trends in the niche market of 37 active listings.
Whether you're considering an Airbnb investment in Aso, optimizing your existing vacation rental, or exploring rental arbitrage opportunities, understanding the Aso Airbnb data is crucial. Navigating the high regulation landscape is key to maximizing your short term rental income potential. Let's dive into the specifics.
Key Aso Airbnb Performance Metrics Overview
Monthly Airbnb Revenue Variations & Income Potential in Aso (2026)
Understanding the monthly revenue variations for Airbnb listings in Aso is key to maximizing your short term rental income potential. Seasonality significantly impacts earnings. Our analysis, based on data from the past 12 months, shows that the peak revenue month for STRs in Aso is typically November, while June often presents the lowest earnings, highlighting opportunities for strategic pricing adjustments during shoulder and low seasons. Explore the typical Airbnb income in Aso across different performance tiers:
- Best-in-class properties (Top 10%) achieve $5,653+ monthly, often utilizing dynamic pricing and superior guest experiences.
- Strong performing properties (Top 25%) earn $3,774 or more, indicating effective management and desirable locations/amenities.
- Typical properties (Median) generate around $2,308 per month, representing the average market performance.
- Entry-level properties (Bottom 25%) see earnings around $755, often with potential for optimization.
Average Monthly Airbnb Earnings Trend in Aso
Aso Airbnb Occupancy Rate Trends (2026)
Maximize your bookings by understanding the Aso STR occupancy trends. Seasonal demand shifts significantly influence how often properties are booked. Typically, Novembersees the highest demand (peak season occupancy), while July experiences the lowest (low season). Effective strategies, like adjusting minimum stays or offering promotions, can boost occupancy during slower periods. Here's how different property tiers perform in Aso:
- Best-in-class properties (Top 10%) achieve 84%+ occupancy, indicating high desirability and potentially optimized availability.
- Strong performing properties (Top 25%) maintain 67% or higher occupancy, suggesting good market fit and guest satisfaction.
- Typical properties (Median) have an occupancy rate around 48%.
- Entry-level properties (Bottom 25%) average 28% occupancy, potentially facing higher vacancy.
Average Monthly Occupancy Rate Trend in Aso
Average Daily Rate (ADR) Airbnb Trends in Aso (2026)
Effective short term rental pricing strategy in Aso involves understanding monthly ADR fluctuations. The Average Daily Rate (ADR) for Airbnb in Aso typically peaks in August and dips lowest during January. Leveraging Airbnb dynamic pricing tools or strategies based on this seasonality can significantly boost revenue. Here's a look at the typical nightly rates achieved:
- Best-in-class properties (Top 10%) command rates of $450+ per night, often due to premium features or locations.
- Strong performing properties (Top 25%) achieve nightly rates of $225 or more.
- Typical properties (Median) charge around $118 per night.
- Entry-level properties (Bottom 25%) earn around $56 per night.
Average Daily Rate (ADR) Trend by Month in Aso
Get Live Aso Market Intelligence 👇

Explore Real-time Analytics
Airbnb Seasonality Analysis & Trends in Aso (2026)
Peak Season (November, May, August)
- Revenue averages $3,148 per month
- Occupancy rates average 53.6%
- Daily rates average $180
Shoulder Season
- Revenue averages $2,657 per month
- Occupancy maintains around 49.9%
- Daily rates hold near $174
Low Season (January, June, July)
- Revenue drops to average $2,161 per month
- Occupancy decreases to average 38.8%
- Daily rates adjust to average $177
Seasonality Insights for Aso
- The Airbnb seasonality in Aso shows moderate seasonality with distinct peak and low periods. While the sections above show seasonal averages, it's also insightful to look at the extremes:
- During the high season, the absolute peak month showcases Aso's highest earning potential, with monthly revenues capable of climbing to $3,276, occupancy reaching a high of 57.3%, and ADRs peaking at $194.
- Conversely, the slowest single month of the year, typically falling within the low season, marks the market's lowest point. In this month, revenue might dip to $1,965, occupancy could drop to 37.3%, and ADRs may adjust down to $156.
- Understanding both the seasonal averages and these monthly peaks and troughs in revenue, occupancy, and ADR is crucial for maximizing your Airbnb profit potential in Aso.
Seasonal Strategies for Maximizing Profit
- Peak Season: Maximize revenue through premium pricing and potentially longer minimum stays. Ensure high availability.
- Low Season: Offer competitive pricing, special promotions (e.g., extended stay discounts), and flexible cancellation policies. Target off-season travelers like remote workers or budget-conscious guests.
- Shoulder Seasons: Implement dynamic pricing that balances peak and low rates. Target weekend travelers or specific events. Offer slightly more flexible terms than peak season.
- Regularly analyze your own performance against these Aso seasonality benchmarks and adjust your pricing and availability strategy accordingly.
Best Areas for Airbnb Investment in Aso (2026)
Exploring the top neighborhoods for short-term rentals in Aso? This section highlights key areas, outlining why they are attractive for hosts and guests, along with notable local attractions. Consider these locations based on your target guest profile and investment strategy.
| Neighborhood / Area | Why Host Here? (Target Guests & Appeal) | Key Attractions & Landmarks |
|---|---|---|
| Kusasenri | Beautiful scenic area known for its rolling grasslands and stunning views of Mount Aso. It's perfect for nature lovers and those looking to escape into rural Japan while still being close to town amenities. | Kusasenri grassland, Aso volcano museum, Kusasenri observatory, Mount Aso hiking trails |
| Aso Farm Land | An expansive theme park and resort featuring activities for families, children, and nature enthusiasts. The location is popular for both leisure and educational experiences about agriculture and traditional Japanese culture. | Aso Farm Land, Local wild animals, Farm experiences, Aso Nature School |
| Uchinomaki Onsen | A famous hot spring area known for its relaxing onsen experience. It attracts visitors looking for relaxation and wellness, with many ryokans and onsen facilities. | Uchinomaki Onsen hot springs, Onsen ryokan stays, Traditional Japanese gardens, Kumamoto Castle nearby |
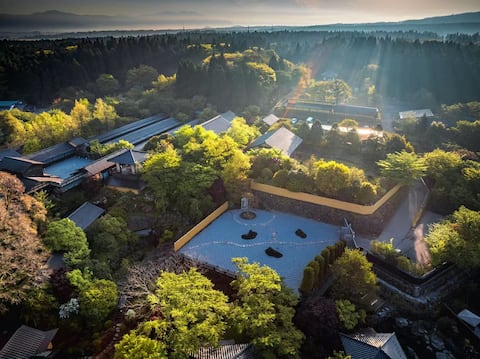
| Aso Shrine | One of the oldest and most important Shinto shrines in Japan, known for its beautiful architecture and historical significance. Visitors come for spiritual experiences and cultural exploration. | Aso Shrine, Historical artifacts, Nature walks nearby, Local festivals |
| Takamori | A quaint town that offers a traditional Japanese atmosphere with rich history, beautiful landscapes, and access to outdoor activities such as hiking and cycling. | Takamori Onsen, Historical streets, Hiking trails, Cultural showcases |
| Higotai | A scenic hilltop area providing breathtaking views and nature trails, ideal for outdoor enthusiasts, photographers, and those seeking tranquility. | Higotai Hill, Nature trails, Panoramic views of Mt Aso, Flower fields |
| Nishihara | A village known for its beautiful natural scenery and agricultural experiences, making it perfect for families looking for hands-on experiences in nature. | Local farms, Nature reserves, Cultural workshops, Scenic villages |
| Kurokawa Onsen | A famous onsen town renowned for its picturesque setting and traditional ryokan. It’s ideal for those seeking a luxurious onsen experience amidst nature. | Kurokawa Onsen ryokans, Stunning river views, Relaxation areas, Natural hot springs |
Understanding Airbnb License Requirements & STR Laws in Aso (2026)
Yes, Aso, Kumamoto Prefecture, Japan enforces high STR regulations. Obtaining a license and ensuring compliance is almost certainly required according to current 2026 STR laws. Always verify the latest short term rental regulations and Airbnb license requirements directly with local government authorities for Aso to ensure full compliance before hosting.
(Source: AirROI data, 2026, based on 100% licensed listings)
Top Performing Airbnb Properties in Aso (2026)
Benchmark your potential! Explore examples of top-performing Airbnb properties in Asobased on Trailing Twelve Month (TTM) revenue. Analyze their characteristics, revenue, occupancy rate, and ADR to understand what drives success in this market.
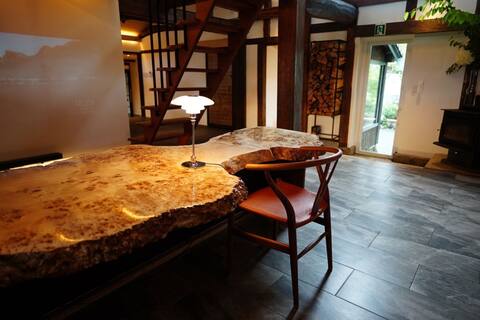
"Meihodo Geihinkan/Meihodo Guest House" - Immerse yourself in Japanese culture and nature -
Entire Place • 2 bedrooms
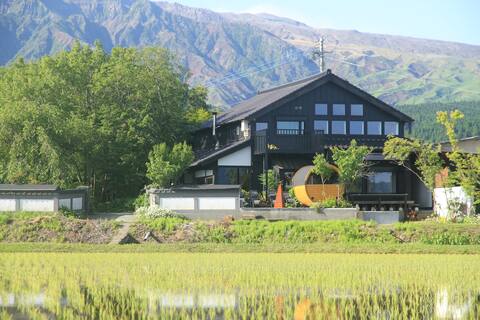
Overlooking the outer rim of Mt. Aso. A 150-year-old barn with a private sauna and Aso spring water
Entire Place • 2 bedrooms
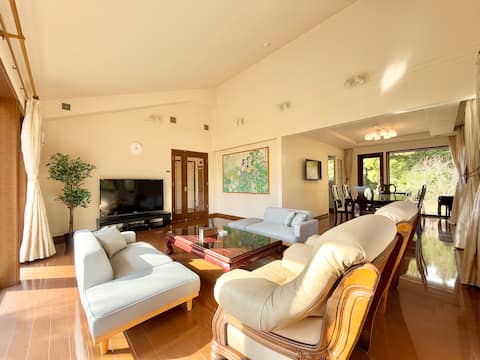
Relax within Aso’s Nature, 12 PM Checkout!
Entire Place • 3 bedrooms
A panoramic view of Mt. Aso from the bedroom. Stay in a 200-year-old rice warehouse that weaves time
Entire Place • 3 bedrooms
『Meihodo Seiseisha/Meihodo Seiseisha』- Japanese culture and quiet accommodation experience -
Entire Place • 1 bedroom

"Meihodo Kourokan/Meihodo Kourokan" - Immerse yourself in Japanese culture and nature -
Entire Place • 3 bedrooms
Note: Performance varies based on location, size, amenities, seasonality, and management quality. Data reflects the past 12 months.
Top Performing Airbnb Hosts in Aso (2026)
Learn from the best! This table showcases top-performing Airbnb hosts in Aso based on the number of properties managed and estimated total revenue over the past year. Analyze their scale and performance metrics.
| Host Name | Properties | Grossing Revenue | Stay Reviews | Avg Rating |
|---|---|---|---|---|
| 鳴鳳堂 | 6 | $316,544 | 63 | 4.97/5.0 |
| 笹木貴史 | 2 | $157,314 | 64 | 4.94/5.0 |
| Owners.Inn | 4 | $154,381 | 784 | 4.80/5.0 |
| Keisuke | 3 | $111,845 | 317 | 4.93/5.0 |
| 勇斗 | 3 | $83,604 | 49 | 4.98/5.0 |
| Kotomi Fuwari | 1 | $76,049 | 13 | 5.00/5.0 |
| Hideaki | 1 | $40,791 | 184 | 4.53/5.0 |
| Yuuka | 3 | $29,335 | 341 | 4.93/5.0 |
| Asoya | 1 | $23,691 | 175 | 4.91/5.0 |
| 阿蘇び心 | 3 | $23,224 | 25 | 4.70/5.0 |
Analyzing the strategies of top hosts, such as their property selection, pricing, and guest communication, can offer valuable lessons for optimizing your own Airbnb operations in Aso.
Dive Deeper: Advanced Aso STR Market Data (2026)
Ready to unlock more insights? AirROI provides access to advanced metrics and comprehensive Airbnb data for Aso. Explore detailed analytics beyond this report to refine your investment strategy, optimize pricing, and maximize your vacation rental profits.
Explore Advanced MetricsAso Short-Term Rental Market Composition (2026): Property & Room Types
Room Type Distribution
Property Type Distribution
Market Composition Insights for Aso
- The Aso Airbnb market composition is heavily skewed towards Entire Home/Apt listings, which make up 62.2% of the 37 active rentals. This indicates strong guest preference for privacy and space.
- However, a notable 32.4% share for Private Rooms suggests opportunities for budget-conscious travelers or hosts renting out spare rooms.
- Looking at the property type distribution in Aso, House properties are the most common (67.6%), reflecting the local real estate landscape.
- Houses represent a significant 67.6% portion, catering likely to families or larger groups.
- The presence of 8.1% Hotel/Boutique listings indicates integration with traditional hospitality.
- Smaller segments like others (combined 2.7%) offer potential for unique stay experiences.
Aso Airbnb Room Capacity Analysis (2026): Bedroom Distribution
Distribution of Listings by Number of Bedrooms
Room Capacity Insights for Aso
- The dominant room capacity in Aso is 3 bedrooms listings, making up 29.7% of the market. This suggests a strong demand for properties suitable for families or small groups.
- Together, 3 bedrooms and 1 bedroom properties represent 51.3% of the active Airbnb listings in Aso, indicating a high concentration in these sizes.
- A significant 35.1% of listings offer 3+ bedrooms, catering to larger groups and families seeking more space in Aso.
Aso Vacation Rental Guest Capacity Trends (2026)
Distribution of Listings by Guest Capacity
Guest Capacity Insights for Aso
- The most common guest capacity trend in Aso vacation rentals is listings accommodating 8+ guests (27%). This suggests the primary traveler segment is likely larger groups.
- Properties designed for 8+ guests and 5 guests dominate the Aso STR market, accounting for 37.8% of listings.
- 37.8% of properties accommodate 6+ guests, serving the market segment for larger families or group travel in Aso.
- On average, properties in Aso are equipped to host 3.9 guests.
Aso Airbnb Booking Patterns (2026): Available vs. Booked Days
Available Days Distribution
Booked Days Distribution
Booking Pattern Insights for Aso
- The most common availability pattern in Aso falls within the 181-270 days range, representing 35.1% of listings. This suggests many properties have significant open periods on their calendars.
- Approximately 59.4% of listings show high availability (181+ days open annually), indicating potential for increased bookings or specific owner usage patterns.
- For booked days, the 91-180 days range is most frequent in Aso (37.8%), reflecting common guest stay durations or potential owner blocking patterns.
- A notable 40.5% of properties secure long booking periods (181+ days booked per year), highlighting successful long-term rental strategies or significant owner usage.
Aso Airbnb Minimum Stay Requirements Analysis
Distribution of Listings by Minimum Night Requirement
1 Night
34 listings
91.9% of total
2 Nights
1 listings
2.7% of total
30+ Nights
2 listings
5.4% of total
Key Insights
- The most prevalent minimum stay requirement in Aso is 1 Night, adopted by 91.9% of listings. This highlights the market's preference for shorter, flexible bookings.
- A strong majority (94.6%) of the Aso Airbnb data shows acceptance of very short stays (1-2 nights), indicating a dynamic, high-turnover market.
Recommendations
- Align with the market by considering a 1 Night minimum stay, as 91.9% of Aso hosts use this setting.
- Explore offering discounts for stays of 30+ nights to attract the 5.4% of the market seeking extended stays.
- Adjust minimum nights based on seasonality – potentially shorter during low season and longer during peak demand periods in Aso.
Aso Airbnb Cancellation Policy Trends Analysis (2026)
Flexible
4 listings
10.8% of total
Moderate
22 listings
59.5% of total
Firm
11 listings
29.7% of total
Cancellation Policy Insights for Aso
- The prevailing Airbnb cancellation policy trend in Aso is Moderate, used by 59.5% of listings.
- The market strongly favors guest-friendly terms, with 70.3% of listings offering Flexible or Moderate policies. This suggests guests in Aso may expect booking flexibility.
Recommendations for Hosts
- Consider adopting a Moderate policy to align with the 59.5% market standard in Aso.
- Regularly review your cancellation policy against competitors and market demand shifts in Aso.
Aso STR Booking Lead Time Analysis (2026)
Average Booking Lead Time by Month
Booking Lead Time Insights for Aso
- The overall average booking lead time for vacation rentals in Aso is 48 days.
- Guests book furthest in advance for stays during November (average 67 days), likely coinciding with peak travel demand or local events.
- The shortest booking windows occur for stays in June (average 33 days), indicating more last-minute travel plans during this time.
- Seasonally, Fall (57 days avg.) sees the longest lead times, while Summer (42 days avg.) has the shortest, reflecting typical travel planning cycles.
Recommendations for Hosts
- Use the overall average lead time (48 days) as a baseline for your pricing and availability strategy in Aso.
- For November stays, consider implementing length-of-stay discounts or slightly higher rates for bookings made less than 67 days out to capitalize on advance planning.
- Target marketing efforts for the Fall season well in advance (at least 57 days) to capture early planners.
- Monitor your own booking lead times against these Aso averages to identify opportunities for dynamic pricing adjustments.
Popular & Essential Airbnb Amenities in Aso (2026)
Amenity Prevalence
Amenity Insights for Aso
- Essential amenities in Aso that guests expect include: Free parking on premises, Wifi, Air conditioning. Lacking these (any) could significantly impact bookings.
- Popular amenities like Shampoo, Hair dryer, Smoke alarm are common but not universal. Offering these can provide a competitive edge.
Recommendations for Hosts
- Ensure your listing includes all essential amenities for Aso: Free parking on premises, Wifi, Air conditioning.
- Prioritize adding missing essentials: Wifi, Air conditioning.
- Consider adding popular differentiators like Shampoo or Hair dryer to increase appeal.
- Highlight unique or less common amenities you offer (e.g., hot tub, dedicated workspace, EV charger) in your listing description and photos.
- Regularly check competitor amenities in Aso to stay competitive.
Aso Airbnb Guest Demographics & Profile Analysis (2026)
Guest Profile Summary for Aso
- The typical guest profile for Airbnb in Aso consists of predominantly international visitors (92%), with top international origins including United States, typically belonging to the Post-2000s (Gen Z/Alpha) group (50%), primarily speaking English or Chinese.
- Domestic travelers account for 8.4% of guests.
- Key international markets include Singapore (11.3%) and United States (10.6%).
- Top languages spoken are English (43.2%) followed by Chinese (19.8%).
- A significant demographic segment is the Post-2000s (Gen Z/Alpha) group, representing 50% of guests.
Recommendations for Hosts
- Focus marketing internationally, particularly towards travelers from United States.
- Tailor amenities and listing descriptions to appeal to the dominant Post-2000s (Gen Z/Alpha) demographic (e.g., highlight fast WiFi, smart home features, local guides).
- Highlight unique local experiences or amenities relevant to the primary guest profile.
- Consider seasonal promotions aligned with peak travel times for key origin markets.
Nearby Short-Term Rental Market Comparison
How does the Aso Airbnb market stack up against its neighbors? Compare key performance metrics like average monthly revenue, ADR, and occupancy rates in surrounding areas to understand the broader regional STR landscape.
| Market | Active Properties | Monthly Revenue | Daily Rate | Avg. Occupancy |
|---|---|---|---|---|
| Itoshima | 71 | $3,149 | $227.42 | 49% |
| Yufu | 125 | $3,017 | $251.22 | 45% |
| Minamioguni | 21 | $2,829 | $276.75 | 42% |
| Minamiaso | 29 | $2,758 | $179.23 | 56% |
| Dazaifu | 40 | $2,233 | $167.44 | 45% |
| Asakura | 12 | $2,232 | $172.43 | 45% |
| Fukuoka | 1,326 | $2,177 | $143.36 | 53% |
| Chuo Ward | 33 | $2,070 | $159.15 | 57% |
| Ukiha | 16 | $2,049 | $202.39 | 33% |
| Kurume | 13 | $1,801 | $129.49 | 52% |