Takasaki Airbnb Market Analysis 2026: Short Term Rental Data & Vacation Rental Statistics in Gunma Prefecture, Japan
Is Airbnb profitable in Takasaki in 2026? Explore comprehensive Airbnb analytics for Takasaki, Gunma Prefecture, Japan to uncover income potential. This 2026 STR market report for Takasaki, based on AirROI data from February 2025 to January 2026, reveals key trends in the niche market of 43 active listings.
Whether you're considering an Airbnb investment in Takasaki, optimizing your existing vacation rental, or exploring rental arbitrage opportunities, understanding the Takasaki Airbnb data is crucial. Navigating the high regulation landscape is key to maximizing your short term rental income potential. Let's dive into the specifics.
Key Takasaki Airbnb Performance Metrics Overview
Monthly Airbnb Revenue Variations & Income Potential in Takasaki (2026)
Understanding the monthly revenue variations for Airbnb listings in Takasaki is key to maximizing your short term rental income potential. Seasonality significantly impacts earnings. Our analysis, based on data from the past 12 months, shows that the peak revenue month for STRs in Takasaki is typically March, while September often presents the lowest earnings, highlighting opportunities for strategic pricing adjustments during shoulder and low seasons. Explore the typical Airbnb income in Takasaki across different performance tiers:
- Best-in-class properties (Top 10%) achieve $3,275+ monthly, often utilizing dynamic pricing and superior guest experiences.
- Strong performing properties (Top 25%) earn $1,695 or more, indicating effective management and desirable locations/amenities.
- Typical properties (Median) generate around $855 per month, representing the average market performance.
- Entry-level properties (Bottom 25%) see earnings around $362, often with potential for optimization.
Average Monthly Airbnb Earnings Trend in Takasaki
Takasaki Airbnb Occupancy Rate Trends (2026)
Maximize your bookings by understanding the Takasaki STR occupancy trends. Seasonal demand shifts significantly influence how often properties are booked. Typically, Novembersees the highest demand (peak season occupancy), while October experiences the lowest (low season). Effective strategies, like adjusting minimum stays or offering promotions, can boost occupancy during slower periods. Here's how different property tiers perform in Takasaki:
- Best-in-class properties (Top 10%) achieve 61%+ occupancy, indicating high desirability and potentially optimized availability.
- Strong performing properties (Top 25%) maintain 46% or higher occupancy, suggesting good market fit and guest satisfaction.
- Typical properties (Median) have an occupancy rate around 27%.
- Entry-level properties (Bottom 25%) average 14% occupancy, potentially facing higher vacancy.
Average Monthly Occupancy Rate Trend in Takasaki
Average Daily Rate (ADR) Airbnb Trends in Takasaki (2026)
Effective short term rental pricing strategy in Takasaki involves understanding monthly ADR fluctuations. The Average Daily Rate (ADR) for Airbnb in Takasaki typically peaks in August and dips lowest during September. Leveraging Airbnb dynamic pricing tools or strategies based on this seasonality can significantly boost revenue. Here's a look at the typical nightly rates achieved:
- Best-in-class properties (Top 10%) command rates of $241+ per night, often due to premium features or locations.
- Strong performing properties (Top 25%) achieve nightly rates of $177 or more.
- Typical properties (Median) charge around $111 per night.
- Entry-level properties (Bottom 25%) earn around $52 per night.
Average Daily Rate (ADR) Trend by Month in Takasaki
Get Live Takasaki Market Intelligence 👇

Explore Real-time Analytics
Airbnb Seasonality Analysis & Trends in Takasaki (2026)
Peak Season (March, August, May)
- Revenue averages $1,495 per month
- Occupancy rates average 34.8%
- Daily rates average $130
Shoulder Season
- Revenue averages $1,318 per month
- Occupancy maintains around 32.1%
- Daily rates hold near $125
Low Season (June, September, October)
- Revenue drops to average $907 per month
- Occupancy decreases to average 26.0%
- Daily rates adjust to average $121
Seasonality Insights for Takasaki
- The Airbnb seasonality in Takasaki shows moderate seasonality with distinct peak and low periods. While the sections above show seasonal averages, it's also insightful to look at the extremes:
- During the high season, the absolute peak month showcases Takasaki's highest earning potential, with monthly revenues capable of climbing to $1,589, occupancy reaching a high of 39.1%, and ADRs peaking at $137.
- Conversely, the slowest single month of the year, typically falling within the low season, marks the market's lowest point. In this month, revenue might dip to $778, occupancy could drop to 25.7%, and ADRs may adjust down to $113.
- Understanding both the seasonal averages and these monthly peaks and troughs in revenue, occupancy, and ADR is crucial for maximizing your Airbnb profit potential in Takasaki.
Seasonal Strategies for Maximizing Profit
- Peak Season: Maximize revenue through premium pricing and potentially longer minimum stays. Ensure high availability.
- Low Season: Offer competitive pricing, special promotions (e.g., extended stay discounts), and flexible cancellation policies. Target off-season travelers like remote workers or budget-conscious guests.
- Shoulder Seasons: Implement dynamic pricing that balances peak and low rates. Target weekend travelers or specific events. Offer slightly more flexible terms than peak season.
- Regularly analyze your own performance against these Takasaki seasonality benchmarks and adjust your pricing and availability strategy accordingly.
Best Areas for Airbnb Investment in Takasaki (2026)
Exploring the top neighborhoods for short-term rentals in Takasaki? This section highlights key areas, outlining why they are attractive for hosts and guests, along with notable local attractions. Consider these locations based on your target guest profile and investment strategy.
| Neighborhood / Area | Why Host Here? (Target Guests & Appeal) | Key Attractions & Landmarks |
|---|---|---|
| Takasaki Station District | The central hub of Takasaki with easy train access to major cities like Tokyo and Nagoya. It's a popular area for business travelers and tourists, making it prime for Airbnb hosts. | Takasaki Station, Takasaki Warehouses, Takasaki City Museum of Art, Gunma Music Center, Civic Art Gallery |
| Mount Haruna | A scenic area known for its natural beauty, hiking trails, and hot springs. It attracts tourists looking for outdoor experiences and relaxation, making it ideal for Airbnb hosting. | Mount Haruna, Lake Haruna, Haruna Shrine, Hot Springs resort, Cultural centers |
| Shorinzan Daruma Temple | A famous temple that attracts visitors for its cultural significance and beautiful architecture. This area combines spirituality with tourism, appealing to travelers interested in Japanese culture. | Shorinzan Daruma Temple, Daruma Museum, Temizuya, Cultural festivals, Walking trails |
| Takasaki City Historical Museum | Centrally located near historical sites, this area appeals to history buffs and cultural tourists. Its proximity to museums and historical sites is perfect for attracting visitors. | Takasaki City Historical Museum, Gunnma Museum of Natural History, Historical walking paths, Local shops, Cafés |
| Takasaki Owl Park | Unique to the area, this park attracts families and animal lovers. Hosting in this area provides a niche opportunity for attracting visitors interested in wildlife and family activities. | Takasaki Owl Park, Wildlife experiences, Picnic areas, Workshops, Family-friendly activities |
| Yamabukidai | Residential area with access to nature and tranquility. Ideal for those seeking a peaceful retreat while being close to urban amenities. | Hiking trails, Nature parks, Local dining options, Quiet surroundings, Scenic views |
| Takasaki Baird Beer | A local brewery that attracts craft beer enthusiasts. It provides a unique selling point for Airbnb hosts, catering to visitors who enjoy culinary experiences. | Baird Beer Taproom, Brewery tours, Craft beer tastings, Food pairings, Local events |
| Cultural Centers and Arts Districts | As the cultural heart of Takasaki, this area exhibits local art and performance, appealing to cultural tourists and art lovers. Hosting here can attract niche audiences who appreciate the arts. | Local art galleries, Theaters, Live performance venues, Cultural festivals, Art workshops |
Understanding Airbnb License Requirements & STR Laws in Takasaki (2026)
Yes, Takasaki, Gunma Prefecture, Japan enforces high STR regulations. Obtaining a license and ensuring compliance is almost certainly required according to current 2026 STR laws. Always verify the latest short term rental regulations and Airbnb license requirements directly with local government authorities for Takasaki to ensure full compliance before hosting.
(Source: AirROI data, 2026, based on 95% licensed listings)
Top Performing Airbnb Properties in Takasaki (2026)
Benchmark your potential! Explore examples of top-performing Airbnb properties in Takasakibased on Trailing Twelve Month (TTM) revenue. Analyze their characteristics, revenue, occupancy rate, and ADR to understand what drives success in this market.
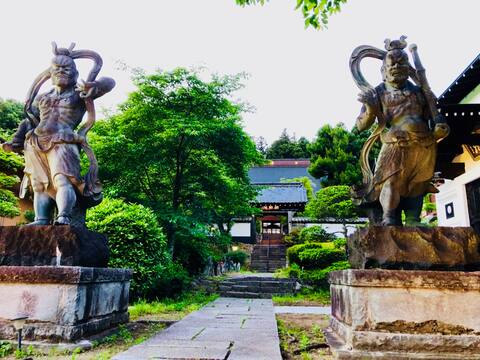
Historic Dragon temple hotel. Enjoy ZEN meditation
Private Room • 1 bedroom
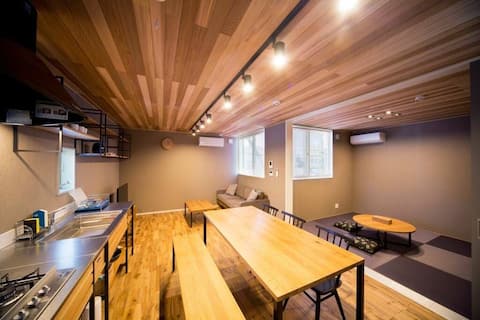
Room:104/Rakuten STAY HOUSE x WILL STYLE Takasaki
Entire Place • 2 bedrooms
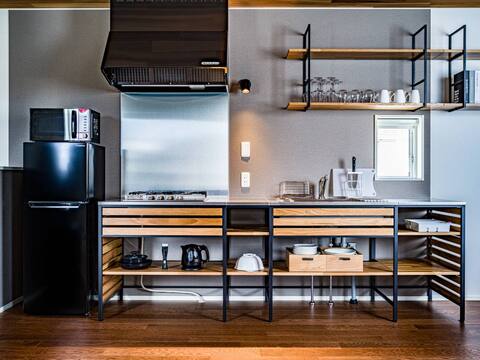
Room:103/Rakuten STAY HOUSE x WILL STYLE Takasaki
Entire Place • 2 bedrooms
![[Newly built house I] Very popular and great value for 3 or more people! 4-minute walk from Takasaki](https://a0.muscache.com/im/pictures/miso/Hosting-47929153/original/21b58470-e630-4e42-b7fd-6cbe1eb2a74e.jpeg?im_w=480&im_format=avif)
[Newly built house I] Very popular and great value for 3 or more people! 4-minute walk from Takasaki
Entire Place • 4 bedrooms
![[Newly built house II] Very popular and great value for 3 or more people! 4-minute walk from Takasak](https://a0.muscache.com/im/pictures/miso/Hosting-47929959/original/17996a7f-d18c-40bf-aabe-4ec505f0b3ce.jpeg?im_w=480&im_format=avif)
[Newly built house II] Very popular and great value for 3 or more people! 4-minute walk from Takasak
Entire Place • 4 bedrooms

Historic Kiyomizu House by onsen & mts., 1F Max 20
Entire Place • 2 bedrooms
Note: Performance varies based on location, size, amenities, seasonality, and management quality. Data reflects the past 12 months.
Top Performing Airbnb Hosts in Takasaki (2026)
Learn from the best! This table showcases top-performing Airbnb hosts in Takasaki based on the number of properties managed and estimated total revenue over the past year. Analyze their scale and performance metrics.
| Host Name | Properties | Grossing Revenue | Stay Reviews | Avg Rating |
|---|---|---|---|---|
| Kenji | 13 | $195,465 | 1215 | 4.90/5.0 |
| 良夫 | 5 | $129,930 | 105 | 4.83/5.0 |
| Tendou | 3 | $80,456 | 94 | 5.00/5.0 |
| Renée | 1 | $21,327 | 54 | 4.72/5.0 |
| Keisuke Nomura | 3 | $20,168 | 28 | 4.80/5.0 |
| Jhunn | 1 | $16,216 | 619 | 4.94/5.0 |
| Kanna | 1 | $10,820 | 4 | 5.00/5.0 |
| 五月の薔薇の家 | 3 | $10,260 | 51 | 4.86/5.0 |
| MatoiHostel | 4 | $9,168 | 88 | 4.83/5.0 |
| Yoshimichi | 1 | $8,342 | 191 | 4.87/5.0 |
Analyzing the strategies of top hosts, such as their property selection, pricing, and guest communication, can offer valuable lessons for optimizing your own Airbnb operations in Takasaki.
Dive Deeper: Advanced Takasaki STR Market Data (2026)
Ready to unlock more insights? AirROI provides access to advanced metrics and comprehensive Airbnb data for Takasaki. Explore detailed analytics beyond this report to refine your investment strategy, optimize pricing, and maximize your vacation rental profits.
Explore Advanced MetricsTakasaki Short-Term Rental Market Composition (2026): Property & Room Types
Room Type Distribution
Property Type Distribution
Market Composition Insights for Takasaki
- The Takasaki Airbnb market composition is heavily skewed towards Entire Home/Apt listings, which make up 51.2% of the 43 active rentals. This indicates strong guest preference for privacy and space.
- However, a notable 41.9% share for Private Rooms suggests opportunities for budget-conscious travelers or hosts renting out spare rooms.
- Looking at the property type distribution in Takasaki, House properties are the most common (51.2%), reflecting the local real estate landscape.
- Houses represent a significant 51.2% portion, catering likely to families or larger groups.
- The presence of 25.6% Hotel/Boutique listings indicates integration with traditional hospitality.
- Smaller segments like outdoor/unique (combined 2.3%) offer potential for unique stay experiences.
Takasaki Airbnb Room Capacity Analysis (2026): Bedroom Distribution
Distribution of Listings by Number of Bedrooms
Room Capacity Insights for Takasaki
- The dominant room capacity in Takasaki is 1 bedroom listings, making up 41.9% of the market. This suggests a strong demand for properties suitable for couples or solo travelers.
- Together, 1 bedroom and 2 bedrooms properties represent 65.2% of the active Airbnb listings in Takasaki, indicating a high concentration in these sizes.
Takasaki Vacation Rental Guest Capacity Trends (2026)
Distribution of Listings by Guest Capacity
Guest Capacity Insights for Takasaki
- The most common guest capacity trend in Takasaki vacation rentals is listings accommodating 6 guests (30.2%). This suggests the primary traveler segment is likely larger groups.
- Properties designed for 6 guests and 8+ guests dominate the Takasaki STR market, accounting for 41.8% of listings.
- 41.8% of properties accommodate 6+ guests, serving the market segment for larger families or group travel in Takasaki.
- On average, properties in Takasaki are equipped to host 3.7 guests.
Takasaki Airbnb Booking Patterns (2026): Available vs. Booked Days
Available Days Distribution
Booked Days Distribution
Booking Pattern Insights for Takasaki
- The most common availability pattern in Takasaki falls within the 271-366 days range, representing 51.2% of listings. This suggests many properties have significant open periods on their calendars.
- Approximately 95.4% of listings show high availability (181+ days open annually), indicating potential for increased bookings or specific owner usage patterns.
- For booked days, the 91-180 days range is most frequent in Takasaki (44.2%), reflecting common guest stay durations or potential owner blocking patterns.
- A notable 4.7% of properties secure long booking periods (181+ days booked per year), highlighting successful long-term rental strategies or significant owner usage.
Takasaki Airbnb Minimum Stay Requirements Analysis
Distribution of Listings by Minimum Night Requirement
1 Night
42 listings
97.7% of total
30+ Nights
1 listings
2.3% of total
Key Insights
- The most prevalent minimum stay requirement in Takasaki is 1 Night, adopted by 97.7% of listings. This highlights the market's preference for shorter, flexible bookings.
- A strong majority (97.7%) of the Takasaki Airbnb data shows acceptance of very short stays (1-2 nights), indicating a dynamic, high-turnover market.
- Dedicated monthly rentals (30+ nights) represent a small niche (2.3%), possibly an untapped area for hosts.
Recommendations
- Align with the market by considering a 1 Night minimum stay, as 97.7% of Takasaki hosts use this setting.
- Adjust minimum nights based on seasonality – potentially shorter during low season and longer during peak demand periods in Takasaki.
Takasaki Airbnb Cancellation Policy Trends Analysis (2026)
Limited
1 listings
2.3% of total
Flexible
7 listings
16.3% of total
Moderate
18 listings
41.9% of total
Firm
15 listings
34.9% of total
Strict
2 listings
4.7% of total
Cancellation Policy Insights for Takasaki
- The prevailing Airbnb cancellation policy trend in Takasaki is Moderate, used by 41.9% of listings.
- There's a relatively balanced mix between guest-friendly (58.2%) and stricter (39.6%) policies, offering choices for different guest needs.
- Strict cancellation policies are quite rare (4.7%), potentially making listings with this policy less competitive unless justified by high demand or property type.
Recommendations for Hosts
- Consider adopting a Moderate policy to align with the 41.9% market standard in Takasaki.
- Using a Strict policy might deter some guests, as only 4.7% of listings use it. Evaluate if potential revenue protection outweighs possible lower booking rates.
- Regularly review your cancellation policy against competitors and market demand shifts in Takasaki.
Takasaki STR Booking Lead Time Analysis (2026)
Average Booking Lead Time by Month
Booking Lead Time Insights for Takasaki
- The overall average booking lead time for vacation rentals in Takasaki is 38 days.
- Guests book furthest in advance for stays during September (average 57 days), likely coinciding with peak travel demand or local events.
- The shortest booking windows occur for stays in June (average 25 days), indicating more last-minute travel plans during this time.
- Seasonally, Fall (51 days avg.) sees the longest lead times, while Winter (33 days avg.) has the shortest, reflecting typical travel planning cycles.
Recommendations for Hosts
- Use the overall average lead time (38 days) as a baseline for your pricing and availability strategy in Takasaki.
- For September stays, consider implementing length-of-stay discounts or slightly higher rates for bookings made less than 57 days out to capitalize on advance planning.
- Target marketing efforts for the Fall season well in advance (at least 51 days) to capture early planners.
- Monitor your own booking lead times against these Takasaki averages to identify opportunities for dynamic pricing adjustments.
Popular & Essential Airbnb Amenities in Takasaki (2026)
Amenity Prevalence
Amenity Insights for Takasaki
- Essential amenities in Takasaki that guests expect include: Air conditioning, Smoke alarm, Shampoo, Hair dryer, Wifi, Microwave, Hangers. Lacking these (any) could significantly impact bookings.
- Popular amenities like Washer, Refrigerator, Dishes and silverware are common but not universal. Offering these can provide a competitive edge.
Recommendations for Hosts
- Ensure your listing includes all essential amenities for Takasaki: Air conditioning, Smoke alarm, Shampoo, Hair dryer, Wifi, Microwave, Hangers.
- Prioritize adding missing essentials: Shampoo, Hair dryer, Wifi, Microwave, Hangers.
- Consider adding popular differentiators like Washer or Refrigerator to increase appeal.
- Highlight unique or less common amenities you offer (e.g., hot tub, dedicated workspace, EV charger) in your listing description and photos.
- Regularly check competitor amenities in Takasaki to stay competitive.
Takasaki Airbnb Guest Demographics & Profile Analysis (2026)
Guest Profile Summary for Takasaki
- The typical guest profile for Airbnb in Takasaki consists of predominantly international visitors (78%), with top international origins including United States, typically belonging to the Post-2000s (Gen Z/Alpha) group (50%), primarily speaking English or Japanese.
- Domestic travelers account for 21.9% of guests.
- Key international markets include Japan (21.9%) and United States (16.2%).
- Top languages spoken are English (40%) followed by Japanese (19.1%).
- A significant demographic segment is the Post-2000s (Gen Z/Alpha) group, representing 50% of guests.
Recommendations for Hosts
- Focus marketing internationally, particularly towards travelers from United States.
- Tailor amenities and listing descriptions to appeal to the dominant Post-2000s (Gen Z/Alpha) demographic (e.g., highlight fast WiFi, smart home features, local guides).
- Highlight unique local experiences or amenities relevant to the primary guest profile.
- Consider seasonal promotions aligned with peak travel times for key origin markets.
Nearby Short-Term Rental Market Comparison
How does the Takasaki Airbnb market stack up against its neighbors? Compare key performance metrics like average monthly revenue, ADR, and occupancy rates in surrounding areas to understand the broader regional STR landscape.
| Market | Active Properties | Monthly Revenue | Daily Rate | Avg. Occupancy |
|---|---|---|---|---|
| Shinagawa City | 50 | $7,769 | $428.93 | 62% |
| Futtsu | 31 | $5,187 | $369.80 | 44% |
| Kyonan | 15 | $5,099 | $419.89 | 42% |
| Adachi City | 47 | $4,752 | $301.69 | 50% |
| Kita | 15 | $4,563 | $305.24 | 57% |
| Shirako | 22 | $4,439 | $359.94 | 34% |
| Nagatoro | 10 | $4,035 | $249.70 | 52% |
| Kamogawa | 36 | $4,007 | $296.27 | 37% |
| Hakone | 335 | $3,905 | $289.84 | 48% |
| Karuizawa | 121 | $3,852 | $396.31 | 39% |