Sammu Airbnb Market Analysis 2026: Short Term Rental Data & Vacation Rental Statistics in Chiba Prefecture, Japan
Is Airbnb profitable in Sammu in 2026? Explore comprehensive Airbnb analytics for Sammu, Chiba Prefecture, Japan to uncover income potential. This 2026 STR market report for Sammu, based on AirROI data from February 2025 to January 2026, reveals key trends in the niche market of 26 active listings.
Whether you're considering an Airbnb investment in Sammu, optimizing your existing vacation rental, or exploring rental arbitrage opportunities, understanding the Sammu Airbnb data is crucial. Navigating the high regulation landscape is key to maximizing your short term rental income potential. Let's dive into the specifics.
Key Sammu Airbnb Performance Metrics Overview
Monthly Airbnb Revenue Variations & Income Potential in Sammu (2026)
Understanding the monthly revenue variations for Airbnb listings in Sammu is key to maximizing your short term rental income potential. Seasonality significantly impacts earnings. Our analysis, based on data from the past 12 months, shows that the peak revenue month for STRs in Sammu is typically August, while January often presents the lowest earnings, highlighting opportunities for strategic pricing adjustments during shoulder and low seasons. Explore the typical Airbnb income in Sammu across different performance tiers:
- Best-in-class properties (Top 10%) achieve $5,497+ monthly, often utilizing dynamic pricing and superior guest experiences.
- Strong performing properties (Top 25%) earn $2,157 or more, indicating effective management and desirable locations/amenities.
- Typical properties (Median) generate around $1,306 per month, representing the average market performance.
- Entry-level properties (Bottom 25%) see earnings around $732, often with potential for optimization.
Average Monthly Airbnb Earnings Trend in Sammu
Sammu Airbnb Occupancy Rate Trends (2026)
Maximize your bookings by understanding the Sammu STR occupancy trends. Seasonal demand shifts significantly influence how often properties are booked. Typically, Augustsees the highest demand (peak season occupancy), while January experiences the lowest (low season). Effective strategies, like adjusting minimum stays or offering promotions, can boost occupancy during slower periods. Here's how different property tiers perform in Sammu:
- Best-in-class properties (Top 10%) achieve 59%+ occupancy, indicating high desirability and potentially optimized availability.
- Strong performing properties (Top 25%) maintain 42% or higher occupancy, suggesting good market fit and guest satisfaction.
- Typical properties (Median) have an occupancy rate around 23%.
- Entry-level properties (Bottom 25%) average 10% occupancy, potentially facing higher vacancy.
Average Monthly Occupancy Rate Trend in Sammu
Average Daily Rate (ADR) Airbnb Trends in Sammu (2026)
Effective short term rental pricing strategy in Sammu involves understanding monthly ADR fluctuations. The Average Daily Rate (ADR) for Airbnb in Sammu typically peaks in August and dips lowest during February. Leveraging Airbnb dynamic pricing tools or strategies based on this seasonality can significantly boost revenue. Here's a look at the typical nightly rates achieved:
- Best-in-class properties (Top 10%) command rates of $475+ per night, often due to premium features or locations.
- Strong performing properties (Top 25%) achieve nightly rates of $295 or more.
- Typical properties (Median) charge around $206 per night.
- Entry-level properties (Bottom 25%) earn around $145 per night.
Average Daily Rate (ADR) Trend by Month in Sammu
Get Live Sammu Market Intelligence 👇

Explore Real-time Analytics
Airbnb Seasonality Analysis & Trends in Sammu (2026)
Peak Season (August, September, June)
- Revenue averages $3,091 per month
- Occupancy rates average 34.2%
- Daily rates average $299
Shoulder Season
- Revenue averages $1,798 per month
- Occupancy maintains around 27.7%
- Daily rates hold near $254
Low Season (January, February, November)
- Revenue drops to average $1,284 per month
- Occupancy decreases to average 22.7%
- Daily rates adjust to average $234
Seasonality Insights for Sammu
- The Airbnb seasonality in Sammu shows highly seasonal trends requiring careful strategy. While the sections above show seasonal averages, it's also insightful to look at the extremes:
- During the high season, the absolute peak month showcases Sammu's highest earning potential, with monthly revenues capable of climbing to $4,711, occupancy reaching a high of 45.4%, and ADRs peaking at $353.
- Conversely, the slowest single month of the year, typically falling within the low season, marks the market's lowest point. In this month, revenue might dip to $1,054, occupancy could drop to 14.0%, and ADRs may adjust down to $225.
- Understanding both the seasonal averages and these monthly peaks and troughs in revenue, occupancy, and ADR is crucial for maximizing your Airbnb profit potential in Sammu.
Seasonal Strategies for Maximizing Profit
- Peak Season: Maximize revenue through premium pricing and potentially longer minimum stays. Ensure high availability.
- Low Season: Offer competitive pricing, special promotions (e.g., extended stay discounts), and flexible cancellation policies. Target off-season travelers like remote workers or budget-conscious guests.
- Shoulder Seasons: Implement dynamic pricing that balances peak and low rates. Target weekend travelers or specific events. Offer slightly more flexible terms than peak season.
- Regularly analyze your own performance against these Sammu seasonality benchmarks and adjust your pricing and availability strategy accordingly.
Best Areas for Airbnb Investment in Sammu (2026)
Exploring the top neighborhoods for short-term rentals in Sammu? This section highlights key areas, outlining why they are attractive for hosts and guests, along with notable local attractions. Consider these locations based on your target guest profile and investment strategy.
| Neighborhood / Area | Why Host Here? (Target Guests & Appeal) | Key Attractions & Landmarks |
|---|---|---|
| Tateyama | Popular seaside city known for its beautiful beaches and scenic views. Ideal for tourists seeking relaxation and outdoor activities, especially in summer. | Tateyama Beach, Nagai Beach, Tateyama Sea Park, Shiroyama Park, Tateyama Castle |
| Kisarazu | Gateway to the Boso Peninsula and known for its shopping and entertainment options. A good spot for travelers heading to nearby attractions and Tokyo. | Kisarazu Outlet, Umihotaru, Kisarazu Port, Mitsui Outlet Park, Tokyo Bay Area |
| Choshi | Famous for its fishing heritage and coastal scenery. Attracts tourists interested in local seafood and cultural experiences. | Choshi Fishing Port, Inubosaki Lighthouse, Choshi Electric Railway, Choshi City Museum, Kujukuri Beach |
| Narita | Home to Narita International Airport, making it convenient for travelers. Offers cultural experiences and temple visits near the airport. | Narita-san Shinsho-ji Temple, Narita Omotesando, Narita Airport Museum, Sakura-no-yama Park |
| Boso Peninsula | Famous for its natural beauty, beaches, and hiking trails. Great for nature lovers and those seeking a coastal getaway. | Kujukuri Beach, Cape Sada, Boso Flower Line, Sono Beach |
| Sakura | Town with beautiful cherry blossoms and historical sites. Draws visitors in spring and those interested in Japanese culture. | Sakura Castle Park, Yamato Lake, Historic Buildings of Sakura, Chiba Prefectural Sakura Nature Park |
| Funabashi | A major suburb with shopping and dining options. Attracts visitors looking for a blend of urban and residential experiences near Tokyo. | Funabashi Andersen Park, LaLaport Tokyo Bay, Funabashi Arena |
| Kamagaya | Quiet residential area with local charm and parks. Perfect for families and guests seeking a peaceful stay close to urban amenities. | Kamagaya History Museum, Yagiri-no-Watashi, Kamagaya Park |
Understanding Airbnb License Requirements & STR Laws in Sammu (2026)
Yes, Sammu, Chiba Prefecture, Japan enforces high STR regulations. Obtaining a license and ensuring compliance is almost certainly required according to current 2026 STR laws. Always verify the latest short term rental regulations and Airbnb license requirements directly with local government authorities for Sammu to ensure full compliance before hosting.
(Source: AirROI data, 2026, based on 100% licensed listings)
Top Performing Airbnb Properties in Sammu (2026)
Benchmark your potential! Explore examples of top-performing Airbnb properties in Sammubased on Trailing Twelve Month (TTM) revenue. Analyze their characteristics, revenue, occupancy rate, and ADR to understand what drives success in this market.

a spacious private house -Moritosora-
Entire Place • 3 bedrooms
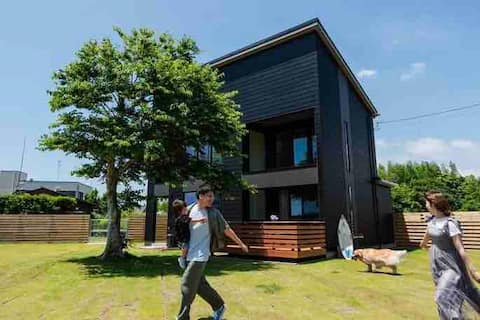
Montoutou - Montoutou - Chiba Prefecture / Kujukuri / Dog run / 5-minute drive to the coast
Entire Place • 2 bedrooms

Glamping/Unusual experience in the Airstream/4 ppl
Entire Place • 1 bedroom
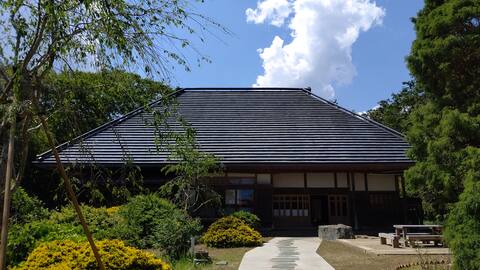
Traditional Japanese folk house
Entire Place • 3 bedrooms
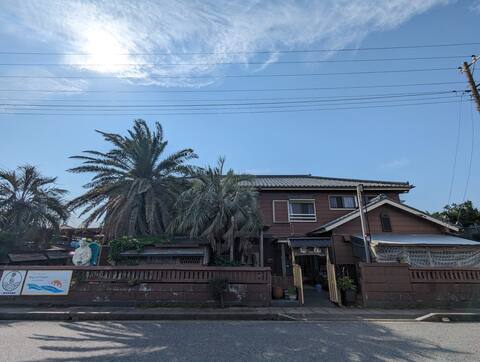
【Villa Near Ocean】Private BBQ/Capacity Over 40ppl
Entire Place • 5 bedrooms
![[Garage Shichirin] Rent an entire house with a garage for your bike! Fully automatic mahjong, billia](https://a0.muscache.com/im/pictures/airflow/Hosting-973519259607596840/original/80ebe9ef-621a-4a0d-958b-c852d7259570.jpg?im_w=480&im_format=avif)
[Garage Shichirin] Rent an entire house with a garage for your bike! Fully automatic mahjong, billia
Entire Place • 5 bedrooms
Note: Performance varies based on location, size, amenities, seasonality, and management quality. Data reflects the past 12 months.
Top Performing Airbnb Hosts in Sammu (2026)
Learn from the best! This table showcases top-performing Airbnb hosts in Sammu based on the number of properties managed and estimated total revenue over the past year. Analyze their scale and performance metrics.
| Host Name | Properties | Grossing Revenue | Stay Reviews | Avg Rating |
|---|---|---|---|---|
| Sunbright | 4 | $211,175 | 56 | 4.75/5.0 |
| 辰巳 | 6 | $48,588 | 30 | 3.90/5.0 |
| 真希 | 2 | $43,214 | 122 | 4.85/5.0 |
| 国雄 | 2 | $39,531 | 154 | 4.88/5.0 |
| Ankr Village Kujyukuri Private | 1 | $29,009 | 22 | 4.91/5.0 |
| Akie | 2 | $17,796 | 107 | 4.86/5.0 |
| Scott & Noriko | 1 | $16,773 | 646 | 4.95/5.0 |
| Argon House | 1 | $16,407 | 44 | 4.77/5.0 |
| 99rentalhome | 1 | $14,418 | 121 | 4.76/5.0 |
| 隼人 | 1 | $13,421 | 46 | 4.63/5.0 |
Analyzing the strategies of top hosts, such as their property selection, pricing, and guest communication, can offer valuable lessons for optimizing your own Airbnb operations in Sammu.
Dive Deeper: Advanced Sammu STR Market Data (2026)
Ready to unlock more insights? AirROI provides access to advanced metrics and comprehensive Airbnb data for Sammu. Explore detailed analytics beyond this report to refine your investment strategy, optimize pricing, and maximize your vacation rental profits.
Explore Advanced MetricsSammu Short-Term Rental Market Composition (2026): Property & Room Types
Room Type Distribution
Property Type Distribution
Market Composition Insights for Sammu
- The Sammu Airbnb market composition is heavily skewed towards Entire Home/Apt listings, which make up 100% of the 26 active rentals. This indicates strong guest preference for privacy and space.
- Looking at the property type distribution in Sammu, House properties are the most common (88.5%), reflecting the local real estate landscape.
- Houses represent a significant 88.5% portion, catering likely to families or larger groups.
Sammu Airbnb Room Capacity Analysis (2026): Bedroom Distribution
Distribution of Listings by Number of Bedrooms
Room Capacity Insights for Sammu
- The dominant room capacity in Sammu is 3 bedrooms listings, making up 26.9% of the market. This suggests a strong demand for properties suitable for families or small groups.
- Together, 3 bedrooms and 2 bedrooms properties represent 50.0% of the active Airbnb listings in Sammu, indicating a high concentration in these sizes.
- A significant 53.8% of listings offer 3+ bedrooms, catering to larger groups and families seeking more space in Sammu.
Sammu Vacation Rental Guest Capacity Trends (2026)
Distribution of Listings by Guest Capacity
Guest Capacity Insights for Sammu
- The most common guest capacity trend in Sammu vacation rentals is listings accommodating 8+ guests (73.1%). This suggests the primary traveler segment is likely larger groups.
- Properties designed for 8+ guests and 4 guests dominate the Sammu STR market, accounting for 92.3% of listings.
- 73.1% of properties accommodate 6+ guests, serving the market segment for larger families or group travel in Sammu.
- On average, properties in Sammu are equipped to host 7.0 guests.
Sammu Airbnb Booking Patterns (2026): Available vs. Booked Days
Available Days Distribution
Booked Days Distribution
Booking Pattern Insights for Sammu
- The most common availability pattern in Sammu falls within the 271-366 days range, representing 65.4% of listings. This suggests many properties have significant open periods on their calendars.
- Approximately 92.3% of listings show high availability (181+ days open annually), indicating potential for increased bookings or specific owner usage patterns.
- For booked days, the 1-30 days range is most frequent in Sammu (34.6%), reflecting common guest stay durations or potential owner blocking patterns.
- A notable 7.7% of properties secure long booking periods (181+ days booked per year), highlighting successful long-term rental strategies or significant owner usage.
Sammu Airbnb Minimum Stay Requirements Analysis
Distribution of Listings by Minimum Night Requirement
1 Night
24 listings
92.3% of total
2 Nights
1 listings
3.8% of total
30+ Nights
1 listings
3.8% of total
Key Insights
- The most prevalent minimum stay requirement in Sammu is 1 Night, adopted by 92.3% of listings. This highlights the market's preference for shorter, flexible bookings.
- A strong majority (96.1%) of the Sammu Airbnb data shows acceptance of very short stays (1-2 nights), indicating a dynamic, high-turnover market.
Recommendations
- Align with the market by considering a 1 Night minimum stay, as 92.3% of Sammu hosts use this setting.
- Adjust minimum nights based on seasonality – potentially shorter during low season and longer during peak demand periods in Sammu.
Sammu Airbnb Cancellation Policy Trends Analysis (2026)
Super Strict 30 Days
4 listings
15.4% of total
Limited
1 listings
3.8% of total
Moderate
5 listings
19.2% of total
Firm
14 listings
53.8% of total
Strict
2 listings
7.7% of total
Cancellation Policy Insights for Sammu
- The prevailing Airbnb cancellation policy trend in Sammu is Firm, used by 53.8% of listings.
- A majority (61.5%) of hosts in Sammu utilize Firm or Strict policies, indicating a market where hosts prioritize booking security.
- Strict cancellation policies are quite rare (7.7%), potentially making listings with this policy less competitive unless justified by high demand or property type.
Recommendations for Hosts
- Consider adopting a Firm policy to align with the 53.8% market standard in Sammu.
- Using a Strict policy might deter some guests, as only 7.7% of listings use it. Evaluate if potential revenue protection outweighs possible lower booking rates.
- Regularly review your cancellation policy against competitors and market demand shifts in Sammu.
Sammu STR Booking Lead Time Analysis (2026)
Average Booking Lead Time by Month
Booking Lead Time Insights for Sammu
- The overall average booking lead time for vacation rentals in Sammu is 27 days.
- Guests book furthest in advance for stays during August (average 39 days), likely coinciding with peak travel demand or local events.
- The shortest booking windows occur for stays in June (average 16 days), indicating more last-minute travel plans during this time.
- Seasonally, Winter (29 days avg.) sees the longest lead times, while Spring (24 days avg.) has the shortest, reflecting typical travel planning cycles.
Recommendations for Hosts
- Use the overall average lead time (27 days) as a baseline for your pricing and availability strategy in Sammu.
- For August stays, consider implementing length-of-stay discounts or slightly higher rates for bookings made less than 39 days out to capitalize on advance planning.
- Target marketing efforts for the Winter season well in advance (at least 29 days) to capture early planners.
- Monitor your own booking lead times against these Sammu averages to identify opportunities for dynamic pricing adjustments.
Popular & Essential Airbnb Amenities in Sammu (2026)
Amenity Prevalence
Amenity Insights for Sammu
- Essential amenities in Sammu that guests expect include: Free parking on premises, Wifi, Air conditioning. Lacking these (any) could significantly impact bookings.
- Popular amenities like Kitchen, Smoke alarm, Shampoo are common but not universal. Offering these can provide a competitive edge.
Recommendations for Hosts
- Ensure your listing includes all essential amenities for Sammu: Free parking on premises, Wifi, Air conditioning.
- Prioritize adding missing essentials: Wifi, Air conditioning.
- Consider adding popular differentiators like Kitchen or Smoke alarm to increase appeal.
- Highlight unique or less common amenities you offer (e.g., hot tub, dedicated workspace, EV charger) in your listing description and photos.
- Regularly check competitor amenities in Sammu to stay competitive.
Sammu Airbnb Guest Demographics & Profile Analysis (2026)
Guest Profile Summary for Sammu
- The typical guest profile for Airbnb in Sammu consists of primarily domestic travelers (75%), often arriving from nearby Chiba, typically belonging to the Post-2000s (Gen Z/Alpha) group (50%), primarily speaking Japanese or English.
- Domestic travelers account for 75.0% of guests.
- Key international markets include Japan (75%) and United States (8.8%).
- Top languages spoken are Japanese (42.6%) followed by English (31.5%).
- A significant demographic segment is the Post-2000s (Gen Z/Alpha) group, representing 50% of guests.
Recommendations for Hosts
- Target domestic marketing efforts towards travelers from Chiba and Yokohama.
- Tailor amenities and listing descriptions to appeal to the dominant Post-2000s (Gen Z/Alpha) demographic (e.g., highlight fast WiFi, smart home features, local guides).
- Highlight unique local experiences or amenities relevant to the primary guest profile.
- Consider seasonal promotions aligned with peak travel times for key origin markets.
Nearby Short-Term Rental Market Comparison
How does the Sammu Airbnb market stack up against its neighbors? Compare key performance metrics like average monthly revenue, ADR, and occupancy rates in surrounding areas to understand the broader regional STR landscape.
| Market | Active Properties | Monthly Revenue | Daily Rate | Avg. Occupancy |
|---|---|---|---|---|
| Shinagawa City | 50 | $7,769 | $428.93 | 62% |
| Futtsu | 31 | $5,187 | $369.80 | 44% |
| Kyonan | 15 | $5,099 | $419.89 | 42% |
| Adachi City | 47 | $4,752 | $301.69 | 50% |
| Kita | 15 | $4,563 | $305.24 | 57% |
| Shirako | 22 | $4,439 | $359.94 | 34% |
| Nagatoro | 10 | $4,035 | $249.70 | 52% |
| Kamogawa | 36 | $4,007 | $296.27 | 37% |
| Hakone | 335 | $3,905 | $289.84 | 48% |
| Minato City | 99 | $3,809 | $311.75 | 53% |