Katsuura Airbnb Market Analysis 2026: Short Term Rental Data & Vacation Rental Statistics in Chiba Prefecture, Japan
Is Airbnb profitable in Katsuura in 2026? Explore comprehensive Airbnb analytics for Katsuura, Chiba Prefecture, Japan to uncover income potential. This 2026 STR market report for Katsuura, based on AirROI data from February 2025 to January 2026, reveals key trends in the niche market of 31 active listings.
Whether you're considering an Airbnb investment in Katsuura, optimizing your existing vacation rental, or exploring rental arbitrage opportunities, understanding the Katsuura Airbnb data is crucial. Navigating the high regulation landscape is key to maximizing your short term rental income potential. Let's dive into the specifics.
Key Katsuura Airbnb Performance Metrics Overview
Monthly Airbnb Revenue Variations & Income Potential in Katsuura (2026)
Understanding the monthly revenue variations for Airbnb listings in Katsuura is key to maximizing your short term rental income potential. Seasonality significantly impacts earnings. Our analysis, based on data from the past 12 months, shows that the peak revenue month for STRs in Katsuura is typically August, while January often presents the lowest earnings, highlighting opportunities for strategic pricing adjustments during shoulder and low seasons. Explore the typical Airbnb income in Katsuura across different performance tiers:
- Best-in-class properties (Top 10%) achieve $5,915+ monthly, often utilizing dynamic pricing and superior guest experiences.
- Strong performing properties (Top 25%) earn $3,530 or more, indicating effective management and desirable locations/amenities.
- Typical properties (Median) generate around $2,008 per month, representing the average market performance.
- Entry-level properties (Bottom 25%) see earnings around $1,170, often with potential for optimization.
Average Monthly Airbnb Earnings Trend in Katsuura
Katsuura Airbnb Occupancy Rate Trends (2026)
Maximize your bookings by understanding the Katsuura STR occupancy trends. Seasonal demand shifts significantly influence how often properties are booked. Typically, Augustsees the highest demand (peak season occupancy), while January experiences the lowest (low season). Effective strategies, like adjusting minimum stays or offering promotions, can boost occupancy during slower periods. Here's how different property tiers perform in Katsuura:
- Best-in-class properties (Top 10%) achieve 62%+ occupancy, indicating high desirability and potentially optimized availability.
- Strong performing properties (Top 25%) maintain 48% or higher occupancy, suggesting good market fit and guest satisfaction.
- Typical properties (Median) have an occupancy rate around 33%.
- Entry-level properties (Bottom 25%) average 19% occupancy, potentially facing higher vacancy.
Average Monthly Occupancy Rate Trend in Katsuura
Average Daily Rate (ADR) Airbnb Trends in Katsuura (2026)
Effective short term rental pricing strategy in Katsuura involves understanding monthly ADR fluctuations. The Average Daily Rate (ADR) for Airbnb in Katsuura typically peaks in August and dips lowest during March. Leveraging Airbnb dynamic pricing tools or strategies based on this seasonality can significantly boost revenue. Here's a look at the typical nightly rates achieved:
- Best-in-class properties (Top 10%) command rates of $520+ per night, often due to premium features or locations.
- Strong performing properties (Top 25%) achieve nightly rates of $301 or more.
- Typical properties (Median) charge around $220 per night.
- Entry-level properties (Bottom 25%) earn around $157 per night.
Average Daily Rate (ADR) Trend by Month in Katsuura
Get Live Katsuura Market Intelligence 👇
Explore Real-time Analytics
Airbnb Seasonality Analysis & Trends in Katsuura (2026)
Peak Season (August, July, March)
- Revenue averages $4,868 per month
- Occupancy rates average 49.4%
- Daily rates average $278
Shoulder Season
- Revenue averages $2,707 per month
- Occupancy maintains around 31.6%
- Daily rates hold near $276
Low Season (January, April, November)
- Revenue drops to average $2,014 per month
- Occupancy decreases to average 26.3%
- Daily rates adjust to average $279
Seasonality Insights for Katsuura
- The Airbnb seasonality in Katsuura shows highly seasonal trends requiring careful strategy. While the sections above show seasonal averages, it's also insightful to look at the extremes:
- During the high season, the absolute peak month showcases Katsuura's highest earning potential, with monthly revenues capable of climbing to $7,462, occupancy reaching a high of 65.2%, and ADRs peaking at $323.
- Conversely, the slowest single month of the year, typically falling within the low season, marks the market's lowest point. In this month, revenue might dip to $1,971, occupancy could drop to 21.4%, and ADRs may adjust down to $236.
- Understanding both the seasonal averages and these monthly peaks and troughs in revenue, occupancy, and ADR is crucial for maximizing your Airbnb profit potential in Katsuura.
Seasonal Strategies for Maximizing Profit
- Peak Season: Maximize revenue through premium pricing and potentially longer minimum stays. Ensure high availability.
- Low Season: Offer competitive pricing, special promotions (e.g., extended stay discounts), and flexible cancellation policies. Target off-season travelers like remote workers or budget-conscious guests.
- Shoulder Seasons: Implement dynamic pricing that balances peak and low rates. Target weekend travelers or specific events. Offer slightly more flexible terms than peak season.
- Regularly analyze your own performance against these Katsuura seasonality benchmarks and adjust your pricing and availability strategy accordingly.
Best Areas for Airbnb Investment in Katsuura (2026)
Exploring the top neighborhoods for short-term rentals in Katsuura? This section highlights key areas, outlining why they are attractive for hosts and guests, along with notable local attractions. Consider these locations based on your target guest profile and investment strategy.
| Neighborhood / Area | Why Host Here? (Target Guests & Appeal) | Key Attractions & Landmarks |
|---|---|---|
| Katsuura Beach | A popular destination for beach-goers and surfers, known for its beautiful coastline and vibrant beach culture. Offers direct access to the ocean and various water sports attractions. | Katsuura Beach, Katsuura Fishing Port, Shirako Beach, Katsuura Sunset, Local seafood markets |
| Katsuura Onsen | Known for its hot springs, this area attracts visitors seeking relaxation and wellness. Perfect for tourists looking for a tranquil escape with therapeutic amenities. | Katsuura Onsen, Yasaka Shrine, Spa facilities, Traditional Japanese ryokan, Natural hot spring baths |
| Awa-Jurobe Mura | A cultural site featuring traditional Japanese crafts and practices, appealing to visitors interested in authentic local experiences and handmade goods. | Awa-Jurobe Mura, Local craft workshops, Awa Odori dance, Cultural festivals, Historical landmarks |
| Cape Nojima | A scenic and picturesque area providing stunning coastal views, popular with nature enthusiasts and those seeking outdoor adventures. | Cape Nojima Lighthouse, Hiking trails, Wildlife watching, Photography spots, Coastal parks |
| Katsuura Aquarium | A family-friendly attraction, ideal for visitors with children, featuring marine life exhibits and interactive experiences in a fun environment. | Katsuura Aquarium, Marine shows, Interactive exhibits, Educational programs, Gift shops |
| Katsuura Marina | Provides opportunities for water activities like sailing and fishing. An attractive spot for tourists interested in marine sports and leisure. | Katsuura Marina, Boat rentals, Fishing tours, Yachting experiences, Breathtaking seaside views |
| Katsuura Mifune Festival | A vibrant cultural festival celebrated annually, attracting visitors interested in local traditions, food, and entertainment, essential for experiencing Katsuura's cultural essence. | Mifune Festival events, Local cuisine, Fireworks displays, Traditional performances, Artisan market |
| Local Food Scene | Renowned for its fresh seafood and local culinary delights, attracting food lovers and travelers seeking authentic regional flavors. | Seafood restaurants, Local markets, Street food, Culinary tours, Cooking classes |
Understanding Airbnb License Requirements & STR Laws in Katsuura (2026)
Yes, Katsuura, Chiba Prefecture, Japan enforces high STR regulations. Obtaining a license and ensuring compliance is almost certainly required according to current 2026 STR laws. Always verify the latest short term rental regulations and Airbnb license requirements directly with local government authorities for Katsuura to ensure full compliance before hosting.
(Source: AirROI data, 2026, based on 97% licensed listings)
Top Performing Airbnb Properties in Katsuura (2026)
Benchmark your potential! Explore examples of top-performing Airbnb properties in Katsuurabased on Trailing Twelve Month (TTM) revenue. Analyze their characteristics, revenue, occupancy rate, and ADR to understand what drives success in this market.
2021 No. 1 Inn ‼️ Direct access to the beach ‼ BBQ in the️ roofed facility even in the rain ‼ The️ s
Entire Place • 4 bedrooms

Secret break Hebara#Chiba/Early Bird Discount
Entire Place • 2 bedrooms

Private ocean view building "THE VIBES VILLA"
Entire Place • 1 bedroom
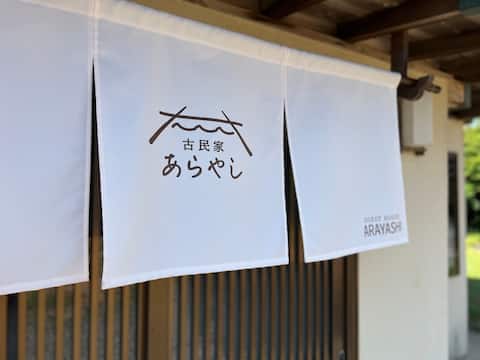
"Kominka Arayashi"
Entire Place • 3 bedrooms

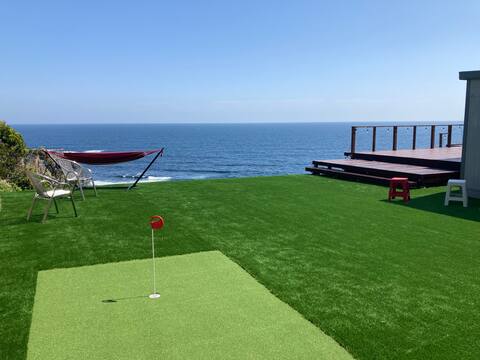
The blue sea is right in front of you! Entire Private Villa, Sanctuary Katsuura Hebara
Entire Place • 3 bedrooms

Overlooking the sea and the city/190㎡ spacious space/A luxurious time in the living room with the sc
Entire Place • 5 bedrooms
Note: Performance varies based on location, size, amenities, seasonality, and management quality. Data reflects the past 12 months.
Top Performing Airbnb Hosts in Katsuura (2026)
Learn from the best! This table showcases top-performing Airbnb hosts in Katsuura based on the number of properties managed and estimated total revenue over the past year. Analyze their scale and performance metrics.
| Host Name | Properties | Grossing Revenue | Stay Reviews | Avg Rating |
|---|---|---|---|---|
| Ryosuke | 1 | $221,428 | 611 | 4.96/5.0 |
| Jun | 1 | $78,056 | 88 | 4.92/5.0 |
| Shou | 2 | $69,917 | 473 | 4.93/5.0 |
| Yohei | 2 | $59,919 | 19 | 4.87/5.0 |
| Naoto | 1 | $58,120 | 1 | Not Rated |
| Tomoko | 1 | $50,503 | 109 | 4.97/5.0 |
| Hiroki | 1 | $49,828 | 67 | 4.87/5.0 |
| Zola | 2 | $48,226 | 429 | 4.96/5.0 |
| Yuta | 1 | $44,375 | 110 | 4.99/5.0 |
| Chika | 1 | $35,141 | 16 | 4.88/5.0 |
Analyzing the strategies of top hosts, such as their property selection, pricing, and guest communication, can offer valuable lessons for optimizing your own Airbnb operations in Katsuura.
Dive Deeper: Advanced Katsuura STR Market Data (2026)
Ready to unlock more insights? AirROI provides access to advanced metrics and comprehensive Airbnb data for Katsuura. Explore detailed analytics beyond this report to refine your investment strategy, optimize pricing, and maximize your vacation rental profits.
Explore Advanced MetricsKatsuura Short-Term Rental Market Composition (2026): Property & Room Types
Room Type Distribution
Property Type Distribution
Market Composition Insights for Katsuura
- The Katsuura Airbnb market composition is heavily skewed towards Entire Home/Apt listings, which make up 93.5% of the 31 active rentals. This indicates strong guest preference for privacy and space.
- Looking at the property type distribution in Katsuura, House properties are the most common (80.6%), reflecting the local real estate landscape.
- Houses represent a significant 80.6% portion, catering likely to families or larger groups.
Katsuura Airbnb Room Capacity Analysis (2026): Bedroom Distribution
Distribution of Listings by Number of Bedrooms
Room Capacity Insights for Katsuura
- The dominant room capacity in Katsuura is 3 bedrooms listings, making up 22.6% of the market. This suggests a strong demand for properties suitable for families or small groups.
- Together, 3 bedrooms and 4 bedrooms properties represent 45.2% of the active Airbnb listings in Katsuura, indicating a high concentration in these sizes.
- A significant 54.9% of listings offer 3+ bedrooms, catering to larger groups and families seeking more space in Katsuura.
Katsuura Vacation Rental Guest Capacity Trends (2026)
Distribution of Listings by Guest Capacity
Guest Capacity Insights for Katsuura
- The most common guest capacity trend in Katsuura vacation rentals is listings accommodating 8+ guests (48.4%). This suggests the primary traveler segment is likely larger groups.
- Properties designed for 8+ guests and 6 guests dominate the Katsuura STR market, accounting for 64.5% of listings.
- 71.0% of properties accommodate 6+ guests, serving the market segment for larger families or group travel in Katsuura.
- On average, properties in Katsuura are equipped to host 6.2 guests.
Katsuura Airbnb Booking Patterns (2026): Available vs. Booked Days
Available Days Distribution
Booked Days Distribution
Booking Pattern Insights for Katsuura
- The most common availability pattern in Katsuura falls within the 181-270 days range, representing 48.4% of listings. This suggests many properties have significant open periods on their calendars.
- Approximately 87.1% of listings show high availability (181+ days open annually), indicating potential for increased bookings or specific owner usage patterns.
- For booked days, the 91-180 days range is most frequent in Katsuura (48.4%), reflecting common guest stay durations or potential owner blocking patterns.
- A notable 12.9% of properties secure long booking periods (181+ days booked per year), highlighting successful long-term rental strategies or significant owner usage.
Katsuura Airbnb Minimum Stay Requirements Analysis
Distribution of Listings by Minimum Night Requirement
1 Night
29 listings
93.5% of total
30+ Nights
2 listings
6.5% of total
Key Insights
- The most prevalent minimum stay requirement in Katsuura is 1 Night, adopted by 93.5% of listings. This highlights the market's preference for shorter, flexible bookings.
- A strong majority (93.5%) of the Katsuura Airbnb data shows acceptance of very short stays (1-2 nights), indicating a dynamic, high-turnover market.
Recommendations
- Align with the market by considering a 1 Night minimum stay, as 93.5% of Katsuura hosts use this setting.
- Explore offering discounts for stays of 30+ nights to attract the 6.5% of the market seeking extended stays.
- Adjust minimum nights based on seasonality – potentially shorter during low season and longer during peak demand periods in Katsuura.
Katsuura Airbnb Cancellation Policy Trends Analysis (2026)
Limited
1 listings
3.2% of total
Flexible
2 listings
6.5% of total
Moderate
15 listings
48.4% of total
Firm
8 listings
25.8% of total
Strict
5 listings
16.1% of total
Cancellation Policy Insights for Katsuura
- The prevailing Airbnb cancellation policy trend in Katsuura is Moderate, used by 48.4% of listings.
- There's a relatively balanced mix between guest-friendly (54.9%) and stricter (41.9%) policies, offering choices for different guest needs.
Recommendations for Hosts
- Consider adopting a Moderate policy to align with the 48.4% market standard in Katsuura.
- Regularly review your cancellation policy against competitors and market demand shifts in Katsuura.
Katsuura STR Booking Lead Time Analysis (2026)
Average Booking Lead Time by Month
Booking Lead Time Insights for Katsuura
- The overall average booking lead time for vacation rentals in Katsuura is 38 days.
- Guests book furthest in advance for stays during August (average 48 days), likely coinciding with peak travel demand or local events.
- The shortest booking windows occur for stays in February (average 18 days), indicating more last-minute travel plans during this time.
- Seasonally, Summer (39 days avg.) sees the longest lead times, while Winter (32 days avg.) has the shortest, reflecting typical travel planning cycles.
Recommendations for Hosts
- Use the overall average lead time (38 days) as a baseline for your pricing and availability strategy in Katsuura.
- Target marketing efforts for the Summer season well in advance (at least 39 days) to capture early planners.
- Monitor your own booking lead times against these Katsuura averages to identify opportunities for dynamic pricing adjustments.
Popular & Essential Airbnb Amenities in Katsuura (2026)
Amenity Prevalence
Amenity Insights for Katsuura
- Essential amenities in Katsuura that guests expect include: Air conditioning, Wifi. Lacking these (any) could significantly impact bookings.
- Popular amenities like Kitchen, Smoke alarm, Free parking on premises are common but not universal. Offering these can provide a competitive edge.
Recommendations for Hosts
- Ensure your listing includes all essential amenities for Katsuura: Air conditioning, Wifi.
- Prioritize adding missing essentials: Wifi.
- Consider adding popular differentiators like Kitchen or Smoke alarm to increase appeal.
- Highlight unique or less common amenities you offer (e.g., hot tub, dedicated workspace, EV charger) in your listing description and photos.
- Regularly check competitor amenities in Katsuura to stay competitive.
Katsuura Airbnb Guest Demographics & Profile Analysis (2026)
Guest Profile Summary for Katsuura
- The typical guest profile for Airbnb in Katsuura consists of primarily domestic travelers (72%), often arriving from nearby Tokyo, typically belonging to the Post-2000s (Gen Z/Alpha) group (50%), primarily speaking Japanese or English.
- Domestic travelers account for 71.5% of guests.
- Key international markets include Japan (71.5%) and United States (6.3%).
- Top languages spoken are Japanese (45.2%) followed by English (32.9%).
- A significant demographic segment is the Post-2000s (Gen Z/Alpha) group, representing 50% of guests.
Recommendations for Hosts
- Target domestic marketing efforts towards travelers from Tokyo and Tokyo Prefecture.
- Tailor amenities and listing descriptions to appeal to the dominant Post-2000s (Gen Z/Alpha) demographic (e.g., highlight fast WiFi, smart home features, local guides).
- Highlight unique local experiences or amenities relevant to the primary guest profile.
- Consider seasonal promotions aligned with peak travel times for key origin markets.
Nearby Short-Term Rental Market Comparison
How does the Katsuura Airbnb market stack up against its neighbors? Compare key performance metrics like average monthly revenue, ADR, and occupancy rates in surrounding areas to understand the broader regional STR landscape.
| Market | Active Properties | Monthly Revenue | Daily Rate | Avg. Occupancy |
|---|---|---|---|---|
| Shinagawa City | 50 | $7,769 | $428.93 | 62% |
| Futtsu | 31 | $5,187 | $369.80 | 44% |
| Kyonan | 15 | $5,099 | $419.90 | 42% |
| Adachi City | 47 | $4,752 | $301.69 | 50% |
| Kita | 15 | $4,563 | $305.24 | 57% |
| Shirako | 22 | $4,439 | $359.94 | 34% |
| Nagatoro | 10 | $4,035 | $249.70 | 52% |
| Kamogawa | 36 | $4,007 | $296.27 | 37% |
| Hakone | 335 | $3,905 | $289.84 | 48% |
| Karuizawa | 121 | $3,852 | $396.31 | 39% |