Tokoname Airbnb Market Analysis 2026: Short Term Rental Data & Vacation Rental Statistics in Aichi Prefecture, Japan
Is Airbnb profitable in Tokoname in 2026? Explore comprehensive Airbnb analytics for Tokoname, Aichi Prefecture, Japan to uncover income potential. This 2026 STR market report for Tokoname, based on AirROI data from February 2025 to January 2026, reveals key trends in the niche market of 36 active listings.
Whether you're considering an Airbnb investment in Tokoname, optimizing your existing vacation rental, or exploring rental arbitrage opportunities, understanding the Tokoname Airbnb data is crucial. Navigating the high regulation landscape is key to maximizing your short term rental income potential. Let's dive into the specifics.
Key Tokoname Airbnb Performance Metrics Overview
Monthly Airbnb Revenue Variations & Income Potential in Tokoname (2026)
Understanding the monthly revenue variations for Airbnb listings in Tokoname is key to maximizing your short term rental income potential. Seasonality significantly impacts earnings. Our analysis, based on data from the past 12 months, shows that the peak revenue month for STRs in Tokoname is typically November, while January often presents the lowest earnings, highlighting opportunities for strategic pricing adjustments during shoulder and low seasons. Explore the typical Airbnb income in Tokoname across different performance tiers:
- Best-in-class properties (Top 10%) achieve $3,071+ monthly, often utilizing dynamic pricing and superior guest experiences.
- Strong performing properties (Top 25%) earn $1,209 or more, indicating effective management and desirable locations/amenities.
- Typical properties (Median) generate around $727 per month, representing the average market performance.
- Entry-level properties (Bottom 25%) see earnings around $469, often with potential for optimization.
Average Monthly Airbnb Earnings Trend in Tokoname
Tokoname Airbnb Occupancy Rate Trends (2026)
Maximize your bookings by understanding the Tokoname STR occupancy trends. Seasonal demand shifts significantly influence how often properties are booked. Typically, Novembersees the highest demand (peak season occupancy), while January experiences the lowest (low season). Effective strategies, like adjusting minimum stays or offering promotions, can boost occupancy during slower periods. Here's how different property tiers perform in Tokoname:
- Best-in-class properties (Top 10%) achieve 70%+ occupancy, indicating high desirability and potentially optimized availability.
- Strong performing properties (Top 25%) maintain 54% or higher occupancy, suggesting good market fit and guest satisfaction.
- Typical properties (Median) have an occupancy rate around 36%.
- Entry-level properties (Bottom 25%) average 18% occupancy, potentially facing higher vacancy.
Average Monthly Occupancy Rate Trend in Tokoname
Average Daily Rate (ADR) Airbnb Trends in Tokoname (2026)
Effective short term rental pricing strategy in Tokoname involves understanding monthly ADR fluctuations. The Average Daily Rate (ADR) for Airbnb in Tokoname typically peaks in August and dips lowest during January. Leveraging Airbnb dynamic pricing tools or strategies based on this seasonality can significantly boost revenue. Here's a look at the typical nightly rates achieved:
- Best-in-class properties (Top 10%) command rates of $272+ per night, often due to premium features or locations.
- Strong performing properties (Top 25%) achieve nightly rates of $131 or more.
- Typical properties (Median) charge around $76 per night.
- Entry-level properties (Bottom 25%) earn around $48 per night.
Average Daily Rate (ADR) Trend by Month in Tokoname
Get Live Tokoname Market Intelligence 👇

Explore Real-time Analytics
Airbnb Seasonality Analysis & Trends in Tokoname (2026)
Peak Season (November, August, May)
- Revenue averages $1,466 per month
- Occupancy rates average 43.9%
- Daily rates average $129
Shoulder Season
- Revenue averages $1,235 per month
- Occupancy maintains around 37.7%
- Daily rates hold near $122
Low Season (January, February, June)
- Revenue drops to average $1,005 per month
- Occupancy decreases to average 32.0%
- Daily rates adjust to average $124
Seasonality Insights for Tokoname
- The Airbnb seasonality in Tokoname shows moderate seasonality with distinct peak and low periods. While the sections above show seasonal averages, it's also insightful to look at the extremes:
- During the high season, the absolute peak month showcases Tokoname's highest earning potential, with monthly revenues capable of climbing to $1,485, occupancy reaching a high of 49.2%, and ADRs peaking at $141.
- Conversely, the slowest single month of the year, typically falling within the low season, marks the market's lowest point. In this month, revenue might dip to $865, occupancy could drop to 30.5%, and ADRs may adjust down to $108.
- Understanding both the seasonal averages and these monthly peaks and troughs in revenue, occupancy, and ADR is crucial for maximizing your Airbnb profit potential in Tokoname.
Seasonal Strategies for Maximizing Profit
- Peak Season: Maximize revenue through premium pricing and potentially longer minimum stays. Ensure high availability.
- Low Season: Offer competitive pricing, special promotions (e.g., extended stay discounts), and flexible cancellation policies. Target off-season travelers like remote workers or budget-conscious guests.
- Shoulder Seasons: Implement dynamic pricing that balances peak and low rates. Target weekend travelers or specific events. Offer slightly more flexible terms than peak season.
- Regularly analyze your own performance against these Tokoname seasonality benchmarks and adjust your pricing and availability strategy accordingly.
Best Areas for Airbnb Investment in Tokoname (2026)
Exploring the top neighborhoods for short-term rentals in Tokoname? This section highlights key areas, outlining why they are attractive for hosts and guests, along with notable local attractions. Consider these locations based on your target guest profile and investment strategy.
| Neighborhood / Area | Why Host Here? (Target Guests & Appeal) | Key Attractions & Landmarks |
|---|---|---|
| Tokoname City Center | The bustling heart of Tokoname, known for its pottery and traditional crafts. This area is perfect for tourists interested in culture and local experiences, with convenient access to transport. | Tokoname Pottery Street, Tokoname Ceramics Museum, Tokoname Airport, Kōbōen Park, Heidi's Garden |
| Kuwana | Located nearby, Kuwana offers access to leisure facilities like the Nagashima Spa Land and hot springs, making it attractive for family trips and leisure stays. | Nagashima Spa Land, Yuami no Shima, Kuwana Castle, Nagashima Resort, Tama River Park |
| Ryuhoji | A serene area that appeals to travelers seeking relaxation and nature, with temples and gardens that reflect traditional Japanese aesthetics. | Ryuhoji Temple, Tokoname Green Nature Park, Jōrin Temple, Chinju Shrine, Asanogawa River |
| Aichi Factory Outlets | A major shopping destination that attracts visitors from surrounding areas. Ideal for those looking to combine shopping with tourism. | Aichi Factory Outlets, Asunarokyokai Park, Ama Park, Dogo Park |
| Tokoname Airport Area | Convenient for international travelers owing to its proximity to Chubu Centrair International Airport, making it ideal for short-term stays. | Chubu Centrair International Airport, Centrair Island, Sora no Ehon Museum, Tokoname Toy Museum |
| Mikawaanjo | A tranquil spot with access to walking trails and parks, appealing to nature enthusiasts and families looking for a quieter getaway. | Mikawaanjo Park, Fureai no Mori, Okinaga Shrine |
| Kitanagoya | A family-friendly area with parks and local dining options, perfect for vacationers who prefer a relaxed pace and local culture. | Fureai Park, Tsuchida Park, Kitanagoya Shrine, local eateries |
| Chita Peninsula | A picturesque destination known for its beaches and seafood. Great for travelers looking for coastal experiences and fresh cuisine. | Kujukuri Beach, Chita Peninsula Fish Market, Chita Peninsula Aquarium |
Understanding Airbnb License Requirements & STR Laws in Tokoname (2026)
Yes, Tokoname, Aichi Prefecture, Japan enforces high STR regulations. Obtaining a license and ensuring compliance is almost certainly required according to current 2026 STR laws. Always verify the latest short term rental regulations and Airbnb license requirements directly with local government authorities for Tokoname to ensure full compliance before hosting.
(Source: AirROI data, 2026, based on 100% licensed listings)
Top Performing Airbnb Properties in Tokoname (2026)
Benchmark your potential! Explore examples of top-performing Airbnb properties in Tokonamebased on Trailing Twelve Month (TTM) revenue. Analyze their characteristics, revenue, occupancy rate, and ADR to understand what drives success in this market.
A barbecue area and accommodation for up to 15 people (families, clubs, corporate training, etc.)
Entire Place • 7 bedrooms
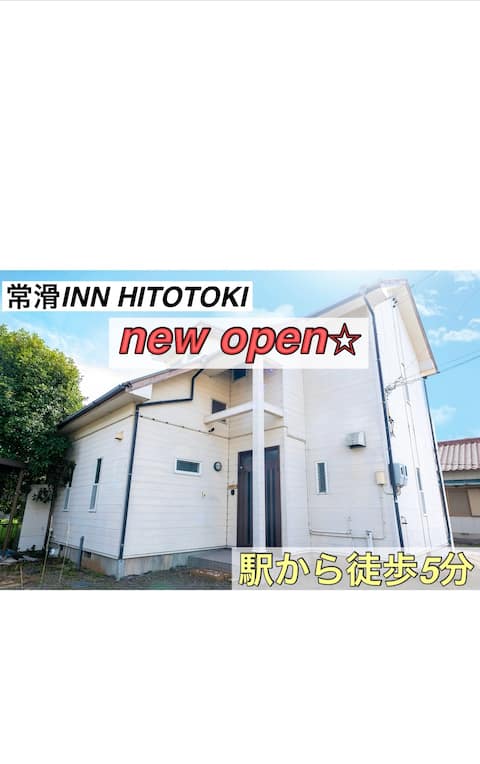
2024.11 NEW OPEN Tokoname rental house
Entire Place • 3 bedrooms

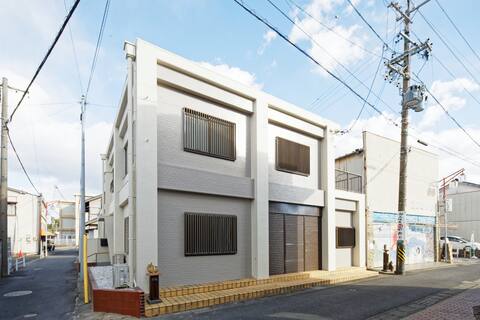
Explore Pottery Town by Bike|Airport|Attic House
Private Room • 3 bedrooms
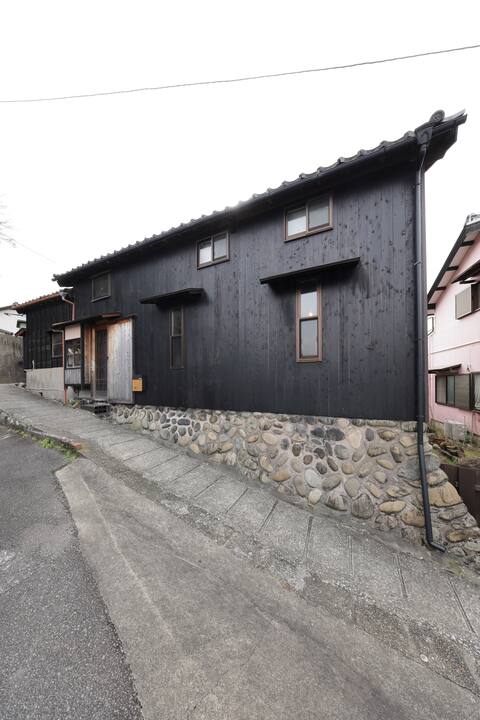
Nincha:150 years old renovated traditional House
Entire Place • 3 bedrooms

Yakimono promenade. Entire old house. Max 8 people.
Entire Place • 3 bedrooms

5-8 people. 1-2 Bedrooms. Cooking NOT Allowed.
Private Room • 3 bedrooms
Note: Performance varies based on location, size, amenities, seasonality, and management quality. Data reflects the past 12 months.
Top Performing Airbnb Hosts in Tokoname (2026)
Learn from the best! This table showcases top-performing Airbnb hosts in Tokoname based on the number of properties managed and estimated total revenue over the past year. Analyze their scale and performance metrics.
| Host Name | Properties | Grossing Revenue | Stay Reviews | Avg Rating |
|---|---|---|---|---|
| だいすけ | 1 | $70,427 | 26 | 4.73/5.0 |
| Nincha | 4 | $63,081 | 318 | 4.85/5.0 |
| Akira | 7 | $44,977 | 556 | 4.64/5.0 |
| Naoki | 1 | $44,348 | 55 | 4.73/5.0 |
| Rina | 1 | $44,212 | 42 | 4.95/5.0 |
| 麦子 | 5 | $32,063 | 576 | 4.75/5.0 |
| Jun-Sann | 4 | $32,048 | 166 | 4.96/5.0 |
| Mike | 4 | $22,598 | 670 | 4.96/5.0 |
| 翔太 | 1 | $22,132 | 2 | Not Rated |
| Junyan | 3 | $20,095 | 146 | 4.85/5.0 |
Analyzing the strategies of top hosts, such as their property selection, pricing, and guest communication, can offer valuable lessons for optimizing your own Airbnb operations in Tokoname.
Dive Deeper: Advanced Tokoname STR Market Data (2026)
Ready to unlock more insights? AirROI provides access to advanced metrics and comprehensive Airbnb data for Tokoname. Explore detailed analytics beyond this report to refine your investment strategy, optimize pricing, and maximize your vacation rental profits.
Explore Advanced MetricsTokoname Short-Term Rental Market Composition (2026): Property & Room Types
Room Type Distribution
Property Type Distribution
Market Composition Insights for Tokoname
- The Tokoname Airbnb market composition is heavily skewed towards Private Room listings, which make up 75% of the 36 active rentals. This indicates strong guest preference for privacy and space.
- Looking at the property type distribution in Tokoname, House properties are the most common (72.2%), reflecting the local real estate landscape.
- Houses represent a significant 72.2% portion, catering likely to families or larger groups.
Tokoname Airbnb Room Capacity Analysis (2026): Bedroom Distribution
Distribution of Listings by Number of Bedrooms
Room Capacity Insights for Tokoname
- The dominant room capacity in Tokoname is 3 bedrooms listings, making up 16.7% of the market. This suggests a strong demand for properties suitable for families or small groups.
- Together, 3 bedrooms and 1 bedroom properties represent 33.4% of the active Airbnb listings in Tokoname, indicating a high concentration in these sizes.
Tokoname Vacation Rental Guest Capacity Trends (2026)
Distribution of Listings by Guest Capacity
Guest Capacity Insights for Tokoname
- The most common guest capacity trend in Tokoname vacation rentals is listings accommodating 8+ guests (11.1%). This suggests the primary traveler segment is likely larger groups.
- Properties designed for 8+ guests and 2 guests dominate the Tokoname STR market, accounting for 16.7% of listings.
- 19.5% of properties accommodate 6+ guests, serving the market segment for larger families or group travel in Tokoname.
- On average, properties in Tokoname are equipped to host 1.9 guests.
Tokoname Airbnb Booking Patterns (2026): Available vs. Booked Days
Available Days Distribution
Booked Days Distribution
Booking Pattern Insights for Tokoname
- The most common availability pattern in Tokoname falls within the 271-366 days range, representing 47.2% of listings. This suggests many properties have significant open periods on their calendars.
- Approximately 77.8% of listings show high availability (181+ days open annually), indicating potential for increased bookings or specific owner usage patterns.
- For booked days, the 31-90 days range is most frequent in Tokoname (36.1%), reflecting common guest stay durations or potential owner blocking patterns.
- A notable 22.3% of properties secure long booking periods (181+ days booked per year), highlighting successful long-term rental strategies or significant owner usage.
Tokoname Airbnb Minimum Stay Requirements Analysis
Distribution of Listings by Minimum Night Requirement
1 Night
36 listings
100% of total
Key Insights
- The most prevalent minimum stay requirement in Tokoname is 1 Night, adopted by 100% of listings. This highlights the market's preference for shorter, flexible bookings.
- A strong majority (100.0%) of the Tokoname Airbnb data shows acceptance of very short stays (1-2 nights), indicating a dynamic, high-turnover market.
Recommendations
- Align with the market by considering a 1 Night minimum stay, as 100% of Tokoname hosts use this setting.
- Adjust minimum nights based on seasonality – potentially shorter during low season and longer during peak demand periods in Tokoname.
Tokoname Airbnb Cancellation Policy Trends Analysis (2026)
Super Strict 60 Days
1 listings
2.8% of total
Flexible
12 listings
33.3% of total
Moderate
5 listings
13.9% of total
Firm
18 listings
50% of total
Cancellation Policy Insights for Tokoname
- The prevailing Airbnb cancellation policy trend in Tokoname is Firm, used by 50% of listings.
- There's a relatively balanced mix between guest-friendly (47.2%) and stricter (50.0%) policies, offering choices for different guest needs.
Recommendations for Hosts
- Consider adopting a Firm policy to align with the 50% market standard in Tokoname.
- Regularly review your cancellation policy against competitors and market demand shifts in Tokoname.
Tokoname STR Booking Lead Time Analysis (2026)
Average Booking Lead Time by Month
Booking Lead Time Insights for Tokoname
- The overall average booking lead time for vacation rentals in Tokoname is 43 days.
- Guests book furthest in advance for stays during December (average 59 days), likely coinciding with peak travel demand or local events.
- The shortest booking windows occur for stays in March (average 29 days), indicating more last-minute travel plans during this time.
- Seasonally, Fall (47 days avg.) sees the longest lead times, while Summer (36 days avg.) has the shortest, reflecting typical travel planning cycles.
Recommendations for Hosts
- Use the overall average lead time (43 days) as a baseline for your pricing and availability strategy in Tokoname.
- For December stays, consider implementing length-of-stay discounts or slightly higher rates for bookings made less than 59 days out to capitalize on advance planning.
- Target marketing efforts for the Fall season well in advance (at least 47 days) to capture early planners.
- Monitor your own booking lead times against these Tokoname averages to identify opportunities for dynamic pricing adjustments.
Popular & Essential Airbnb Amenities in Tokoname (2026)
Amenity Prevalence
Amenity Insights for Tokoname
- Essential amenities in Tokoname that guests expect include: Hair dryer, Air conditioning, Wifi, Smoke alarm. Lacking these (any) could significantly impact bookings.
- Popular amenities like Shampoo, Heating, Hangers are common but not universal. Offering these can provide a competitive edge.
Recommendations for Hosts
- Ensure your listing includes all essential amenities for Tokoname: Hair dryer, Air conditioning, Wifi, Smoke alarm.
- Prioritize adding missing essentials: Smoke alarm.
- Consider adding popular differentiators like Shampoo or Heating to increase appeal.
- Highlight unique or less common amenities you offer (e.g., hot tub, dedicated workspace, EV charger) in your listing description and photos.
- Regularly check competitor amenities in Tokoname to stay competitive.
Tokoname Airbnb Guest Demographics & Profile Analysis (2026)
Guest Profile Summary for Tokoname
- The typical guest profile for Airbnb in Tokoname consists of predominantly international visitors (85%), with top international origins including China, typically belonging to the Post-2000s (Gen Z/Alpha) group (50%), primarily speaking English or Chinese.
- Domestic travelers account for 14.8% of guests.
- Key international markets include Japan (14.8%) and China (14.3%).
- Top languages spoken are English (42.2%) followed by Chinese (22.5%).
- A significant demographic segment is the Post-2000s (Gen Z/Alpha) group, representing 50% of guests.
Recommendations for Hosts
- Focus marketing internationally, particularly towards travelers from China.
- Tailor amenities and listing descriptions to appeal to the dominant Post-2000s (Gen Z/Alpha) demographic (e.g., highlight fast WiFi, smart home features, local guides).
- Highlight unique local experiences or amenities relevant to the primary guest profile.
- Consider seasonal promotions aligned with peak travel times for key origin markets.
Nearby Short-Term Rental Market Comparison
How does the Tokoname Airbnb market stack up against its neighbors? Compare key performance metrics like average monthly revenue, ADR, and occupancy rates in surrounding areas to understand the broader regional STR landscape.
| Market | Active Properties | Monthly Revenue | Daily Rate | Avg. Occupancy |
|---|---|---|---|---|
| Shima | 40 | $3,717 | $295.59 | 40% |
| Toba | 12 | $3,477 | $332.20 | 31% |
| Shimogyo Ward | 34 | $3,396 | $279.96 | 49% |
| Kameoka | 11 | $3,265 | $226.40 | 45% |
| Kyoto | 3,744 | $3,232 | $193.65 | 57% |
| Minami Ward | 28 | $2,977 | $202.49 | 59% |
| Kamigyo Ward | 11 | $2,757 | $218.11 | 50% |
| Fushimi Ward | 12 | $2,704 | $194.55 | 53% |
| Nakagyo Ward | 15 | $2,533 | $201.93 | 52% |
| Takashima | 86 | $2,354 | $194.72 | 34% |