Soave Airbnb Market Analysis 2026: Short Term Rental Data & Vacation Rental Statistics in Veneto, Italy
Is Airbnb profitable in Soave in 2026? Explore comprehensive Airbnb analytics for Soave, Veneto, Italy to uncover income potential. This 2026 STR market report for Soave, based on AirROI data from February 2025 to January 2026, reveals key trends in the niche market of 44 active listings.
Whether you're considering an Airbnb investment in Soave, optimizing your existing vacation rental, or exploring rental arbitrage opportunities, understanding the Soave Airbnb data is crucial. Navigating the high regulation landscape is key to maximizing your short term rental income potential. Let's dive into the specifics.
Key Soave Airbnb Performance Metrics Overview
Monthly Airbnb Revenue Variations & Income Potential in Soave (2026)
Understanding the monthly revenue variations for Airbnb listings in Soave is key to maximizing your short term rental income potential. Seasonality significantly impacts earnings. Our analysis, based on data from the past 12 months, shows that the peak revenue month for STRs in Soave is typically July, while December often presents the lowest earnings, highlighting opportunities for strategic pricing adjustments during shoulder and low seasons. Explore the typical Airbnb income in Soave across different performance tiers:
- Best-in-class properties (Top 10%) achieve $2,967+ monthly, often utilizing dynamic pricing and superior guest experiences.
- Strong performing properties (Top 25%) earn $1,999 or more, indicating effective management and desirable locations/amenities.
- Typical properties (Median) generate around $1,184 per month, representing the average market performance.
- Entry-level properties (Bottom 25%) see earnings around $635, often with potential for optimization.
Average Monthly Airbnb Earnings Trend in Soave
Soave Airbnb Occupancy Rate Trends (2026)
Maximize your bookings by understanding the Soave STR occupancy trends. Seasonal demand shifts significantly influence how often properties are booked. Typically, Julysees the highest demand (peak season occupancy), while December experiences the lowest (low season). Effective strategies, like adjusting minimum stays or offering promotions, can boost occupancy during slower periods. Here's how different property tiers perform in Soave:
- Best-in-class properties (Top 10%) achieve 64%+ occupancy, indicating high desirability and potentially optimized availability.
- Strong performing properties (Top 25%) maintain 48% or higher occupancy, suggesting good market fit and guest satisfaction.
- Typical properties (Median) have an occupancy rate around 30%.
- Entry-level properties (Bottom 25%) average 14% occupancy, potentially facing higher vacancy.
Average Monthly Occupancy Rate Trend in Soave
Average Daily Rate (ADR) Airbnb Trends in Soave (2026)
Effective short term rental pricing strategy in Soave involves understanding monthly ADR fluctuations. The Average Daily Rate (ADR) for Airbnb in Soave typically peaks in March and dips lowest during January. Leveraging Airbnb dynamic pricing tools or strategies based on this seasonality can significantly boost revenue. Here's a look at the typical nightly rates achieved:
- Best-in-class properties (Top 10%) command rates of $235+ per night, often due to premium features or locations.
- Strong performing properties (Top 25%) achieve nightly rates of $150 or more.
- Typical properties (Median) charge around $118 per night.
- Entry-level properties (Bottom 25%) earn around $98 per night.
Average Daily Rate (ADR) Trend by Month in Soave
Get Live Soave Market Intelligence 👇

Explore Real-time Analytics
Airbnb Seasonality Analysis & Trends in Soave (2026)
Peak Season (July, August, May)
- Revenue averages $2,137 per month
- Occupancy rates average 42.4%
- Daily rates average $148
Shoulder Season
- Revenue averages $1,467 per month
- Occupancy maintains around 33.4%
- Daily rates hold near $140
Low Season (January, February, December)
- Revenue drops to average $797 per month
- Occupancy decreases to average 24.4%
- Daily rates adjust to average $127
Seasonality Insights for Soave
- The Airbnb seasonality in Soave shows highly seasonal trends requiring careful strategy. While the sections above show seasonal averages, it's also insightful to look at the extremes:
- During the high season, the absolute peak month showcases Soave's highest earning potential, with monthly revenues capable of climbing to $2,411, occupancy reaching a high of 47.7%, and ADRs peaking at $157.
- Conversely, the slowest single month of the year, typically falling within the low season, marks the market's lowest point. In this month, revenue might dip to $652, occupancy could drop to 23.1%, and ADRs may adjust down to $121.
- Understanding both the seasonal averages and these monthly peaks and troughs in revenue, occupancy, and ADR is crucial for maximizing your Airbnb profit potential in Soave.
Seasonal Strategies for Maximizing Profit
- Peak Season: Maximize revenue through premium pricing and potentially longer minimum stays. Ensure high availability.
- Low Season: Offer competitive pricing, special promotions (e.g., extended stay discounts), and flexible cancellation policies. Target off-season travelers like remote workers or budget-conscious guests.
- Shoulder Seasons: Implement dynamic pricing that balances peak and low rates. Target weekend travelers or specific events. Offer slightly more flexible terms than peak season.
- Regularly analyze your own performance against these Soave seasonality benchmarks and adjust your pricing and availability strategy accordingly.
Best Areas for Airbnb Investment in Soave (2026)
Exploring the top neighborhoods for short-term rentals in Soave? This section highlights key areas, outlining why they are attractive for hosts and guests, along with notable local attractions. Consider these locations based on your target guest profile and investment strategy.
| Neighborhood / Area | Why Host Here? (Target Guests & Appeal) | Key Attractions & Landmarks |
|---|---|---|
| Soave Castle | A historic medieval castle offering beautiful views and a glimpse into the past. Attracts history enthusiasts and couples looking for a romantic getaway. | Soave Castle, Castello di Soave, Wine Cellars, Historical Center, Church of San Lorenzo, Piazza dell'Indipendenza |
| Wine Region | Famous for its vineyards and wine production, this area attracts wine lovers and tourists looking to explore local wineries and tasting tours. | Vigneti del Soave, Cantina di Soave, Grape Harvest Festivals, Wine Museums, Scenic Vineyards |
| Historical Center of Soave | Charming medieval streets filled with shops, cafes, and restaurants. Perfect for travelers who enjoy exploring local culture and cuisine. | Via Roma, Local Restaurants, Artisan Shops, Palazzo di Giustizia, Piazza della Libertà |
| Nearby Verona | Just a short drive away, Verona offers a wealth of attractions including the Arena di Verona and Juliet's House, attracting tourists looking for more extensive cultural experiences. | Arena di Verona, Juliet's Balcony, Piazza delle Erbe, Verona Cathedral, Castelvecchio |
| Monte Carpenedo | A hillside area providing beautiful landscapes and outdoor activities, favored by nature lovers and those seeking relaxation. | Hiking Trails, Natural Reserves, Picnic Areas, Breathtaking Views, Birdwatching |
| Local Festivals | Soave hosts various local festivals throughout the year, attracting visitors looking for unique cultural experiences. | Soave Wine Festival, Historical Reenactments, Food Festivals, Cultural Events |
| Art and Culture | The region is rich in art and culture, making it an attractive destination for tourists interested in local heritage. | Local Art Galleries, Cultural Heritage Sites, Art Workshops, Theaters, Local Artisan Fairs |
| Countryside Retreats | The serene countryside surrounding Soave offers a peaceful escape, perfect for visitors looking to unwind in nature. | Agriturismos, Scenic Farms, Nature Trails, Quiet Villages, Organic Produce |
Understanding Airbnb License Requirements & STR Laws in Soave (2026)
Yes, Soave, Veneto, Italy enforces high STR regulations. Obtaining a license and ensuring compliance is almost certainly required according to current 2026 STR laws. Always verify the latest short term rental regulations and Airbnb license requirements directly with local government authorities for Soave to ensure full compliance before hosting.
(Source: AirROI data, 2026, based on 66% licensed listings)
Top Performing Airbnb Properties in Soave (2026)
Benchmark your potential! Explore examples of top-performing Airbnb properties in Soavebased on Trailing Twelve Month (TTM) revenue. Analyze their characteristics, revenue, occupancy rate, and ADR to understand what drives success in this market.
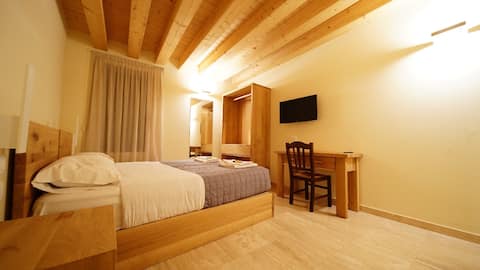
The Window on the Castle SOAVE
Entire Place • 5 bedrooms
Soave Rooms - wifi & confort
Private Room • 1 bedroom
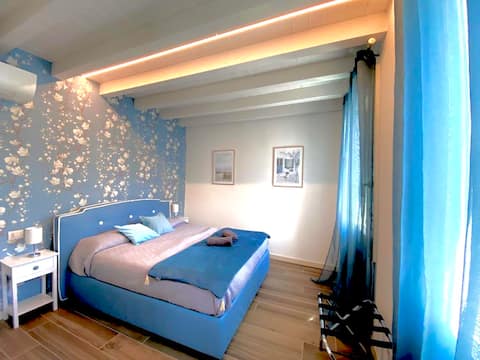
Room with en-suite bathroom
Private Room • N/A
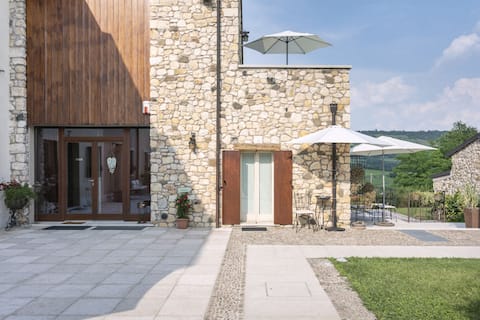
Apartment AIA with private terrace
Entire Place • 1 bedroom

Corte dei Soavi - Il Fienile Apartment
Entire Place • 1 bedroom
The Terrace Apartment Deluxe - Corte dei Soavi
Entire Place • 1 bedroom
Note: Performance varies based on location, size, amenities, seasonality, and management quality. Data reflects the past 12 months.
Top Performing Airbnb Hosts in Soave (2026)
Learn from the best! This table showcases top-performing Airbnb hosts in Soave based on the number of properties managed and estimated total revenue over the past year. Analyze their scale and performance metrics.
| Host Name | Properties | Grossing Revenue | Stay Reviews | Avg Rating |
|---|---|---|---|---|
| Sara | 10 | $162,499 | 482 | 4.97/5.0 |
| Cristian | 4 | $84,779 | 96 | 4.62/5.0 |
| Gero | 3 | $54,068 | 54 | 4.85/5.0 |
| Nicolas | 1 | $47,016 | 87 | 4.80/5.0 |
| Graziano | 5 | $44,408 | 49 | 4.97/5.0 |
| Stefania | 1 | $22,308 | 35 | 4.74/5.0 |
| Giorgia | 4 | $17,152 | 65 | 4.88/5.0 |
| Agriturismo Montetondo | 2 | $16,104 | 10 | 4.45/5.0 |
| Francesco Tamellin | 3 | $14,479 | 3 | Not Rated |
| Luigino | 3 | $12,182 | 35 | 5.00/5.0 |
Analyzing the strategies of top hosts, such as their property selection, pricing, and guest communication, can offer valuable lessons for optimizing your own Airbnb operations in Soave.
Dive Deeper: Advanced Soave STR Market Data (2026)
Ready to unlock more insights? AirROI provides access to advanced metrics and comprehensive Airbnb data for Soave. Explore detailed analytics beyond this report to refine your investment strategy, optimize pricing, and maximize your vacation rental profits.
Explore Advanced MetricsSoave Short-Term Rental Market Composition (2026): Property & Room Types
Room Type Distribution
Property Type Distribution
Market Composition Insights for Soave
- The Soave Airbnb market composition is heavily skewed towards Private Room listings, which make up 56.8% of the 44 active rentals. This indicates strong guest preference for privacy and space.
- Looking at the property type distribution in Soave, Apartment/Condo properties are the most common (36.4%), reflecting the local real estate landscape.
- Houses represent a significant 18.2% portion, catering likely to families or larger groups.
- The presence of 25% Hotel/Boutique listings indicates integration with traditional hospitality.
Soave Airbnb Room Capacity Analysis (2026): Bedroom Distribution
Distribution of Listings by Number of Bedrooms
Room Capacity Insights for Soave
- The dominant room capacity in Soave is 1 bedroom listings, making up 45.5% of the market. This suggests a strong demand for properties suitable for couples or solo travelers.
- Together, 1 bedroom and 2 bedrooms properties represent 56.9% of the active Airbnb listings in Soave, indicating a high concentration in these sizes.
- Listings with 3+ bedrooms (6.8%) represent a smaller niche, potentially indicating an underserved market for larger group accommodations in Soave.
Soave Vacation Rental Guest Capacity Trends (2026)
Distribution of Listings by Guest Capacity
Guest Capacity Insights for Soave
- The most common guest capacity trend in Soave vacation rentals is listings accommodating 2 guests (31.8%). This suggests the primary traveler segment is likely couples or solo travelers.
- Properties designed for 2 guests and 4 guests dominate the Soave STR market, accounting for 47.7% of listings.
- On average, properties in Soave are equipped to host 2.0 guests.
Soave Airbnb Booking Patterns (2026): Available vs. Booked Days
Available Days Distribution
Booked Days Distribution
Booking Pattern Insights for Soave
- The most common availability pattern in Soave falls within the 271-366 days range, representing 63.6% of listings. This suggests many properties have significant open periods on their calendars.
- Approximately 90.9% of listings show high availability (181+ days open annually), indicating potential for increased bookings or specific owner usage patterns.
- For booked days, the 31-90 days range is most frequent in Soave (45.5%), reflecting common guest stay durations or potential owner blocking patterns.
- A notable 9.1% of properties secure long booking periods (181+ days booked per year), highlighting successful long-term rental strategies or significant owner usage.
Soave Airbnb Minimum Stay Requirements Analysis
Distribution of Listings by Minimum Night Requirement
1 Night
17 listings
38.6% of total
2 Nights
3 listings
6.8% of total
7-29 Nights
9 listings
20.5% of total
30+ Nights
15 listings
34.1% of total
Key Insights
- The most prevalent minimum stay requirement in Soave is 1 Night, adopted by 38.6% of listings. This highlights the market's preference for shorter, flexible bookings.
- A significant segment (34.1%) caters to monthly stays (30+ nights) in Soave, pointing to opportunities in the extended-stay market.
Recommendations
- Align with the market by considering a 1 Night minimum stay, as 38.6% of Soave hosts use this setting.
- Explore offering discounts for stays of 30+ nights to attract the 34.1% of the market seeking extended stays.
- Adjust minimum nights based on seasonality – potentially shorter during low season and longer during peak demand periods in Soave.
Soave Airbnb Cancellation Policy Trends Analysis (2026)
Super Strict 30 Days
1 listings
2.3% of total
Super Strict 60 Days
2 listings
4.5% of total
Flexible
10 listings
22.7% of total
Moderate
21 listings
47.7% of total
Firm
8 listings
18.2% of total
Strict
2 listings
4.5% of total
Cancellation Policy Insights for Soave
- The prevailing Airbnb cancellation policy trend in Soave is Moderate, used by 47.7% of listings.
- The market strongly favors guest-friendly terms, with 70.4% of listings offering Flexible or Moderate policies. This suggests guests in Soave may expect booking flexibility.
- Strict cancellation policies are quite rare (4.5%), potentially making listings with this policy less competitive unless justified by high demand or property type.
Recommendations for Hosts
- Consider adopting a Moderate policy to align with the 47.7% market standard in Soave.
- Using a Strict policy might deter some guests, as only 4.5% of listings use it. Evaluate if potential revenue protection outweighs possible lower booking rates.
- Regularly review your cancellation policy against competitors and market demand shifts in Soave.
Soave STR Booking Lead Time Analysis (2026)
Average Booking Lead Time by Month
Booking Lead Time Insights for Soave
- The overall average booking lead time for vacation rentals in Soave is 81 days.
- Guests book furthest in advance for stays during January (average 119 days), likely coinciding with peak travel demand or local events.
- The shortest booking windows occur for stays in March (average 32 days), indicating more last-minute travel plans during this time.
- Seasonally, Summer (76 days avg.) sees the longest lead times, while Spring (53 days avg.) has the shortest, reflecting typical travel planning cycles.
Recommendations for Hosts
- Use the overall average lead time (81 days) as a baseline for your pricing and availability strategy in Soave.
- For January stays, consider implementing length-of-stay discounts or slightly higher rates for bookings made less than 119 days out to capitalize on advance planning.
- Target marketing efforts for the Summer season well in advance (at least 76 days) to capture early planners.
- Monitor your own booking lead times against these Soave averages to identify opportunities for dynamic pricing adjustments.
Popular & Essential Airbnb Amenities in Soave (2026)
Amenity Prevalence
Amenity Insights for Soave
- Essential amenities in Soave that guests expect include: Air conditioning, Wifi. Lacking these (any) could significantly impact bookings.
- Popular amenities like TV, Heating, Hair dryer are common but not universal. Offering these can provide a competitive edge.
Recommendations for Hosts
- Ensure your listing includes all essential amenities for Soave: Air conditioning, Wifi.
- Prioritize adding missing essentials: Wifi.
- Consider adding popular differentiators like TV or Heating to increase appeal.
- Highlight unique or less common amenities you offer (e.g., hot tub, dedicated workspace, EV charger) in your listing description and photos.
- Regularly check competitor amenities in Soave to stay competitive.
Soave Airbnb Guest Demographics & Profile Analysis (2026)
Guest Profile Summary for Soave
- The typical guest profile for Airbnb in Soave consists of predominantly international visitors (76%), with top international origins including Germany, typically belonging to the Post-2000s (Gen Z/Alpha) group (50%), primarily speaking English or Italian.
- Domestic travelers account for 24.0% of guests.
- Key international markets include Italy (24%) and Germany (20.2%).
- Top languages spoken are English (40.9%) followed by Italian (13.9%).
- A significant demographic segment is the Post-2000s (Gen Z/Alpha) group, representing 50% of guests.
Recommendations for Hosts
- Focus marketing internationally, particularly towards travelers from Germany.
- Tailor amenities and listing descriptions to appeal to the dominant Post-2000s (Gen Z/Alpha) demographic (e.g., highlight fast WiFi, smart home features, local guides).
- Highlight unique local experiences or amenities relevant to the primary guest profile.
- Consider seasonal promotions aligned with peak travel times for key origin markets.
Nearby Short-Term Rental Market Comparison
How does the Soave Airbnb market stack up against its neighbors? Compare key performance metrics like average monthly revenue, ADR, and occupancy rates in surrounding areas to understand the broader regional STR landscape.
| Market | Active Properties | Monthly Revenue | Daily Rate | Avg. Occupancy |
|---|---|---|---|---|
| Sankt Pankraz - San Pancrazio | 12 | $6,528 | $633.65 | 29% |
| Urtijëi - St. Ulrich in Gröden - Ortisei | 172 | $5,054 | $718.33 | 41% |
| Kiens - Chienes | 17 | $3,715 | $377.77 | 48% |
| Cortina d'Ampezzo | 309 | $3,646 | $474.12 | 40% |
| Moos in Passeier - Moso in Passiria | 20 | $3,504 | $547.30 | 23% |
| Colle Santa Lucia | 21 | $3,353 | $248.56 | 46% |
| Lajen - Laion | 96 | $3,338 | $548.27 | 36% |
| Merano | 28 | $3,288 | $309.99 | 46% |
| Santa Cristina Gherdëina - St. Christina in Gröden - Santa Cristina Valgardena | 102 | $3,264 | $408.62 | 41% |
| Großkirchheim | 12 | $3,022 | $273.94 | 39% |