San Michele al Tagliamento Airbnb Market Analysis 2025: Short Term Rental Data & Vacation Rental Statistics in Veneto, Italy
Is Airbnb profitable in San Michele al Tagliamento in 2025? Explore comprehensive Airbnb analytics for San Michele al Tagliamento, Veneto, Italy to uncover income potential. This 2025 STR market report for San Michele al Tagliamento, based on AirROI data from November 2024 to October 2025, reveals key trends in the market of 513 active listings.
Whether you're considering an Airbnb investment in San Michele al Tagliamento, optimizing your existing vacation rental, or exploring rental arbitrage opportunities, understanding the San Michele al Tagliamento Airbnb data is crucial. Navigating the high regulation landscape is key to maximizing your short term rental income potential. Let's dive into the specifics.
Key San Michele al Tagliamento Airbnb Performance Metrics Overview
Monthly Airbnb Revenue Variations & Income Potential in San Michele al Tagliamento (2025)
Understanding the monthly revenue variations for Airbnb listings in San Michele al Tagliamento is key to maximizing your short term rental income potential. Seasonality significantly impacts earnings. Our analysis, based on data from the past 12 months, shows that the peak revenue month for STRs in San Michele al Tagliamento is typically March, while February often presents the lowest earnings, highlighting opportunities for strategic pricing adjustments during shoulder and low seasons. Explore the typical Airbnb income in San Michele al Tagliamento across different performance tiers:
- Best-in-class properties (Top 10%) achieve $4,800+ monthly, often utilizing dynamic pricing and superior guest experiences.
- Strong performing properties (Top 25%) earn $2,164 or more, indicating effective management and desirable locations/amenities.
- Typical properties (Median) generate around $1,157 per month, representing the average market performance.
- Entry-level properties (Bottom 25%) see earnings around $539, often with potential for optimization.
Average Monthly Airbnb Earnings Trend in San Michele al Tagliamento
San Michele al Tagliamento Airbnb Occupancy Rate Trends (2025)
Maximize your bookings by understanding the San Michele al Tagliamento STR occupancy trends. Seasonal demand shifts significantly influence how often properties are booked. Typically, Julysees the highest demand (peak season occupancy), while February experiences the lowest (low season). Effective strategies, like adjusting minimum stays or offering promotions, can boost occupancy during slower periods. Here's how different property tiers perform in San Michele al Tagliamento:
- Best-in-class properties (Top 10%) achieve 59%+ occupancy, indicating high desirability and potentially optimized availability.
- Strong performing properties (Top 25%) maintain 45% or higher occupancy, suggesting good market fit and guest satisfaction.
- Typical properties (Median) have an occupancy rate around 24%.
- Entry-level properties (Bottom 25%) average 12% occupancy, potentially facing higher vacancy.
Average Monthly Occupancy Rate Trend in San Michele al Tagliamento
Average Daily Rate (ADR) Airbnb Trends in San Michele al Tagliamento (2025)
Effective short term rental pricing strategy in San Michele al Tagliamento involves understanding monthly ADR fluctuations. The Average Daily Rate (ADR) for Airbnb in San Michele al Tagliamento typically peaks in January and dips lowest during September. Leveraging Airbnb dynamic pricing tools or strategies based on this seasonality can significantly boost revenue. Here's a look at the typical nightly rates achieved:
- Best-in-class properties (Top 10%) command rates of $740+ per night, often due to premium features or locations.
- Strong performing properties (Top 25%) achieve nightly rates of $368 or more.
- Typical properties (Median) charge around $157 per night.
- Entry-level properties (Bottom 25%) earn around $109 per night.
Average Daily Rate (ADR) Trend by Month in San Michele al Tagliamento
Get Live San Michele al Tagliamento Market Intelligence 👇

Explore Real-time Analytics
Airbnb Seasonality Analysis & Trends in San Michele al Tagliamento (2025)
Peak Season (March, July, August)
- Revenue averages $3,592 per month
- Occupancy rates average 49.6%
- Daily rates average $295
Shoulder Season
- Revenue averages $1,801 per month
- Occupancy maintains around 27.2%
- Daily rates hold near $290
Low Season (January, February, November)
- Revenue drops to average $910 per month
- Occupancy decreases to average 16.2%
- Daily rates adjust to average $409
Seasonality Insights for San Michele al Tagliamento
- The Airbnb seasonality in San Michele al Tagliamento shows highly seasonal trends requiring careful strategy. While the sections above show seasonal averages, it's also insightful to look at the extremes:
- During the high season, the absolute peak month showcases San Michele al Tagliamento's highest earning potential, with monthly revenues capable of climbing to $4,343, occupancy reaching a high of 52.0%, and ADRs peaking at $427.
- Conversely, the slowest single month of the year, typically falling within the low season, marks the market's lowest point. In this month, revenue might dip to $775, occupancy could drop to 15.7%, and ADRs may adjust down to $209.
- Understanding both the seasonal averages and these monthly peaks and troughs in revenue, occupancy, and ADR is crucial for maximizing your Airbnb profit potential in San Michele al Tagliamento.
Seasonal Strategies for Maximizing Profit
- Peak Season: Maximize revenue through premium pricing and potentially longer minimum stays. Ensure high availability.
- Low Season: Offer competitive pricing, special promotions (e.g., extended stay discounts), and flexible cancellation policies. Target off-season travelers like remote workers or budget-conscious guests.
- Shoulder Seasons: Implement dynamic pricing that balances peak and low rates. Target weekend travelers or specific events. Offer slightly more flexible terms than peak season.
- Regularly analyze your own performance against these San Michele al Tagliamento seasonality benchmarks and adjust your pricing and availability strategy accordingly.
Best Areas for Airbnb Investment in San Michele al Tagliamento (2025)
Exploring the top neighborhoods for short-term rentals in San Michele al Tagliamento? This section highlights key areas, outlining why they are attractive for hosts and guests, along with notable local attractions. Consider these locations based on your target guest profile and investment strategy.
| Neighborhood / Area | Why Host Here? (Target Guests & Appeal) | Key Attractions & Landmarks |
|---|---|---|
| Bibione | Bibione is a renowned beach resort known for its beautiful sandy shores and family-friendly atmosphere. It's a prime location for tourists looking for a relaxing beach vacation, attracting families and couples during the summer months. | Bibione Beach, Thermal Spa, Luna Park Adriatico, Val Grande Park, Bibione Lighthouse |
| Lignano Sabbiadoro | Lignano Sabbiadoro offers a vibrant atmosphere with a wide range of entertainment options, making it a popular destination for beachgoers. Its lively promenade and numerous restaurants cater to both families and young people. | Lignano Beach, Aquasplash Water Park, Parco Zoo Punta Verde, Lignano Sabbiadoro Port, Lignano Beach Promenade |
| Portogruaro | Portogruaro is a charming medieval town that attracts tourists interested in history and culture. Its picturesque architecture and serene ambiance make it ideal for those seeking a unique Italian experience. | Portogruaro's Historical Centre, The Church of Sant'Agnese, Palazzo comunale, Museo Nazionale Concordiese, Piazza della Repubblica |
| Caorle | Caorle is a picturesque coastal town with beautiful beaches and a rich history. It offers a mix of relaxation and cultural experiences, appealing to a diverse range of visitors. | Caorle Beach, The Historic Centre of Caorle, The Cathedral of Caorle, Duna Verde Beach, Casoni di Caorle |
| Venezia | Venice is a world-renowned city known for its canals, historic architecture, and art. It attracts millions of tourists each year, making it a prime location for Airbnb hosts looking for high demand. | St. Mark's Basilica, Rialto Bridge, Venice Canals, Doge's Palace, Murano Island |
| Trieste | Trieste is a port city with a rich cultural heritage and beautiful seaside views. It's less touristy than Venice, making it an appealing choice for those looking for a unique experience in Northern Italy. | Piazza Unità d'Italia, Castello di Miramare, Teatro Romano, Canal Grande, Cattedrale di San Giusto |
| Grado | Grado is known for its beautiful beaches and historical sites, attracting families and beach lovers. Its relaxing environment makes it ideal for vacation rentals. | Grado Beach, Basilica di Santa Eufemia, Isola di Barbana, Lagoon of Grado, Grado Historical Center |
| Santo Stefano di Cadore | This charming mountain village is perfect for those looking for a nature getaway, attracting outdoor enthusiasts year-round with its access to hiking trails and scenic landscapes. | Dolomiti di Sesto, Trekking in the Dolomites, Lake Santa Caterina, Museo della Grande Guerra, Ski Resorts of the Dolomites |
Understanding Airbnb License Requirements & STR Laws in San Michele al Tagliamento (2025)
Yes, San Michele al Tagliamento, Veneto, Italy enforces high STR regulations. Obtaining a license and ensuring compliance is almost certainly required according to current 2025 STR laws. Always verify the latest short term rental regulations and Airbnb license requirements directly with local government authorities for San Michele al Tagliamento to ensure full compliance before hosting.
(Source: AirROI data, 2025, based on 69% licensed listings)
Top Performing Airbnb Properties in San Michele al Tagliamento (2025)
Benchmark your potential! Explore examples of top-performing Airbnb properties in San Michele al Tagliamentobased on Trailing Twelve Month (TTM) revenue. Analyze their characteristics, revenue, occupancy rate, and ADR to understand what drives success in this market.
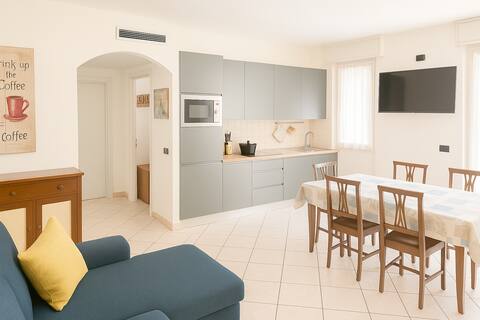
Large apartment in the heart of the center
Entire Place • 2 bedrooms
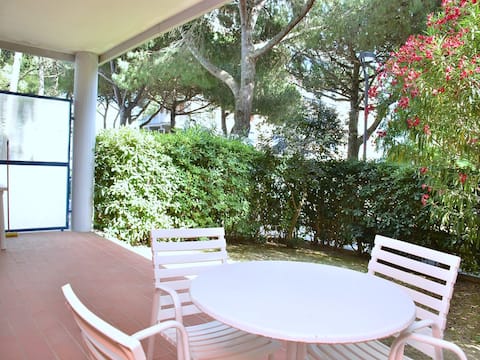
Cozy apartment with private garden near the beach
Entire Place • 1 bedroom
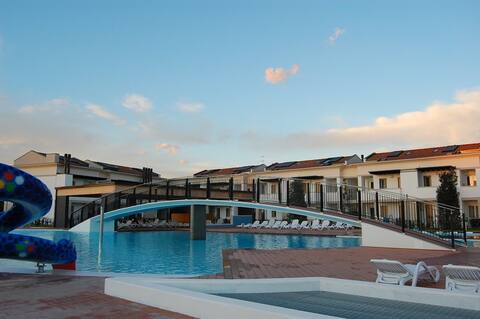
Comfortable flat in a residence with swimming pool
Entire Place • 3 bedrooms
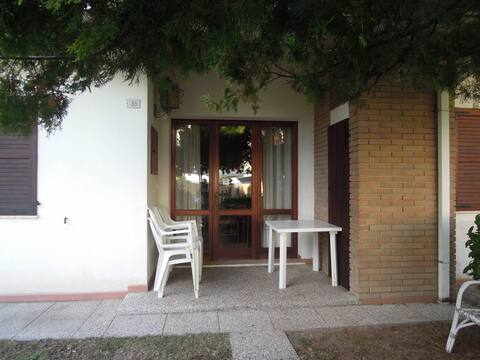
Peaceful Villa with garden surrounded by nature
Entire Place • 2 bedrooms
Casa & Ristorante Merano Bibione Beach
Entire Place • 1 bedroom

Recently built apartment with swimming pool and ga
Entire Place • 1 bedroom
Note: Performance varies based on location, size, amenities, seasonality, and management quality. Data reflects the past 12 months.
Top Performing Airbnb Hosts in San Michele al Tagliamento (2025)
Learn from the best! This table showcases top-performing Airbnb hosts in San Michele al Tagliamento based on the number of properties managed and estimated total revenue over the past year. Analyze their scale and performance metrics.
| Host Name | Properties | Grossing Revenue | Stay Reviews | Avg Rating |
|---|---|---|---|---|
| Beahost Rentals | 206 | $2,086,532 | 350 | 3.97/5.0 |
| Alessandra - Interhome | 48 | $199,272 | 245 | 4.02/5.0 |
| Marco | 1 | $129,805 | 11 | 4.82/5.0 |
| Paola | 46 | $119,456 | 80 | 4.54/5.0 |
| Beahost Rentals | 24 | $101,248 | 65 | 4.03/5.0 |
| Enrico | 6 | $99,266 | 87 | 4.67/5.0 |
| Giove Daiana | 7 | $66,088 | 102 | 4.54/5.0 |
| Aurora | 3 | $63,975 | 78 | 4.67/5.0 |
| Orsi | 3 | $58,439 | 10 | 4.75/5.0 |
| Holidu | 3 | $44,745 | 7 | 4.40/5.0 |
Analyzing the strategies of top hosts, such as their property selection, pricing, and guest communication, can offer valuable lessons for optimizing your own Airbnb operations in San Michele al Tagliamento.
Dive Deeper: Advanced San Michele al Tagliamento STR Market Data (2025)
Ready to unlock more insights? AirROI provides access to advanced metrics and comprehensive Airbnb data for San Michele al Tagliamento. Explore detailed analytics beyond this report to refine your investment strategy, optimize pricing, and maximize your vacation rental profits.
Explore Advanced MetricsSan Michele al Tagliamento Short-Term Rental Market Composition (2025): Property & Room Types
Room Type Distribution
Property Type Distribution
Market Composition Insights for San Michele al Tagliamento
- The San Michele al Tagliamento Airbnb market composition is heavily skewed towards Entire Home/Apt listings, which make up 99.2% of the 513 active rentals. This indicates strong guest preference for privacy and space.
- Looking at the property type distribution in San Michele al Tagliamento, Apartment/Condo properties are the most common (88.9%), reflecting the local real estate landscape.
- Smaller segments like hotel/boutique, outdoor/unique (combined 0.4%) offer potential for unique stay experiences.
San Michele al Tagliamento Airbnb Room Capacity Analysis (2025): Bedroom Distribution
Distribution of Listings by Number of Bedrooms
Room Capacity Insights for San Michele al Tagliamento
- The dominant room capacity in San Michele al Tagliamento is 2 bedrooms listings, making up 44.2% of the market. This suggests a strong demand for properties suitable for couples or solo travelers.
- Together, 2 bedrooms and 1 bedroom properties represent 80.3% of the active Airbnb listings in San Michele al Tagliamento, indicating a high concentration in these sizes.
San Michele al Tagliamento Vacation Rental Guest Capacity Trends (2025)
Distribution of Listings by Guest Capacity
Guest Capacity Insights for San Michele al Tagliamento
- The most common guest capacity trend in San Michele al Tagliamento vacation rentals is listings accommodating 6 guests (27.9%). This suggests the primary traveler segment is likely larger groups.
- Properties designed for 6 guests and 5 guests dominate the San Michele al Tagliamento STR market, accounting for 52.1% of listings.
- 46.8% of properties accommodate 6+ guests, serving the market segment for larger families or group travel in San Michele al Tagliamento.
- On average, properties in San Michele al Tagliamento are equipped to host 5.4 guests.
San Michele al Tagliamento Airbnb Booking Patterns (2025): Available vs. Booked Days
Available Days Distribution
Booked Days Distribution
Booking Pattern Insights for San Michele al Tagliamento
- The most common availability pattern in San Michele al Tagliamento falls within the 271-366 days range, representing 86.5% of listings. This suggests many properties have significant open periods on their calendars.
- Approximately 99.2% of listings show high availability (181+ days open annually), indicating potential for increased bookings or specific owner usage patterns.
- For booked days, the 1-30 days range is most frequent in San Michele al Tagliamento (55%), reflecting common guest stay durations or potential owner blocking patterns.
- A notable 1.0% of properties secure long booking periods (181+ days booked per year), highlighting successful long-term rental strategies or significant owner usage.
San Michele al Tagliamento Airbnb Minimum Stay Requirements Analysis
Distribution of Listings by Minimum Night Requirement
1 Night
20 listings
3.9% of total
2 Nights
12 listings
2.3% of total
3 Nights
11 listings
2.2% of total
4-6 Nights
70 listings
13.7% of total
7-29 Nights
237 listings
46.4% of total
30+ Nights
161 listings
31.5% of total
Key Insights
- The most prevalent minimum stay requirement in San Michele al Tagliamento is 7-29 Nights, adopted by 46.4% of listings. This highlights the market's preference for shorter, flexible bookings.
- Very short stays (1-2 nights) are less common (6.2%), suggesting hosts prefer slightly longer bookings to optimize turnover.
- A significant segment (31.5%) caters to monthly stays (30+ nights) in San Michele al Tagliamento, pointing to opportunities in the extended-stay market.
Recommendations
- Align with the market by considering a 7-29 Nights minimum stay, as 46.4% of San Michele al Tagliamento hosts use this setting.
- If feasible, allowing 1-night stays, especially midweek or during low season, could capture last-minute bookings, as only 3.9% currently do.
- Explore offering discounts for stays of 30+ nights to attract the 31.5% of the market seeking extended stays.
- Adjust minimum nights based on seasonality – potentially shorter during low season and longer during peak demand periods in San Michele al Tagliamento.
San Michele al Tagliamento Airbnb Cancellation Policy Trends Analysis (2025)
Super Strict 30 Days
301 listings
59.1% of total
Super Strict 60 Days
6 listings
1.2% of total
Limited
1 listings
0.2% of total
Flexible
14 listings
2.8% of total
Moderate
92 listings
18.1% of total
Firm
32 listings
6.3% of total
Strict
63 listings
12.4% of total
Cancellation Policy Insights for San Michele al Tagliamento
- The prevailing Airbnb cancellation policy trend in San Michele al Tagliamento is Super Strict 30 Days, used by 59.1% of listings.
- There's a relatively balanced mix between guest-friendly (20.9%) and stricter (18.7%) policies, offering choices for different guest needs.
Recommendations for Hosts
- Consider adopting a Super Strict 30 Days policy to align with the 59.1% market standard in San Michele al Tagliamento.
- Using a Strict policy might deter some guests, as only 12.4% of listings use it. Evaluate if potential revenue protection outweighs possible lower booking rates.
- Regularly review your cancellation policy against competitors and market demand shifts in San Michele al Tagliamento.
San Michele al Tagliamento STR Booking Lead Time Analysis (2025)
Average Booking Lead Time by Month
Booking Lead Time Insights for San Michele al Tagliamento
- The overall average booking lead time for vacation rentals in San Michele al Tagliamento is 75 days.
- Guests book furthest in advance for stays during October (average 135 days), likely coinciding with peak travel demand or local events.
- The shortest booking windows occur for stays in December (average 37 days), indicating more last-minute travel plans during this time.
- Seasonally, Fall (87 days avg.) sees the longest lead times, while Winter (45 days avg.) has the shortest, reflecting typical travel planning cycles.
Recommendations for Hosts
- Use the overall average lead time (75 days) as a baseline for your pricing and availability strategy in San Michele al Tagliamento.
- For October stays, consider implementing length-of-stay discounts or slightly higher rates for bookings made less than 135 days out to capitalize on advance planning.
- Target marketing efforts for the Fall season well in advance (at least 87 days) to capture early planners.
- Monitor your own booking lead times against these San Michele al Tagliamento averages to identify opportunities for dynamic pricing adjustments.
Popular & Essential Airbnb Amenities in San Michele al Tagliamento (2025)
Amenity Prevalence
Amenity Insights for San Michele al Tagliamento
- Essential amenities in San Michele al Tagliamento that guests expect include: TV. Lacking these (this) could significantly impact bookings.
- Popular amenities like Refrigerator, Air conditioning, Kitchen are common but not universal. Offering these can provide a competitive edge.
Recommendations for Hosts
- Ensure your listing includes all essential amenities for San Michele al Tagliamento: TV.
- Prioritize adding missing essentials: TV.
- Consider adding popular differentiators like Refrigerator or Air conditioning to increase appeal.
- Highlight unique or less common amenities you offer (e.g., hot tub, dedicated workspace, EV charger) in your listing description and photos.
- Regularly check competitor amenities in San Michele al Tagliamento to stay competitive.
San Michele al Tagliamento Airbnb Guest Demographics & Profile Analysis (2025)
Guest Profile Summary for San Michele al Tagliamento
- The typical guest profile for Airbnb in San Michele al Tagliamento consists of predominantly international visitors (70%), with top international origins including Germany, typically belonging to the Post-2000s (Gen Z/Alpha) group (50%), primarily speaking English or German.
- Domestic travelers account for 30.2% of guests.
- Key international markets include Italy (30.2%) and Germany (29.1%).
- Top languages spoken are English (35.8%) followed by German (22.5%).
- A significant demographic segment is the Post-2000s (Gen Z/Alpha) group, representing 50% of guests.
Recommendations for Hosts
- Focus marketing internationally, particularly towards travelers from Germany.
- Tailor amenities and listing descriptions to appeal to the dominant Post-2000s (Gen Z/Alpha) demographic (e.g., highlight fast WiFi, smart home features, local guides).
- Highlight unique local experiences or amenities relevant to the primary guest profile.
- Consider seasonal promotions aligned with peak travel times for key origin markets.
Nearby Short-Term Rental Market Comparison
How does the San Michele al Tagliamento Airbnb market stack up against its neighbors? Compare key performance metrics like average monthly revenue, ADR, and occupancy rates in surrounding areas to understand the broader regional STR landscape.
| Market | Active Properties | Monthly Revenue | Daily Rate | Avg. Occupancy |
|---|---|---|---|---|
| Cortina d'Ampezzo | 286 | $3,909 | $430.26 | 41% |
| Colle Santa Lucia | 20 | $3,502 | $237.34 | 47% |
| Großkirchheim | 12 | $3,173 | $282.64 | 41% |
| Venice | 6,522 | $3,122 | $256.10 | 46% |
| Vodo di Cadore | 41 | $2,917 | $261.90 | 44% |
| Zagore | 13 | $2,820 | $451.26 | 33% |
| Bad Sankt Leonhard im Lavanttal | 35 | $2,710 | $300.20 | 36% |
| San Martino d'Alpago | 14 | $2,705 | $203.34 | 38% |
| Sveti Bartul | 18 | $2,690 | $359.49 | 39% |
| Welsberg-Taisten - Monguelfo-Tesido | 29 | $2,625 | $271.12 | 45% |