Caorle Airbnb Market Analysis 2026: Short Term Rental Data & Vacation Rental Statistics in Veneto, Italy
Is Airbnb profitable in Caorle in 2026? Explore comprehensive Airbnb analytics for Caorle, Veneto, Italy to uncover income potential. This 2026 STR market report for Caorle, based on AirROI data from February 2025 to January 2026, reveals key trends in the market of 284 active listings.
Whether you're considering an Airbnb investment in Caorle, optimizing your existing vacation rental, or exploring rental arbitrage opportunities, understanding the Caorle Airbnb data is crucial. Navigating the high regulation landscape is key to maximizing your short term rental income potential. Let's dive into the specifics.
Key Caorle Airbnb Performance Metrics Overview
Monthly Airbnb Revenue Variations & Income Potential in Caorle (2026)
Understanding the monthly revenue variations for Airbnb listings in Caorle is key to maximizing your short term rental income potential. Seasonality significantly impacts earnings. Our analysis, based on data from the past 12 months, shows that the peak revenue month for STRs in Caorle is typically August, while January often presents the lowest earnings, highlighting opportunities for strategic pricing adjustments during shoulder and low seasons. Explore the typical Airbnb income in Caorle across different performance tiers:
- Best-in-class properties (Top 10%) achieve $3,519+ monthly, often utilizing dynamic pricing and superior guest experiences.
- Strong performing properties (Top 25%) earn $2,292 or more, indicating effective management and desirable locations/amenities.
- Typical properties (Median) generate around $1,310 per month, representing the average market performance.
- Entry-level properties (Bottom 25%) see earnings around $637, often with potential for optimization.
Average Monthly Airbnb Earnings Trend in Caorle
Caorle Airbnb Occupancy Rate Trends (2026)
Maximize your bookings by understanding the Caorle STR occupancy trends. Seasonal demand shifts significantly influence how often properties are booked. Typically, Augustsees the highest demand (peak season occupancy), while January experiences the lowest (low season). Effective strategies, like adjusting minimum stays or offering promotions, can boost occupancy during slower periods. Here's how different property tiers perform in Caorle:
- Best-in-class properties (Top 10%) achieve 63%+ occupancy, indicating high desirability and potentially optimized availability.
- Strong performing properties (Top 25%) maintain 44% or higher occupancy, suggesting good market fit and guest satisfaction.
- Typical properties (Median) have an occupancy rate around 26%.
- Entry-level properties (Bottom 25%) average 13% occupancy, potentially facing higher vacancy.
Average Monthly Occupancy Rate Trend in Caorle
Average Daily Rate (ADR) Airbnb Trends in Caorle (2026)
Effective short term rental pricing strategy in Caorle involves understanding monthly ADR fluctuations. The Average Daily Rate (ADR) for Airbnb in Caorle typically peaks in January and dips lowest during May. Leveraging Airbnb dynamic pricing tools or strategies based on this seasonality can significantly boost revenue. Here's a look at the typical nightly rates achieved:
- Best-in-class properties (Top 10%) command rates of $685+ per night, often due to premium features or locations.
- Strong performing properties (Top 25%) achieve nightly rates of $251 or more.
- Typical properties (Median) charge around $157 per night.
- Entry-level properties (Bottom 25%) earn around $116 per night.
Average Daily Rate (ADR) Trend by Month in Caorle
Get Live Caorle Market Intelligence 👇

Explore Real-time Analytics
Airbnb Seasonality Analysis & Trends in Caorle (2026)
Peak Season (August, July, June)
- Revenue averages $3,273 per month
- Occupancy rates average 52.5%
- Daily rates average $207
Shoulder Season
- Revenue averages $1,478 per month
- Occupancy maintains around 27.9%
- Daily rates hold near $264
Low Season (January, February, December)
- Revenue drops to average $717 per month
- Occupancy decreases to average 16.0%
- Daily rates adjust to average $327
Seasonality Insights for Caorle
- The Airbnb seasonality in Caorle shows highly seasonal trends requiring careful strategy. While the sections above show seasonal averages, it's also insightful to look at the extremes:
- During the high season, the absolute peak month showcases Caorle's highest earning potential, with monthly revenues capable of climbing to $3,937, occupancy reaching a high of 61.3%, and ADRs peaking at $363.
- Conversely, the slowest single month of the year, typically falling within the low season, marks the market's lowest point. In this month, revenue might dip to $576, occupancy could drop to 11.6%, and ADRs may adjust down to $188.
- Understanding both the seasonal averages and these monthly peaks and troughs in revenue, occupancy, and ADR is crucial for maximizing your Airbnb profit potential in Caorle.
Seasonal Strategies for Maximizing Profit
- Peak Season: Maximize revenue through premium pricing and potentially longer minimum stays. Ensure high availability.
- Low Season: Offer competitive pricing, special promotions (e.g., extended stay discounts), and flexible cancellation policies. Target off-season travelers like remote workers or budget-conscious guests.
- Shoulder Seasons: Implement dynamic pricing that balances peak and low rates. Target weekend travelers or specific events. Offer slightly more flexible terms than peak season.
- Regularly analyze your own performance against these Caorle seasonality benchmarks and adjust your pricing and availability strategy accordingly.
Best Areas for Airbnb Investment in Caorle (2026)
Exploring the top neighborhoods for short-term rentals in Caorle? This section highlights key areas, outlining why they are attractive for hosts and guests, along with notable local attractions. Consider these locations based on your target guest profile and investment strategy.
| Neighborhood / Area | Why Host Here? (Target Guests & Appeal) | Key Attractions & Landmarks |
|---|---|---|
| Centro Storico | The historic center of Caorle, known for its charming narrow streets, traditional shops, and restaurants. Attracts tourists looking to experience the authentic atmosphere of the town. | St. Stephen's Cathedral, Caorle Archaeological Museum, Piazza Vescovado, Church of the Blessed Virgin of the Angel, The Bell Tower |
| Spiaggia di Ponente | Popular beach area with golden sands and family-friendly amenities. Ideal for tourists seeking sun, sea, and relaxation. | Golden beach, Nearby restaurants and cafes, Beach clubs, Relaxing beach promenades |
| Spiaggia di Levante | Another beautiful beachfront area known for its lively atmosphere and proximity to water sports activities. Great for attracting younger crowds and families alike. | Water sports facilities, Beach bars, Playground areas, Walking paths along the coast |
| Porto Pescatori | A picturesque fishing port that offers a glimpse into Caorle's maritime heritage. Attractive for those interested in seafood dining and local culture. | Fishing boats, Seafood restaurants, Walking trails around the port |
| Viale Santa Margherita | A vibrant avenue that features a range of shops, cafes, and accommodations. Popular with tourists looking for convenience and a lively atmosphere. | Shopping options, Ice cream parlors, Local eateries, Close to the beach |
| Lido Altanea | A modern resort area that offers a range of facilities and attractions for families and young couples. Known for its well-planned layout and activities. | Water parks, Promenades, Family-friendly resorts, Playgrounds |
| Camping Caorle | A well-established camping area that attracts tourists seeking a more rustic and natural experience close to the beach. Ideal for budget travelers. | Camping facilities, Natural scenery, Outdoor activities |
| Città Giardino | A charming residential area known for its green spaces and tranquil atmosphere, perfect for visitors looking for a more relaxed stay while still being close to the attractions. | Parks and gardens, Residential charm, Peaceful surroundings |
Understanding Airbnb License Requirements & STR Laws in Caorle (2026)
Yes, Caorle, Veneto, Italy enforces high STR regulations. Obtaining a license and ensuring compliance is almost certainly required according to current 2026 STR laws. Always verify the latest short term rental regulations and Airbnb license requirements directly with local government authorities for Caorle to ensure full compliance before hosting.
(Source: AirROI data, 2026, based on 93% licensed listings)
Top Performing Airbnb Properties in Caorle (2026)
Benchmark your potential! Explore examples of top-performing Airbnb properties in Caorlebased on Trailing Twelve Month (TTM) revenue. Analyze their characteristics, revenue, occupancy rate, and ADR to understand what drives success in this market.
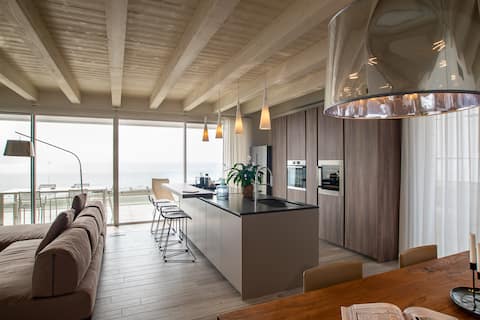
Sea front penthouse with solarium, pool and garage
Entire Place • 3 bedrooms
Villa Duna Verde
Entire Place • 3 bedrooms

Luxury Villa for 10 people 1h from Venice
Entire Place • 4 bedrooms

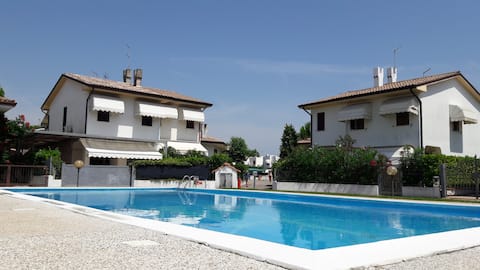
Resort Gabbiani with Pool
Entire Place • 2 bedrooms
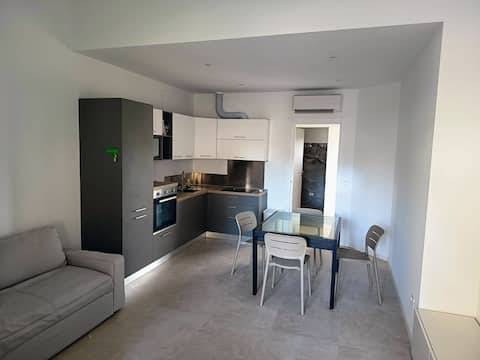
New apartment in the center 2025
Entire Place • 7 bedrooms
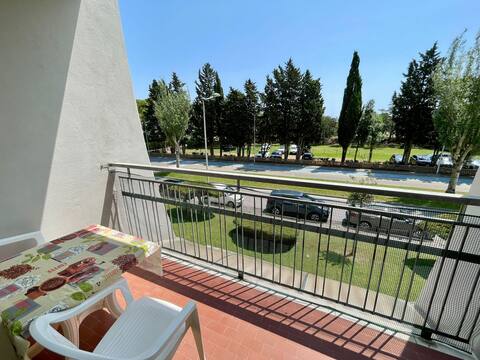
Comfortable flat for four-Beahost
Entire Place • 1 bedroom
Note: Performance varies based on location, size, amenities, seasonality, and management quality. Data reflects the past 12 months.
Top Performing Airbnb Hosts in Caorle (2026)
Learn from the best! This table showcases top-performing Airbnb hosts in Caorle based on the number of properties managed and estimated total revenue over the past year. Analyze their scale and performance metrics.
| Host Name | Properties | Grossing Revenue | Stay Reviews | Avg Rating |
|---|---|---|---|---|
| Beahost Rentals | 28 | $206,816 | 41 | 4.56/5.0 |
| Emilio | 3 | $159,767 | 86 | 4.73/5.0 |
| Agenzia Arcatours | 19 | $129,743 | 141 | 4.59/5.0 |
| Beahost Rentals | 19 | $114,527 | 71 | 4.43/5.0 |
| Alex | 6 | $94,599 | 135 | 4.95/5.0 |
| Fiorella | 7 | $84,051 | 287 | 4.70/5.0 |
| Sandro | 4 | $77,449 | 95 | 4.72/5.0 |
| Giove Mirca | 8 | $73,892 | 89 | 4.44/5.0 |
| Giuliana | 3 | $69,748 | 102 | 4.90/5.0 |
| Marco & Elia | 1 | $68,378 | 76 | 4.95/5.0 |
Analyzing the strategies of top hosts, such as their property selection, pricing, and guest communication, can offer valuable lessons for optimizing your own Airbnb operations in Caorle.
Dive Deeper: Advanced Caorle STR Market Data (2026)
Ready to unlock more insights? AirROI provides access to advanced metrics and comprehensive Airbnb data for Caorle. Explore detailed analytics beyond this report to refine your investment strategy, optimize pricing, and maximize your vacation rental profits.
Explore Advanced MetricsCaorle Short-Term Rental Market Composition (2026): Property & Room Types
Room Type Distribution
Property Type Distribution
Market Composition Insights for Caorle
- The Caorle Airbnb market composition is heavily skewed towards Entire Home/Apt listings, which make up 97.2% of the 284 active rentals. This indicates strong guest preference for privacy and space.
- Looking at the property type distribution in Caorle, Apartment/Condo properties are the most common (78.2%), reflecting the local real estate landscape.
- Houses represent a significant 19% portion, catering likely to families or larger groups.
- Smaller segments like outdoor/unique, others, hotel/boutique (combined 2.9%) offer potential for unique stay experiences.
Caorle Airbnb Room Capacity Analysis (2026): Bedroom Distribution
Distribution of Listings by Number of Bedrooms
Room Capacity Insights for Caorle
- The dominant room capacity in Caorle is 1 bedroom listings, making up 43.7% of the market. This suggests a strong demand for properties suitable for couples or solo travelers.
- Together, 1 bedroom and 2 bedrooms properties represent 82.8% of the active Airbnb listings in Caorle, indicating a high concentration in these sizes.
- Listings with 3+ bedrooms (9.9%) represent a smaller niche, potentially indicating an underserved market for larger group accommodations in Caorle.
Caorle Vacation Rental Guest Capacity Trends (2026)
Distribution of Listings by Guest Capacity
Guest Capacity Insights for Caorle
- The most common guest capacity trend in Caorle vacation rentals is listings accommodating 4 guests (33.5%). This suggests the primary traveler segment is likely small families or groups.
- Properties designed for 4 guests and 6 guests dominate the Caorle STR market, accounting for 59.9% of listings.
- 34.5% of properties accommodate 6+ guests, serving the market segment for larger families or group travel in Caorle.
- On average, properties in Caorle are equipped to host 4.8 guests.
Caorle Airbnb Booking Patterns (2026): Available vs. Booked Days
Available Days Distribution
Booked Days Distribution
Booking Pattern Insights for Caorle
- The most common availability pattern in Caorle falls within the 271-366 days range, representing 75.7% of listings. This suggests many properties have significant open periods on their calendars.
- Approximately 98.6% of listings show high availability (181+ days open annually), indicating potential for increased bookings or specific owner usage patterns.
- For booked days, the 31-90 days range is most frequent in Caorle (43.3%), reflecting common guest stay durations or potential owner blocking patterns.
- A notable 1.4% of properties secure long booking periods (181+ days booked per year), highlighting successful long-term rental strategies or significant owner usage.
Caorle Airbnb Minimum Stay Requirements Analysis
Distribution of Listings by Minimum Night Requirement
1 Night
15 listings
5.3% of total
2 Nights
18 listings
6.3% of total
3 Nights
9 listings
3.2% of total
4-6 Nights
58 listings
20.4% of total
7-29 Nights
78 listings
27.5% of total
30+ Nights
106 listings
37.3% of total
Key Insights
- The most prevalent minimum stay requirement in Caorle is 30+ Nights, adopted by 37.3% of listings. This highlights the market's preference for longer commitments.
- Very short stays (1-2 nights) are less common (11.6%), suggesting hosts prefer slightly longer bookings to optimize turnover.
- A significant segment (37.3%) caters to monthly stays (30+ nights) in Caorle, pointing to opportunities in the extended-stay market.
Recommendations
- Align with the market by considering a 30+ Nights minimum stay, as 37.3% of Caorle hosts use this setting.
- If feasible, allowing 1-night stays, especially midweek or during low season, could capture last-minute bookings, as only 5.3% currently do.
- Explore offering discounts for stays of 30+ nights to attract the 37.3% of the market seeking extended stays.
- Adjust minimum nights based on seasonality – potentially shorter during low season and longer during peak demand periods in Caorle.
Caorle Airbnb Cancellation Policy Trends Analysis (2026)
Super Strict 60 Days
9 listings
3.2% of total
Super Strict 30 Days
45 listings
15.9% of total
Limited
3 listings
1.1% of total
Flexible
43 listings
15.2% of total
Moderate
87 listings
30.7% of total
Firm
78 listings
27.6% of total
Strict
18 listings
6.4% of total
Cancellation Policy Insights for Caorle
- The prevailing Airbnb cancellation policy trend in Caorle is Moderate, used by 30.7% of listings.
- There's a relatively balanced mix between guest-friendly (45.9%) and stricter (34.0%) policies, offering choices for different guest needs.
- Strict cancellation policies are quite rare (6.4%), potentially making listings with this policy less competitive unless justified by high demand or property type.
Recommendations for Hosts
- Consider adopting a Moderate policy to align with the 30.7% market standard in Caorle.
- Using a Strict policy might deter some guests, as only 6.4% of listings use it. Evaluate if potential revenue protection outweighs possible lower booking rates.
- Regularly review your cancellation policy against competitors and market demand shifts in Caorle.
Caorle STR Booking Lead Time Analysis (2026)
Average Booking Lead Time by Month
Booking Lead Time Insights for Caorle
- The overall average booking lead time for vacation rentals in Caorle is 75 days.
- Guests book furthest in advance for stays during August (average 106 days), likely coinciding with peak travel demand or local events.
- The shortest booking windows occur for stays in February (average 19 days), indicating more last-minute travel plans during this time.
- Seasonally, Summer (92 days avg.) sees the longest lead times, while Winter (31 days avg.) has the shortest, reflecting typical travel planning cycles.
Recommendations for Hosts
- Use the overall average lead time (75 days) as a baseline for your pricing and availability strategy in Caorle.
- For August stays, consider implementing length-of-stay discounts or slightly higher rates for bookings made less than 106 days out to capitalize on advance planning.
- Target marketing efforts for the Summer season well in advance (at least 92 days) to capture early planners.
- Monitor your own booking lead times against these Caorle averages to identify opportunities for dynamic pricing adjustments.
Popular & Essential Airbnb Amenities in Caorle (2026)
Amenity Prevalence
Amenity Insights for Caorle
- Essential amenities in Caorle that guests expect include: Air conditioning, TV. Lacking these (any) could significantly impact bookings.
- Popular amenities like Kitchen, Washer, Refrigerator are common but not universal. Offering these can provide a competitive edge.
- Warning: Wifi is not universally provided but is considered essential globally. Ensure reliable Wifi is offered.
Recommendations for Hosts
- Ensure your listing includes all essential amenities for Caorle: Air conditioning, TV.
- Prioritize adding missing essentials: Air conditioning, TV.
- Consider adding popular differentiators like Kitchen or Washer to increase appeal.
- Highlight unique or less common amenities you offer (e.g., hot tub, dedicated workspace, EV charger) in your listing description and photos.
- Regularly check competitor amenities in Caorle to stay competitive.
Caorle Airbnb Guest Demographics & Profile Analysis (2026)
Guest Profile Summary for Caorle
- The typical guest profile for Airbnb in Caorle consists of predominantly international visitors (78%), with top international origins including Italy, typically belonging to the Post-2000s (Gen Z/Alpha) group (50%), primarily speaking English or German.
- Domestic travelers account for 21.8% of guests.
- Key international markets include Germany (27%) and Italy (21.8%).
- Top languages spoken are English (36.6%) followed by German (22.4%).
- A significant demographic segment is the Post-2000s (Gen Z/Alpha) group, representing 50% of guests.
Recommendations for Hosts
- Focus marketing internationally, particularly towards travelers from Italy.
- Tailor amenities and listing descriptions to appeal to the dominant Post-2000s (Gen Z/Alpha) demographic (e.g., highlight fast WiFi, smart home features, local guides).
- Highlight unique local experiences or amenities relevant to the primary guest profile.
- Consider seasonal promotions aligned with peak travel times for key origin markets.
Nearby Short-Term Rental Market Comparison
How does the Caorle Airbnb market stack up against its neighbors? Compare key performance metrics like average monthly revenue, ADR, and occupancy rates in surrounding areas to understand the broader regional STR landscape.
| Market | Active Properties | Monthly Revenue | Daily Rate | Avg. Occupancy |
|---|---|---|---|---|
| Sankt Pankraz - San Pancrazio | 12 | $6,528 | $633.65 | 29% |
| Urtijëi - St. Ulrich in Gröden - Ortisei | 172 | $5,054 | $718.33 | 41% |
| Kiens - Chienes | 17 | $3,715 | $377.77 | 48% |
| Cortina d'Ampezzo | 309 | $3,646 | $474.12 | 40% |
| Moos in Passeier - Moso in Passiria | 20 | $3,504 | $547.30 | 23% |
| Colle Santa Lucia | 21 | $3,353 | $248.56 | 46% |
| Selina | 15 | $3,339 | $351.70 | 49% |
| Lajen - Laion | 96 | $3,338 | $548.27 | 36% |
| Merano | 28 | $3,288 | $309.99 | 46% |
| Santa Cristina Gherdëina - St. Christina in Gröden - Santa Cristina Valgardena | 102 | $3,264 | $408.62 | 41% |