Perugia Airbnb Market Analysis 2026: Short Term Rental Data & Vacation Rental Statistics in Umbria, Italy
Is Airbnb profitable in Perugia in 2026? Explore comprehensive Airbnb analytics for Perugia, Umbria, Italy to uncover income potential. This 2026 STR market report for Perugia, based on AirROI data from February 2025 to January 2026, reveals key trends in the market of 907 active listings.
Whether you're considering an Airbnb investment in Perugia, optimizing your existing vacation rental, or exploring rental arbitrage opportunities, understanding the Perugia Airbnb data is crucial. Navigating the high regulation landscape is key to maximizing your short term rental income potential. Let's dive into the specifics.
Key Perugia Airbnb Performance Metrics Overview
Monthly Airbnb Revenue Variations & Income Potential in Perugia (2026)
Understanding the monthly revenue variations for Airbnb listings in Perugia is key to maximizing your short term rental income potential. Seasonality significantly impacts earnings. Our analysis, based on data from the past 12 months, shows that the peak revenue month for STRs in Perugia is typically July, while January often presents the lowest earnings, highlighting opportunities for strategic pricing adjustments during shoulder and low seasons. Explore the typical Airbnb income in Perugia across different performance tiers:
- Best-in-class properties (Top 10%) achieve $3,342+ monthly, often utilizing dynamic pricing and superior guest experiences.
- Strong performing properties (Top 25%) earn $2,149 or more, indicating effective management and desirable locations/amenities.
- Typical properties (Median) generate around $1,221 per month, representing the average market performance.
- Entry-level properties (Bottom 25%) see earnings around $584, often with potential for optimization.
Average Monthly Airbnb Earnings Trend in Perugia
Perugia Airbnb Occupancy Rate Trends (2026)
Maximize your bookings by understanding the Perugia STR occupancy trends. Seasonal demand shifts significantly influence how often properties are booked. Typically, Aprilsees the highest demand (peak season occupancy), while January experiences the lowest (low season). Effective strategies, like adjusting minimum stays or offering promotions, can boost occupancy during slower periods. Here's how different property tiers perform in Perugia:
- Best-in-class properties (Top 10%) achieve 78%+ occupancy, indicating high desirability and potentially optimized availability.
- Strong performing properties (Top 25%) maintain 61% or higher occupancy, suggesting good market fit and guest satisfaction.
- Typical properties (Median) have an occupancy rate around 36%.
- Entry-level properties (Bottom 25%) average 18% occupancy, potentially facing higher vacancy.
Average Monthly Occupancy Rate Trend in Perugia
Average Daily Rate (ADR) Airbnb Trends in Perugia (2026)
Effective short term rental pricing strategy in Perugia involves understanding monthly ADR fluctuations. The Average Daily Rate (ADR) for Airbnb in Perugia typically peaks in September and dips lowest during February. Leveraging Airbnb dynamic pricing tools or strategies based on this seasonality can significantly boost revenue. Here's a look at the typical nightly rates achieved:
- Best-in-class properties (Top 10%) command rates of $243+ per night, often due to premium features or locations.
- Strong performing properties (Top 25%) achieve nightly rates of $150 or more.
- Typical properties (Median) charge around $104 per night.
- Entry-level properties (Bottom 25%) earn around $76 per night.
Average Daily Rate (ADR) Trend by Month in Perugia
Get Live Perugia Market Intelligence 👇

Explore Real-time Analytics
Airbnb Seasonality Analysis & Trends in Perugia (2026)
Peak Season (July, August, April)
- Revenue averages $2,260 per month
- Occupancy rates average 48.1%
- Daily rates average $152
Shoulder Season
- Revenue averages $1,734 per month
- Occupancy maintains around 40.7%
- Daily rates hold near $151
Low Season (January, February, November)
- Revenue drops to average $1,096 per month
- Occupancy decreases to average 30.6%
- Daily rates adjust to average $148
Seasonality Insights for Perugia
- The Airbnb seasonality in Perugia shows highly seasonal trends requiring careful strategy. While the sections above show seasonal averages, it's also insightful to look at the extremes:
- During the high season, the absolute peak month showcases Perugia's highest earning potential, with monthly revenues capable of climbing to $2,465, occupancy reaching a high of 50.1%, and ADRs peaking at $158.
- Conversely, the slowest single month of the year, typically falling within the low season, marks the market's lowest point. In this month, revenue might dip to $892, occupancy could drop to 22.1%, and ADRs may adjust down to $138.
- Understanding both the seasonal averages and these monthly peaks and troughs in revenue, occupancy, and ADR is crucial for maximizing your Airbnb profit potential in Perugia.
Seasonal Strategies for Maximizing Profit
- Peak Season: Maximize revenue through premium pricing and potentially longer minimum stays. Ensure high availability.
- Low Season: Offer competitive pricing, special promotions (e.g., extended stay discounts), and flexible cancellation policies. Target off-season travelers like remote workers or budget-conscious guests.
- Shoulder Seasons: Implement dynamic pricing that balances peak and low rates. Target weekend travelers or specific events. Offer slightly more flexible terms than peak season.
- Regularly analyze your own performance against these Perugia seasonality benchmarks and adjust your pricing and availability strategy accordingly.
Best Areas for Airbnb Investment in Perugia (2026)
Exploring the top neighborhoods for short-term rentals in Perugia? This section highlights key areas, outlining why they are attractive for hosts and guests, along with notable local attractions. Consider these locations based on your target guest profile and investment strategy.
| Neighborhood / Area | Why Host Here? (Target Guests & Appeal) | Key Attractions & Landmarks |
|---|---|---|
| Centro Storico | The historic center of Perugia is known for its medieval architecture, beautiful squares, and rich cultural heritage. It attracts tourists looking to explore art, history, and local cuisine. | Piazza IV Novembre, Rocca Paolina, Galleria Nazionale dell'Umbria, Perugia Cathedral, Fontana Maggiore, Etruscan Arch |
| Piazza Italia | A vibrant area filled with shops, cafes, and restaurants. It serves as a hub for both locals and tourists, making it a great place for short-term rentals. | Piazza Italia, Corso Vannucci, Università per Stranieri di Perugia, Teatro Morlacchi, Palazzo dei Priori |
| San Pietro | A charming neighborhood known for its picturesque views and proximity to green spaces. Appeals to travelers looking for a quieter stay close to nature and culture. | San Pietro Abbey, Giardini Carducci, Perugia Golf Club, Etruscan Ruins, Parks and gardens |
| Monteluce | A trendy area with a growing number of restaurants and bars. Popular among younger crowds and offers a mix of modern and traditional Italian lifestyles. | Monteluce district, San Giovanni Battista Church, local eateries, art galleries, nightlife venues |
| Via dei Priori | This street is filled with unique shops and historical sites. It's a favorite among tourists who want to experience local shopping and culture. | Palazzo dei Priori, Chiesa di San Francesco al Prato, Local artisan shops, Gastronomy experiences |
| Corso Cavour | A bustling street that offers direct access to shopping, dining, and cultural sites in Perugia. Ideal for visitors looking to be in the heart of the action. | Local markets, Dining spots, Art boutiques, Cultural landmarks |
| Piazza della Repubblica | A central square that acts as a meeting point for locals and tourists alike. It's surrounded by cafes and historical buildings, making it a vibrant place to stay. | Cafes, Shops, Theatre, Historic buildings, Events and markets |
| Siete Santi | A quiet neighborhood that offers a more local experience. It's slightly away from the tourist centers but provides easy access to transport and local life. | San Sante Church, Local bakeries, Residential parks, Community events |
Understanding Airbnb License Requirements & STR Laws in Perugia (2026)
Yes, Perugia, Umbria, Italy enforces high STR regulations. Obtaining a license and ensuring compliance is almost certainly required according to current 2026 STR laws. Always verify the latest short term rental regulations and Airbnb license requirements directly with local government authorities for Perugia to ensure full compliance before hosting.
(Source: AirROI data, 2026, based on 88% licensed listings)
Top Performing Airbnb Properties in Perugia (2026)
Benchmark your potential! Explore examples of top-performing Airbnb properties in Perugiabased on Trailing Twelve Month (TTM) revenue. Analyze their characteristics, revenue, occupancy rate, and ADR to understand what drives success in this market.
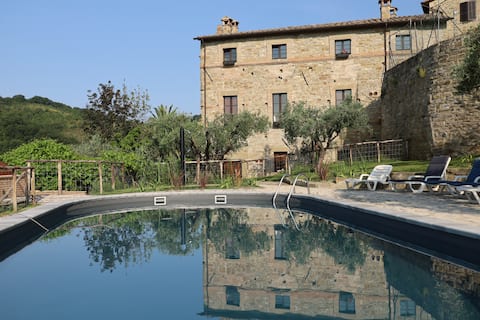
Castel Secolo XIII Holiday/Events Pool 31 places
Entire Place • 10 bedrooms

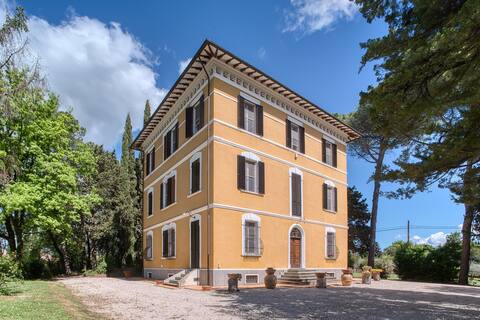
Villa Capanne - Magnificent Umbrian Villa
Entire Place • 6 bedrooms
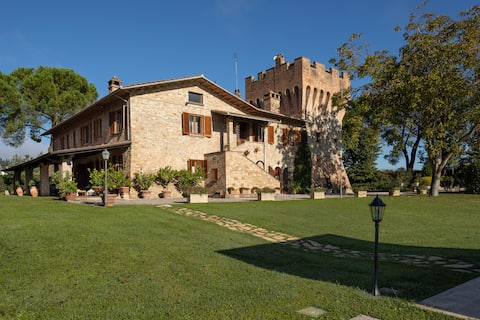
Palazzetto Bovini
Entire Place • 10 bedrooms

Angeli by Interhome
Entire Place • 9 bedrooms
Torre Villa Belvedere Luxury & Relax with pool
Entire Place • 3 bedrooms

Villa Antorrita Farmhouse, infinity pool, ensuite
Entire Place • 5 bedrooms
Note: Performance varies based on location, size, amenities, seasonality, and management quality. Data reflects the past 12 months.
Top Performing Airbnb Hosts in Perugia (2026)
Learn from the best! This table showcases top-performing Airbnb hosts in Perugia based on the number of properties managed and estimated total revenue over the past year. Analyze their scale and performance metrics.
| Host Name | Properties | Grossing Revenue | Stay Reviews | Avg Rating |
|---|---|---|---|---|
| Marco, Marco, Michele | 21 | $758,319 | 1417 | 4.79/5.0 |
| GuestHost - Welcome To Italy | 28 | $415,649 | 340 | 4.19/5.0 |
| Riccardo | 22 | $365,106 | 1340 | 4.76/5.0 |
| Dante | 15 | $273,092 | 180 | 4.85/5.0 |
| Michele | 8 | $235,484 | 63 | 4.48/5.0 |
| Samuele | 9 | $232,398 | 200 | 4.85/5.0 |
| Gloria Gagliardoni | 8 | $181,166 | 82 | 4.97/5.0 |
| Riccardo | 11 | $180,803 | 74 | 4.88/5.0 |
| Marco | 4 | $173,753 | 118 | 4.99/5.0 |
| Giuseppe | 4 | $170,873 | 83 | 4.96/5.0 |
Analyzing the strategies of top hosts, such as their property selection, pricing, and guest communication, can offer valuable lessons for optimizing your own Airbnb operations in Perugia.
Dive Deeper: Advanced Perugia STR Market Data (2026)
Ready to unlock more insights? AirROI provides access to advanced metrics and comprehensive Airbnb data for Perugia. Explore detailed analytics beyond this report to refine your investment strategy, optimize pricing, and maximize your vacation rental profits.
Explore Advanced MetricsPerugia Short-Term Rental Market Composition (2026): Property & Room Types
Room Type Distribution
Property Type Distribution
Market Composition Insights for Perugia
- The Perugia Airbnb market composition is heavily skewed towards Entire Home/Apt listings, which make up 82% of the 907 active rentals. This indicates strong guest preference for privacy and space.
- Looking at the property type distribution in Perugia, Apartment/Condo properties are the most common (71.2%), reflecting the local real estate landscape.
- Houses represent a significant 16.9% portion, catering likely to families or larger groups.
- The presence of 6.7% Hotel/Boutique listings indicates integration with traditional hospitality.
- Smaller segments like outdoor/unique, others (combined 5.2%) offer potential for unique stay experiences.
Perugia Airbnb Room Capacity Analysis (2026): Bedroom Distribution
Distribution of Listings by Number of Bedrooms
Room Capacity Insights for Perugia
- The dominant room capacity in Perugia is 1 bedroom listings, making up 44.7% of the market. This suggests a strong demand for properties suitable for couples or solo travelers.
- Together, 1 bedroom and 2 bedrooms properties represent 70.9% of the active Airbnb listings in Perugia, indicating a high concentration in these sizes.
Perugia Vacation Rental Guest Capacity Trends (2026)
Distribution of Listings by Guest Capacity
Guest Capacity Insights for Perugia
- The most common guest capacity trend in Perugia vacation rentals is listings accommodating 4 guests (27.6%). This suggests the primary traveler segment is likely small families or groups.
- Properties designed for 4 guests and 2 guests dominate the Perugia STR market, accounting for 51.5% of listings.
- 17.0% of properties accommodate 6+ guests, serving the market segment for larger families or group travel in Perugia.
- On average, properties in Perugia are equipped to host 3.4 guests.
Perugia Airbnb Booking Patterns (2026): Available vs. Booked Days
Available Days Distribution
Booked Days Distribution
Booking Pattern Insights for Perugia
- The most common availability pattern in Perugia falls within the 271-366 days range, representing 50.2% of listings. This suggests many properties have significant open periods on their calendars.
- Approximately 82.4% of listings show high availability (181+ days open annually), indicating potential for increased bookings or specific owner usage patterns.
- For booked days, the 91-180 days range is most frequent in Perugia (32.2%), reflecting common guest stay durations or potential owner blocking patterns.
- A notable 18.8% of properties secure long booking periods (181+ days booked per year), highlighting successful long-term rental strategies or significant owner usage.
Perugia Airbnb Minimum Stay Requirements Analysis
Distribution of Listings by Minimum Night Requirement
1 Night
230 listings
25.4% of total
2 Nights
241 listings
26.6% of total
3 Nights
27 listings
3% of total
4-6 Nights
40 listings
4.4% of total
7-29 Nights
61 listings
6.7% of total
30+ Nights
307 listings
33.9% of total
Key Insights
- The most prevalent minimum stay requirement in Perugia is 30+ Nights, adopted by 33.9% of listings. This highlights the market's preference for longer commitments.
- A significant segment (33.9%) caters to monthly stays (30+ nights) in Perugia, pointing to opportunities in the extended-stay market.
Recommendations
- Align with the market by considering a 30+ Nights minimum stay, as 33.9% of Perugia hosts use this setting.
- If feasible, allowing 1-night stays, especially midweek or during low season, could capture last-minute bookings, as only 25.4% currently do.
- Explore offering discounts for stays of 30+ nights to attract the 33.9% of the market seeking extended stays.
- Adjust minimum nights based on seasonality – potentially shorter during low season and longer during peak demand periods in Perugia.
Perugia Airbnb Cancellation Policy Trends Analysis (2026)
Limited
9 listings
1% of total
Super Strict 60 Days
25 listings
2.8% of total
Super Strict 30 Days
11 listings
1.2% of total
Flexible
333 listings
36.8% of total
Moderate
401 listings
44.4% of total
Firm
104 listings
11.5% of total
Strict
21 listings
2.3% of total
Cancellation Policy Insights for Perugia
- The prevailing Airbnb cancellation policy trend in Perugia is Moderate, used by 44.4% of listings.
- The market strongly favors guest-friendly terms, with 81.2% of listings offering Flexible or Moderate policies. This suggests guests in Perugia may expect booking flexibility.
- Strict cancellation policies are quite rare (2.3%), potentially making listings with this policy less competitive unless justified by high demand or property type.
Recommendations for Hosts
- Consider adopting a Moderate policy to align with the 44.4% market standard in Perugia.
- Using a Strict policy might deter some guests, as only 2.3% of listings use it. Evaluate if potential revenue protection outweighs possible lower booking rates.
- Regularly review your cancellation policy against competitors and market demand shifts in Perugia.
Perugia STR Booking Lead Time Analysis (2026)
Average Booking Lead Time by Month
Booking Lead Time Insights for Perugia
- The overall average booking lead time for vacation rentals in Perugia is 52 days.
- Guests book furthest in advance for stays during April (average 68 days), likely coinciding with peak travel demand or local events.
- The shortest booking windows occur for stays in February (average 28 days), indicating more last-minute travel plans during this time.
- Seasonally, Summer (60 days avg.) sees the longest lead times, while Winter (33 days avg.) has the shortest, reflecting typical travel planning cycles.
Recommendations for Hosts
- Use the overall average lead time (52 days) as a baseline for your pricing and availability strategy in Perugia.
- For April stays, consider implementing length-of-stay discounts or slightly higher rates for bookings made less than 68 days out to capitalize on advance planning.
- Target marketing efforts for the Summer season well in advance (at least 60 days) to capture early planners.
- Monitor your own booking lead times against these Perugia averages to identify opportunities for dynamic pricing adjustments.
Popular & Essential Airbnb Amenities in Perugia (2026)
Amenity Prevalence
Amenity Insights for Perugia
- Essential amenities in Perugia that guests expect include: Heating. Lacking these (this) could significantly impact bookings.
- Popular amenities like Wifi, Hair dryer, Hot water are common but not universal. Offering these can provide a competitive edge.
- Warning: Wifi is not universally provided but is considered essential globally. Ensure reliable Wifi is offered.
Recommendations for Hosts
- Ensure your listing includes all essential amenities for Perugia: Heating.
- Prioritize adding missing essentials: Heating.
- Consider adding popular differentiators like Wifi or Hair dryer to increase appeal.
- Highlight unique or less common amenities you offer (e.g., hot tub, dedicated workspace, EV charger) in your listing description and photos.
- Regularly check competitor amenities in Perugia to stay competitive.
Perugia Airbnb Guest Demographics & Profile Analysis (2026)
Guest Profile Summary for Perugia
- The typical guest profile for Airbnb in Perugia consists of predominantly international visitors (68%), with top international origins including United States, typically belonging to the Post-2000s (Gen Z/Alpha) group (50%), primarily speaking English or Italian.
- Domestic travelers account for 31.7% of guests.
- Key international markets include Italy (31.7%) and United States (14.7%).
- Top languages spoken are English (38.2%) followed by Italian (20.3%).
- A significant demographic segment is the Post-2000s (Gen Z/Alpha) group, representing 50% of guests.
Recommendations for Hosts
- Focus marketing internationally, particularly towards travelers from United States.
- Tailor amenities and listing descriptions to appeal to the dominant Post-2000s (Gen Z/Alpha) demographic (e.g., highlight fast WiFi, smart home features, local guides).
- Highlight unique local experiences or amenities relevant to the primary guest profile.
- Consider seasonal promotions aligned with peak travel times for key origin markets.
Nearby Short-Term Rental Market Comparison
How does the Perugia Airbnb market stack up against its neighbors? Compare key performance metrics like average monthly revenue, ADR, and occupancy rates in surrounding areas to understand the broader regional STR landscape.
| Market | Active Properties | Monthly Revenue | Daily Rate | Avg. Occupancy |
|---|---|---|---|---|
| Tignano | 12 | $4,160 | $366.92 | 45% |
| Celleno | 13 | $4,041 | $594.80 | 28% |
| Marciano della Chiana | 17 | $3,823 | $545.25 | 35% |
| Buonconvento | 60 | $3,186 | $440.58 | 43% |
| Collevecchio | 14 | $3,140 | $334.97 | 40% |
| Radda in Chianti | 94 | $3,098 | $361.57 | 39% |
| Palombara Sabina | 15 | $2,914 | $309.11 | 38% |
| Impruneta | 146 | $2,887 | $297.45 | 40% |
| Lastra a Signa | 96 | $2,760 | $311.91 | 43% |
| Florence | 10,496 | $2,755 | $225.30 | 49% |