Rio Airbnb Market Analysis 2026: Short Term Rental Data & Vacation Rental Statistics in Tuscany, Italy
Is Airbnb profitable in Rio in 2026? Explore comprehensive Airbnb analytics for Rio, Tuscany, Italy to uncover income potential. This 2026 STR market report for Rio, based on AirROI data from February 2025 to January 2026, reveals key trends in the niche market of 32 active listings.
Whether you're considering an Airbnb investment in Rio, optimizing your existing vacation rental, or exploring rental arbitrage opportunities, understanding the Rio Airbnb data is crucial. Navigating the high regulation landscape is key to maximizing your short term rental income potential. Let's dive into the specifics.
Key Rio Airbnb Performance Metrics Overview
Monthly Airbnb Revenue Variations & Income Potential in Rio (2026)
Understanding the monthly revenue variations for Airbnb listings in Rio is key to maximizing your short term rental income potential. Seasonality significantly impacts earnings. Our analysis, based on data from the past 12 months, shows that the peak revenue month for STRs in Rio is typically August, while February often presents the lowest earnings, highlighting opportunities for strategic pricing adjustments during shoulder and low seasons. Explore the typical Airbnb income in Rio across different performance tiers:
- Best-in-class properties (Top 10%) achieve $10,834+ monthly, often utilizing dynamic pricing and superior guest experiences.
- Strong performing properties (Top 25%) earn $4,776 or more, indicating effective management and desirable locations/amenities.
- Typical properties (Median) generate around $1,444 per month, representing the average market performance.
- Entry-level properties (Bottom 25%) see earnings around $986, often with potential for optimization.
Average Monthly Airbnb Earnings Trend in Rio
Rio Airbnb Occupancy Rate Trends (2026)
Maximize your bookings by understanding the Rio STR occupancy trends. Seasonal demand shifts significantly influence how often properties are booked. Typically, Augustsees the highest demand (peak season occupancy), while February experiences the lowest (low season). Effective strategies, like adjusting minimum stays or offering promotions, can boost occupancy during slower periods. Here's how different property tiers perform in Rio:
- Best-in-class properties (Top 10%) achieve 77%+ occupancy, indicating high desirability and potentially optimized availability.
- Strong performing properties (Top 25%) maintain 55% or higher occupancy, suggesting good market fit and guest satisfaction.
- Typical properties (Median) have an occupancy rate around 29%.
- Entry-level properties (Bottom 25%) average 17% occupancy, potentially facing higher vacancy.
Average Monthly Occupancy Rate Trend in Rio
Average Daily Rate (ADR) Airbnb Trends in Rio (2026)
Effective short term rental pricing strategy in Rio involves understanding monthly ADR fluctuations. The Average Daily Rate (ADR) for Airbnb in Rio typically peaks in July and dips lowest during December. Leveraging Airbnb dynamic pricing tools or strategies based on this seasonality can significantly boost revenue. Here's a look at the typical nightly rates achieved:
- Best-in-class properties (Top 10%) command rates of $471+ per night, often due to premium features or locations.
- Strong performing properties (Top 25%) achieve nightly rates of $262 or more.
- Typical properties (Median) charge around $176 per night.
- Entry-level properties (Bottom 25%) earn around $120 per night.
Average Daily Rate (ADR) Trend by Month in Rio
Get Live Rio Market Intelligence 👇

Explore Real-time Analytics
Airbnb Seasonality Analysis & Trends in Rio (2026)
Peak Season (August, March, July)
- Revenue averages $6,810 per month
- Occupancy rates average 58.1%
- Daily rates average $280
Shoulder Season
- Revenue averages $4,355 per month
- Occupancy maintains around 37.3%
- Daily rates hold near $258
Low Season (January, February, December)
- Revenue drops to average $1,532 per month
- Occupancy decreases to average 18.5%
- Daily rates adjust to average $243
Seasonality Insights for Rio
- The Airbnb seasonality in Rio shows highly seasonal trends requiring careful strategy. While the sections above show seasonal averages, it's also insightful to look at the extremes:
- During the high season, the absolute peak month showcases Rio's highest earning potential, with monthly revenues capable of climbing to $7,711, occupancy reaching a high of 65.2%, and ADRs peaking at $286.
- Conversely, the slowest single month of the year, typically falling within the low season, marks the market's lowest point. In this month, revenue might dip to $290, occupancy could drop to 7.1%, and ADRs may adjust down to $227.
- Understanding both the seasonal averages and these monthly peaks and troughs in revenue, occupancy, and ADR is crucial for maximizing your Airbnb profit potential in Rio.
Seasonal Strategies for Maximizing Profit
- Peak Season: Maximize revenue through premium pricing and potentially longer minimum stays. Ensure high availability.
- Low Season: Offer competitive pricing, special promotions (e.g., extended stay discounts), and flexible cancellation policies. Target off-season travelers like remote workers or budget-conscious guests.
- Shoulder Seasons: Implement dynamic pricing that balances peak and low rates. Target weekend travelers or specific events. Offer slightly more flexible terms than peak season.
- Regularly analyze your own performance against these Rio seasonality benchmarks and adjust your pricing and availability strategy accordingly.
Best Areas for Airbnb Investment in Rio (2026)
Exploring the top neighborhoods for short-term rentals in Rio? This section highlights key areas, outlining why they are attractive for hosts and guests, along with notable local attractions. Consider these locations based on your target guest profile and investment strategy.
| Neighborhood / Area | Why Host Here? (Target Guests & Appeal) | Key Attractions & Landmarks |
|---|---|---|
| Santa Teresa | Charming and bohemian neighborhood known for its artistic vibe and beautiful views. Popular among tourists looking for a unique and local experience, with great access to beaches and cultural sites. | Parque das Ruínas, Selarón Steps, Lapa Arches, Nightlife in Lapa, Museu Chácara do Céu |
| Copacabana | Famous beach neighborhood known for its iconic beach, lively atmosphere, and bustling nightlife. It attracts countless tourists and locals year-round, making it a prime spot for Airbnb hosting. | Copacabana Beach, Fort Copacabana, Avenida Atlântica, Rodrigo de Freitas Lagoon, Mureta da Urca |
| Ipanema | A glamorous and affluent beach neighborhood featured in the classic song 'The Girl from Ipanema'. It's known for its upscale shops, restaurants, and vibrant nightlife, making it highly desirable for tourists. | Ipanema Beach, Farme de Amoedo Street, General Osório Square, Leblon Beach, Arpoador |
| Leblon | One of the most upscale neighborhoods in Rio, attracting wealthy visitors and long-term guests. With its high-end boutiques and fine dining, it’s ideal for luxury rentals. | Leblon Beach, Shopping Leblon, Jardim de Alah, Praia do Leblon, Cinelandia |
| Botafogo | A mix of urban life and beach vibes, Botafogo is popular with students and young professionals. The stunning views of Sugarloaf Mountain make it a picturesque hosting area. | Botafogo Beach, Shopping Botafogo, Praia do Flamengo, Museu do Indio, Sugarloaf Mountain |
| Glória | A historic area with colonial architecture and a vibrant arts scene. It attracts cultural tourists and those interested in experiencing traditional Rio life. | Cinelandia, Teatro Municipal, Museum of Modern Art, Glória Church, Rua da Glória |
| Lapa | Known for its nightlife, Lapa is a cultural hub filled with bars, samba clubs, and street festivals. Perfect for those wanting to experience Rio's vibrant party scene. | Selarón Steps, Lapa Arches, Samba clubs, Circo Voador, Street parties |
| Botafogo Cove | A hidden gem with stunning views of the bay and Sugarloaf Mountain. Offers a quieter ambiance while being close to all the attractions, appealing to both families and couples. | Botafogo Cove, Sugarloaf Mountain, Flamengo Park, Cove's restaurants, Praia do Flamengo |
Understanding Airbnb License Requirements & STR Laws in Rio (2026)
Yes, Rio, Tuscany, Italy enforces high STR regulations. Obtaining a license and ensuring compliance is almost certainly required according to current 2026 STR laws. Always verify the latest short term rental regulations and Airbnb license requirements directly with local government authorities for Rio to ensure full compliance before hosting.
(Source: AirROI data, 2026, based on 88% licensed listings)
Top Performing Airbnb Properties in Rio (2026)
Benchmark your potential! Explore examples of top-performing Airbnb properties in Riobased on Trailing Twelve Month (TTM) revenue. Analyze their characteristics, revenue, occupancy rate, and ADR to understand what drives success in this market.
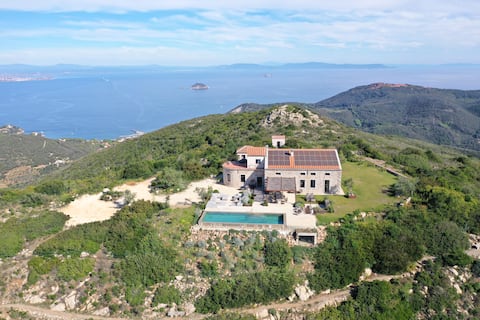
"Semaforo di Monte Grosso" (Monte Grosso Semaphore) / Monte Grosso, Elba
Entire Place • 6 bedrooms

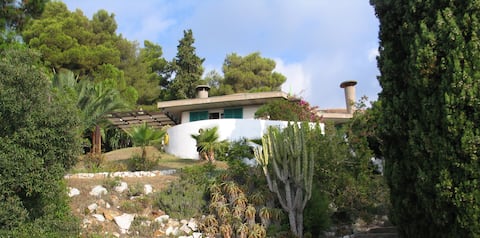
Captain's House | Monte Grosso, Elba
Entire Place • 1 bedroom

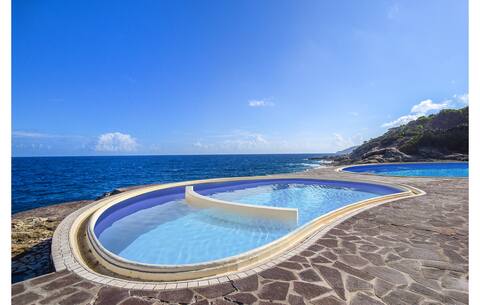
Pink villa with pool/Elba Island
Entire Place • 2 bedrooms
3 bedroom nice apartment in Rio Marina
Entire Place • 3 bedrooms
Large Villa with Garden, Capo d'Arco, Elba Island
Entire Place • 3 bedrooms

Ortano Mare by Interhome
Entire Place • 1 bedroom
Note: Performance varies based on location, size, amenities, seasonality, and management quality. Data reflects the past 12 months.
Top Performing Airbnb Hosts in Rio (2026)
Learn from the best! This table showcases top-performing Airbnb hosts in Rio based on the number of properties managed and estimated total revenue over the past year. Analyze their scale and performance metrics.
| Host Name | Properties | Grossing Revenue | Stay Reviews | Avg Rating |
|---|---|---|---|---|
| Michael | 2 | $369,140 | 107 | 5.00/5.0 |
| Marta | 3 | $51,083 | 52 | 4.83/5.0 |
| Loredana | 2 | $45,064 | 101 | 4.88/5.0 |
| Novasol | 1 | $33,519 | 2 | Not Rated |
| Sabine - Interhome | 1 | $26,061 | 2 | Not Rated |
| Lorena | 2 | $25,698 | 114 | 4.83/5.0 |
| Delores - Belvilla | 2 | $17,490 | 5 | 4.75/5.0 |
| Fabio | 1 | $16,048 | 24 | 4.42/5.0 |
| Ambra - Belvilla | 1 | $15,502 | 1 | Not Rated |
| Maria Teresa | 2 | $14,082 | 49 | 4.63/5.0 |
Analyzing the strategies of top hosts, such as their property selection, pricing, and guest communication, can offer valuable lessons for optimizing your own Airbnb operations in Rio.
Dive Deeper: Advanced Rio STR Market Data (2026)
Ready to unlock more insights? AirROI provides access to advanced metrics and comprehensive Airbnb data for Rio. Explore detailed analytics beyond this report to refine your investment strategy, optimize pricing, and maximize your vacation rental profits.
Explore Advanced MetricsRio Short-Term Rental Market Composition (2026): Property & Room Types
Room Type Distribution
Property Type Distribution
Market Composition Insights for Rio
- The Rio Airbnb market composition is heavily skewed towards Entire Home/Apt listings, which make up 96.9% of the 32 active rentals. This indicates strong guest preference for privacy and space.
- Looking at the property type distribution in Rio, Apartment/Condo properties are the most common (46.9%), reflecting the local real estate landscape.
- Houses represent a significant 46.9% portion, catering likely to families or larger groups.
Rio Airbnb Room Capacity Analysis (2026): Bedroom Distribution
Distribution of Listings by Number of Bedrooms
Room Capacity Insights for Rio
- The dominant room capacity in Rio is 2 bedrooms listings, making up 40.6% of the market. This suggests a strong demand for properties suitable for couples or solo travelers.
- Together, 2 bedrooms and 1 bedroom properties represent 75.0% of the active Airbnb listings in Rio, indicating a high concentration in these sizes.
Rio Vacation Rental Guest Capacity Trends (2026)
Distribution of Listings by Guest Capacity
Guest Capacity Insights for Rio
- The most common guest capacity trend in Rio vacation rentals is listings accommodating 4 guests (40.6%). This suggests the primary traveler segment is likely small families or groups.
- Properties designed for 4 guests and 5 guests dominate the Rio STR market, accounting for 56.2% of listings.
- 28.1% of properties accommodate 6+ guests, serving the market segment for larger families or group travel in Rio.
- On average, properties in Rio are equipped to host 4.7 guests.
Rio Airbnb Booking Patterns (2026): Available vs. Booked Days
Available Days Distribution
Booked Days Distribution
Booking Pattern Insights for Rio
- The most common availability pattern in Rio falls within the 271-366 days range, representing 78.1% of listings. This suggests many properties have significant open periods on their calendars.
- Approximately 96.9% of listings show high availability (181+ days open annually), indicating potential for increased bookings or specific owner usage patterns.
- For booked days, the 31-90 days range is most frequent in Rio (50%), reflecting common guest stay durations or potential owner blocking patterns.
- A notable 3.1% of properties secure long booking periods (181+ days booked per year), highlighting successful long-term rental strategies or significant owner usage.
Rio Airbnb Minimum Stay Requirements Analysis
Distribution of Listings by Minimum Night Requirement
1 Night
1 listings
3.1% of total
3 Nights
4 listings
12.5% of total
4-6 Nights
12 listings
37.5% of total
7-29 Nights
3 listings
9.4% of total
30+ Nights
12 listings
37.5% of total
Key Insights
- The most prevalent minimum stay requirement in Rio is 4-6 Nights, adopted by 37.5% of listings. This highlights the market's preference for longer commitments.
- Very short stays (1-2 nights) are less common (3.1%), suggesting hosts prefer slightly longer bookings to optimize turnover.
- A significant segment (37.5%) caters to monthly stays (30+ nights) in Rio, pointing to opportunities in the extended-stay market.
Recommendations
- Align with the market by considering a 4-6 Nights minimum stay, as 37.5% of Rio hosts use this setting.
- If feasible, allowing 1-night stays, especially midweek or during low season, could capture last-minute bookings, as only 3.1% currently do.
- Explore offering discounts for stays of 30+ nights to attract the 37.5% of the market seeking extended stays.
- Adjust minimum nights based on seasonality – potentially shorter during low season and longer during peak demand periods in Rio.
Rio Airbnb Cancellation Policy Trends Analysis (2026)
Super Strict 60 Days
3 listings
9.4% of total
Super Strict 30 Days
3 listings
9.4% of total
Flexible
2 listings
6.3% of total
Moderate
12 listings
37.5% of total
Firm
10 listings
31.3% of total
Strict
2 listings
6.3% of total
Cancellation Policy Insights for Rio
- The prevailing Airbnb cancellation policy trend in Rio is Moderate, used by 37.5% of listings.
- There's a relatively balanced mix between guest-friendly (43.8%) and stricter (37.6%) policies, offering choices for different guest needs.
- Strict cancellation policies are quite rare (6.3%), potentially making listings with this policy less competitive unless justified by high demand or property type.
Recommendations for Hosts
- Consider adopting a Moderate policy to align with the 37.5% market standard in Rio.
- Using a Strict policy might deter some guests, as only 6.3% of listings use it. Evaluate if potential revenue protection outweighs possible lower booking rates.
- Regularly review your cancellation policy against competitors and market demand shifts in Rio.
Rio STR Booking Lead Time Analysis (2026)
Average Booking Lead Time by Month
Booking Lead Time Insights for Rio
- The overall average booking lead time for vacation rentals in Rio is 77 days.
- Guests book furthest in advance for stays during April (average 136 days), likely coinciding with peak travel demand or local events.
- The shortest booking windows occur for stays in February (average 1 days), indicating more last-minute travel plans during this time.
- Seasonally, Spring (93 days avg.) sees the longest lead times, while Winter (4 days avg.) has the shortest, reflecting typical travel planning cycles.
Recommendations for Hosts
- Use the overall average lead time (77 days) as a baseline for your pricing and availability strategy in Rio.
- For April stays, consider implementing length-of-stay discounts or slightly higher rates for bookings made less than 136 days out to capitalize on advance planning.
- During February, focus on last-minute booking availability and promotions, as guests book with very short notice (1 days avg.).
- Target marketing efforts for the Spring season well in advance (at least 93 days) to capture early planners.
- Monitor your own booking lead times against these Rio averages to identify opportunities for dynamic pricing adjustments.
Popular & Essential Airbnb Amenities in Rio (2026)
Amenity Prevalence
Amenity Insights for Rio
- Popular amenities like TV, Kitchen, Free parking on premises are common but not universal. Offering these can provide a competitive edge.
Recommendations for Hosts
- Consider adding popular differentiators like TV or Kitchen to increase appeal.
- Highlight unique or less common amenities you offer (e.g., hot tub, dedicated workspace, EV charger) in your listing description and photos.
- Regularly check competitor amenities in Rio to stay competitive.
Rio Airbnb Guest Demographics & Profile Analysis (2026)
Guest Profile Summary for Rio
- The typical guest profile for Airbnb in Rio consists of predominantly international visitors (80%), with top international origins including Germany, typically belonging to the Post-2000s (Gen Z/Alpha) group (50%), primarily speaking English or German.
- Domestic travelers account for 20.4% of guests.
- Key international markets include Italy (20.4%) and Germany (18.4%).
- Top languages spoken are English (43.2%) followed by German (18.9%).
- A significant demographic segment is the Post-2000s (Gen Z/Alpha) group, representing 50% of guests.
Recommendations for Hosts
- Focus marketing internationally, particularly towards travelers from Germany.
- Tailor amenities and listing descriptions to appeal to the dominant Post-2000s (Gen Z/Alpha) demographic (e.g., highlight fast WiFi, smart home features, local guides).
- Highlight unique local experiences or amenities relevant to the primary guest profile.
- Consider seasonal promotions aligned with peak travel times for key origin markets.
Nearby Short-Term Rental Market Comparison
How does the Rio Airbnb market stack up against its neighbors? Compare key performance metrics like average monthly revenue, ADR, and occupancy rates in surrounding areas to understand the broader regional STR landscape.
| Market | Active Properties | Monthly Revenue | Daily Rate | Avg. Occupancy |
|---|---|---|---|---|
| Tignano | 12 | $4,160 | $366.92 | 45% |
| Marciano della Chiana | 17 | $3,823 | $545.25 | 35% |
| Castelfranco di Sotto | 47 | $3,777 | $377.39 | 39% |
| Porto Cervo | 195 | $3,256 | $555.32 | 40% |
| Buonconvento | 60 | $3,186 | $440.58 | 43% |
| Radda in Chianti | 94 | $3,098 | $361.57 | 39% |
| Impruneta | 146 | $2,887 | $297.45 | 40% |
| Lastra a Signa | 96 | $2,760 | $311.91 | 43% |
| Florence | 10,496 | $2,755 | $225.30 | 49% |
| Marcialla | 29 | $2,745 | $263.00 | 48% |