Castiglione della Pescaia Airbnb Market Analysis 2026: Short Term Rental Data & Vacation Rental Statistics in Tuscany, Italy
Is Airbnb profitable in Castiglione della Pescaia in 2026? Explore comprehensive Airbnb analytics for Castiglione della Pescaia, Tuscany, Italy to uncover income potential. This 2026 STR market report for Castiglione della Pescaia, based on AirROI data from February 2025 to January 2026, reveals key trends in the market of 589 active listings.
Whether you're considering an Airbnb investment in Castiglione della Pescaia, optimizing your existing vacation rental, or exploring rental arbitrage opportunities, understanding the Castiglione della Pescaia Airbnb data is crucial. Navigating the high regulation landscape is key to maximizing your short term rental income potential. Let's dive into the specifics.
Key Castiglione della Pescaia Airbnb Performance Metrics Overview
Monthly Airbnb Revenue Variations & Income Potential in Castiglione della Pescaia (2026)
Understanding the monthly revenue variations for Airbnb listings in Castiglione della Pescaia is key to maximizing your short term rental income potential. Seasonality significantly impacts earnings. Our analysis, based on data from the past 12 months, shows that the peak revenue month for STRs in Castiglione della Pescaia is typically August, while February often presents the lowest earnings, highlighting opportunities for strategic pricing adjustments during shoulder and low seasons. Explore the typical Airbnb income in Castiglione della Pescaia across different performance tiers:
- Best-in-class properties (Top 10%) achieve $3,602+ monthly, often utilizing dynamic pricing and superior guest experiences.
- Strong performing properties (Top 25%) earn $2,354 or more, indicating effective management and desirable locations/amenities.
- Typical properties (Median) generate around $1,388 per month, representing the average market performance.
- Entry-level properties (Bottom 25%) see earnings around $710, often with potential for optimization.
Average Monthly Airbnb Earnings Trend in Castiglione della Pescaia
Castiglione della Pescaia Airbnb Occupancy Rate Trends (2026)
Maximize your bookings by understanding the Castiglione della Pescaia STR occupancy trends. Seasonal demand shifts significantly influence how often properties are booked. Typically, Augustsees the highest demand (peak season occupancy), while January experiences the lowest (low season). Effective strategies, like adjusting minimum stays or offering promotions, can boost occupancy during slower periods. Here's how different property tiers perform in Castiglione della Pescaia:
- Best-in-class properties (Top 10%) achieve 65%+ occupancy, indicating high desirability and potentially optimized availability.
- Strong performing properties (Top 25%) maintain 48% or higher occupancy, suggesting good market fit and guest satisfaction.
- Typical properties (Median) have an occupancy rate around 28%.
- Entry-level properties (Bottom 25%) average 13% occupancy, potentially facing higher vacancy.
Average Monthly Occupancy Rate Trend in Castiglione della Pescaia
Average Daily Rate (ADR) Airbnb Trends in Castiglione della Pescaia (2026)
Effective short term rental pricing strategy in Castiglione della Pescaia involves understanding monthly ADR fluctuations. The Average Daily Rate (ADR) for Airbnb in Castiglione della Pescaia typically peaks in August and dips lowest during April. Leveraging Airbnb dynamic pricing tools or strategies based on this seasonality can significantly boost revenue. Here's a look at the typical nightly rates achieved:
- Best-in-class properties (Top 10%) command rates of $322+ per night, often due to premium features or locations.
- Strong performing properties (Top 25%) achieve nightly rates of $213 or more.
- Typical properties (Median) charge around $147 per night.
- Entry-level properties (Bottom 25%) earn around $111 per night.
Average Daily Rate (ADR) Trend by Month in Castiglione della Pescaia
Get Live Castiglione della Pescaia Market Intelligence 👇

Explore Real-time Analytics
Airbnb Seasonality Analysis & Trends in Castiglione della Pescaia (2026)
Peak Season (August, July, June)
- Revenue averages $3,701 per month
- Occupancy rates average 53.6%
- Daily rates average $220
Shoulder Season
- Revenue averages $1,410 per month
- Occupancy maintains around 29.4%
- Daily rates hold near $196
Low Season (January, February, December)
- Revenue drops to average $792 per month
- Occupancy decreases to average 16.7%
- Daily rates adjust to average $199
Seasonality Insights for Castiglione della Pescaia
- The Airbnb seasonality in Castiglione della Pescaia shows highly seasonal trends requiring careful strategy. While the sections above show seasonal averages, it's also insightful to look at the extremes:
- During the high season, the absolute peak month showcases Castiglione della Pescaia's highest earning potential, with monthly revenues capable of climbing to $4,507, occupancy reaching a high of 62.6%, and ADRs peaking at $227.
- Conversely, the slowest single month of the year, typically falling within the low season, marks the market's lowest point. In this month, revenue might dip to $739, occupancy could drop to 14.8%, and ADRs may adjust down to $190.
- Understanding both the seasonal averages and these monthly peaks and troughs in revenue, occupancy, and ADR is crucial for maximizing your Airbnb profit potential in Castiglione della Pescaia.
Seasonal Strategies for Maximizing Profit
- Peak Season: Maximize revenue through premium pricing and potentially longer minimum stays. Ensure high availability.
- Low Season: Offer competitive pricing, special promotions (e.g., extended stay discounts), and flexible cancellation policies. Target off-season travelers like remote workers or budget-conscious guests.
- Shoulder Seasons: Implement dynamic pricing that balances peak and low rates. Target weekend travelers or specific events. Offer slightly more flexible terms than peak season.
- Regularly analyze your own performance against these Castiglione della Pescaia seasonality benchmarks and adjust your pricing and availability strategy accordingly.
Best Areas for Airbnb Investment in Castiglione della Pescaia (2026)
Exploring the top neighborhoods for short-term rentals in Castiglione della Pescaia? This section highlights key areas, outlining why they are attractive for hosts and guests, along with notable local attractions. Consider these locations based on your target guest profile and investment strategy.
| Neighborhood / Area | Why Host Here? (Target Guests & Appeal) | Key Attractions & Landmarks |
|---|---|---|
| Punta Ala | A beloved destination known for its picturesque coastline, luxury resorts, and exclusive marina. Perfect for upscale travelers and beach lovers looking for relaxation and natural beauty. | Punta Ala Beach, Golf Club Punta Ala, Marina di Punta Ala, Castiglione della Pescaia Castle, Acqua Village Water Park |
| Castiglione della Pescaia Beachfront | A charming seaside town with beautiful beaches and a historic center. Offers a relaxed atmosphere with access to various dining and recreational activities. | Castiglione Castle, La Spiaggia delle Rocchette, Natural Park of Maremma, Piazza Ricasoli, Local seafood restaurants |
| Burgio | Located in the hills, Burgio offers stunning views and a serene atmosphere away from the bustling waterfront. Great for those seeking tranquility and outdoor activities. | Burgio Village, Hiking trails, Local wineries, Historic churches, Countryside landscapes |
| Marina di Grosseto | Another lovely coastal area with sandy beaches that caters to families and beachgoers. Plenty of facilities and water sports activities. | Marina di Grosseto Beach, Pineta del Tombolo, Watersports rentals, Local markets, Family-friendly restaurants |
| Vetulonia | An ancient Etruscan site with rich history and archaeological significance. Attracts history enthusiasts and those interested in culture. | Vetulonia Archaeological Museum, Etruscan ruins, Scenic views, Local hiking paths, Rural countryside |
| Principina a Mare | Known for its wide sandy beaches and natural parks, it’s a great option for nature lovers and families looking for a beach vacation. | Principina a Mare Beach, Natural Duna Feniglia, Cycling paths, Beach clubs, Relaxed nightlife |
| Porto Santo Stefano | Part of the Monte Argentario peninsula, this area offers stunning views and is popular with those who enjoy sailing and marine activities. | Porto Santo Stefano Harbour, Monte Argentario, Seafood restaurants, Scuba diving spots, Beautiful coves |
| Talamone | A charming coastal village with a picturesque harbor and history. It's an attractive spot for visitors looking for scenic beauty and local charm. | Talamone Beach, The Tower of Talamone, Natural parks, Local fishing spots, Windsurfing and kitesurfing |
Understanding Airbnb License Requirements & STR Laws in Castiglione della Pescaia (2026)
Yes, Castiglione della Pescaia, Tuscany, Italy enforces high STR regulations. Obtaining a license and ensuring compliance is almost certainly required according to current 2026 STR laws. Always verify the latest short term rental regulations and Airbnb license requirements directly with local government authorities for Castiglione della Pescaia to ensure full compliance before hosting.
(Source: AirROI data, 2026, based on 87% licensed listings)
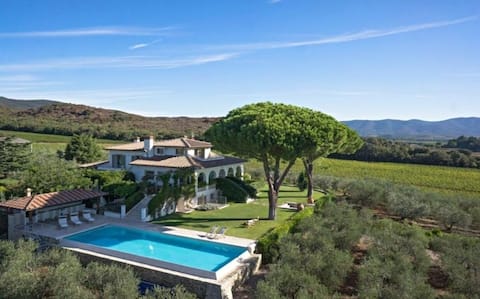
Top Performing Airbnb Properties in Castiglione della Pescaia (2026)
Benchmark your potential! Explore examples of top-performing Airbnb properties in Castiglione della Pescaiabased on Trailing Twelve Month (TTM) revenue. Analyze their characteristics, revenue, occupancy rate, and ADR to understand what drives success in this market.
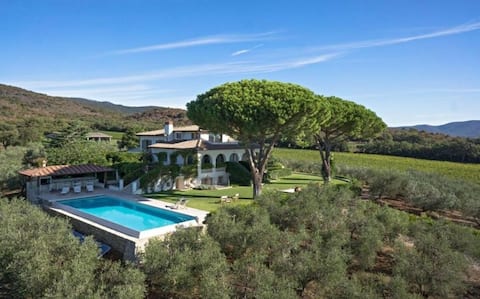
Beautiful villa with a pool
Entire Place • 5 bedrooms
Charming villa with pool
Entire Place • 7 bedrooms
Villa Castiglione beautiful modern villa with priv
Entire Place • 7 bedrooms
Roccamare-A Dream of Peace&Beauty on the Sea
Entire Place • 7 bedrooms

Villa Capinera, entire house with private park
Entire Place • 7 bedrooms
‘IL PEPERONCINO’ TUSCAN VILLA WITH PRIVATE POOL
Entire Place • 5 bedrooms
Note: Performance varies based on location, size, amenities, seasonality, and management quality. Data reflects the past 12 months.
Top Performing Airbnb Hosts in Castiglione della Pescaia (2026)
Learn from the best! This table showcases top-performing Airbnb hosts in Castiglione della Pescaia based on the number of properties managed and estimated total revenue over the past year. Analyze their scale and performance metrics.
| Host Name | Properties | Grossing Revenue | Stay Reviews | Avg Rating |
|---|---|---|---|---|
| AlfaReal | 31 | $367,238 | 111 | 4.79/5.0 |
| Alessandro | 3 | $340,602 | 5 | Not Rated |
| David | 8 | $253,035 | 410 | 4.88/5.0 |
| Alessandra - Interhome | 7 | $137,947 | 39 | 4.66/5.0 |
| Sandra - Interhome | 6 | $116,609 | 32 | 4.23/5.0 |
| Giordana | 4 | $99,297 | 1504 | 4.98/5.0 |
| Raffaele | 3 | $94,401 | 186 | 4.88/5.0 |
| Marti&Fifi | 1 | $79,500 | 2 | Not Rated |
| Giuseppe | 6 | $74,494 | 195 | 4.87/5.0 |
| Il Baciarino | 4 | $72,205 | 302 | 4.87/5.0 |
Analyzing the strategies of top hosts, such as their property selection, pricing, and guest communication, can offer valuable lessons for optimizing your own Airbnb operations in Castiglione della Pescaia.
Dive Deeper: Advanced Castiglione della Pescaia STR Market Data (2026)
Ready to unlock more insights? AirROI provides access to advanced metrics and comprehensive Airbnb data for Castiglione della Pescaia. Explore detailed analytics beyond this report to refine your investment strategy, optimize pricing, and maximize your vacation rental profits.
Explore Advanced MetricsCastiglione della Pescaia Short-Term Rental Market Composition (2026): Property & Room Types
Room Type Distribution
Property Type Distribution
Market Composition Insights for Castiglione della Pescaia
- The Castiglione della Pescaia Airbnb market composition is heavily skewed towards Entire Home/Apt listings, which make up 96.9% of the 589 active rentals. This indicates strong guest preference for privacy and space.
- Looking at the property type distribution in Castiglione della Pescaia, Apartment/Condo properties are the most common (61.5%), reflecting the local real estate landscape.
- Houses represent a significant 34% portion, catering likely to families or larger groups.
- Smaller segments like outdoor/unique, hotel/boutique, others (combined 4.6%) offer potential for unique stay experiences.
Castiglione della Pescaia Airbnb Room Capacity Analysis (2026): Bedroom Distribution
Distribution of Listings by Number of Bedrooms
Room Capacity Insights for Castiglione della Pescaia
- The dominant room capacity in Castiglione della Pescaia is 2 bedrooms listings, making up 39.6% of the market. This suggests a strong demand for properties suitable for couples or solo travelers.
- Together, 2 bedrooms and 1 bedroom properties represent 72.7% of the active Airbnb listings in Castiglione della Pescaia, indicating a high concentration in these sizes.
- A significant 23.2% of listings offer 3+ bedrooms, catering to larger groups and families seeking more space in Castiglione della Pescaia.
Castiglione della Pescaia Vacation Rental Guest Capacity Trends (2026)
Distribution of Listings by Guest Capacity
Guest Capacity Insights for Castiglione della Pescaia
- The most common guest capacity trend in Castiglione della Pescaia vacation rentals is listings accommodating 4 guests (35.5%). This suggests the primary traveler segment is likely small families or groups.
- Properties designed for 4 guests and 6 guests dominate the Castiglione della Pescaia STR market, accounting for 52.8% of listings.
- 31.2% of properties accommodate 6+ guests, serving the market segment for larger families or group travel in Castiglione della Pescaia.
- On average, properties in Castiglione della Pescaia are equipped to host 4.7 guests.
Castiglione della Pescaia Airbnb Booking Patterns (2026): Available vs. Booked Days
Available Days Distribution
Booked Days Distribution
Booking Pattern Insights for Castiglione della Pescaia
- The most common availability pattern in Castiglione della Pescaia falls within the 271-366 days range, representing 72.8% of listings. This suggests many properties have significant open periods on their calendars.
- Approximately 97.4% of listings show high availability (181+ days open annually), indicating potential for increased bookings or specific owner usage patterns.
- For booked days, the 31-90 days range is most frequent in Castiglione della Pescaia (42.3%), reflecting common guest stay durations or potential owner blocking patterns.
- A notable 3.2% of properties secure long booking periods (181+ days booked per year), highlighting successful long-term rental strategies or significant owner usage.
Castiglione della Pescaia Airbnb Minimum Stay Requirements Analysis
Distribution of Listings by Minimum Night Requirement
1 Night
40 listings
6.8% of total
2 Nights
37 listings
6.3% of total
3 Nights
23 listings
3.9% of total
4-6 Nights
145 listings
24.6% of total
7-29 Nights
103 listings
17.5% of total
30+ Nights
241 listings
40.9% of total
Key Insights
- The most prevalent minimum stay requirement in Castiglione della Pescaia is 30+ Nights, adopted by 40.9% of listings. This highlights the market's preference for longer commitments.
- Very short stays (1-2 nights) are less common (13.1%), suggesting hosts prefer slightly longer bookings to optimize turnover.
- A significant segment (40.9%) caters to monthly stays (30+ nights) in Castiglione della Pescaia, pointing to opportunities in the extended-stay market.
Recommendations
- Align with the market by considering a 30+ Nights minimum stay, as 40.9% of Castiglione della Pescaia hosts use this setting.
- If feasible, allowing 1-night stays, especially midweek or during low season, could capture last-minute bookings, as only 6.8% currently do.
- Explore offering discounts for stays of 30+ nights to attract the 40.9% of the market seeking extended stays.
- Adjust minimum nights based on seasonality – potentially shorter during low season and longer during peak demand periods in Castiglione della Pescaia.
Castiglione della Pescaia Airbnb Cancellation Policy Trends Analysis (2026)
Super Strict 60 Days
41 listings
7% of total
Super Strict 30 Days
26 listings
4.4% of total
Limited
6 listings
1% of total
Flexible
98 listings
16.7% of total
Moderate
186 listings
31.6% of total
Firm
163 listings
27.7% of total
Strict
68 listings
11.6% of total
Cancellation Policy Insights for Castiglione della Pescaia
- The prevailing Airbnb cancellation policy trend in Castiglione della Pescaia is Moderate, used by 31.6% of listings.
- There's a relatively balanced mix between guest-friendly (48.3%) and stricter (39.3%) policies, offering choices for different guest needs.
Recommendations for Hosts
- Consider adopting a Moderate policy to align with the 31.6% market standard in Castiglione della Pescaia.
- Using a Strict policy might deter some guests, as only 11.6% of listings use it. Evaluate if potential revenue protection outweighs possible lower booking rates.
- Regularly review your cancellation policy against competitors and market demand shifts in Castiglione della Pescaia.
Castiglione della Pescaia STR Booking Lead Time Analysis (2026)
Average Booking Lead Time by Month
Booking Lead Time Insights for Castiglione della Pescaia
- The overall average booking lead time for vacation rentals in Castiglione della Pescaia is 61 days.
- Guests book furthest in advance for stays during August (average 105 days), likely coinciding with peak travel demand or local events.
- The shortest booking windows occur for stays in January (average 13 days), indicating more last-minute travel plans during this time.
- Seasonally, Summer (82 days avg.) sees the longest lead times, while Winter (17 days avg.) has the shortest, reflecting typical travel planning cycles.
Recommendations for Hosts
- Use the overall average lead time (61 days) as a baseline for your pricing and availability strategy in Castiglione della Pescaia.
- For August stays, consider implementing length-of-stay discounts or slightly higher rates for bookings made less than 105 days out to capitalize on advance planning.
- During January, focus on last-minute booking availability and promotions, as guests book with very short notice (13 days avg.).
- Target marketing efforts for the Summer season well in advance (at least 82 days) to capture early planners.
- Monitor your own booking lead times against these Castiglione della Pescaia averages to identify opportunities for dynamic pricing adjustments.
Popular & Essential Airbnb Amenities in Castiglione della Pescaia (2026)
Amenity Prevalence
Amenity Insights for Castiglione della Pescaia
- Popular amenities like Kitchen, TV, Refrigerator are common but not universal. Offering these can provide a competitive edge.
- Warning: Wifi is not universally provided but is considered essential globally. Ensure reliable Wifi is offered.
Recommendations for Hosts
- Consider adding popular differentiators like Kitchen or TV to increase appeal.
- Highlight unique or less common amenities you offer (e.g., hot tub, dedicated workspace, EV charger) in your listing description and photos.
- Regularly check competitor amenities in Castiglione della Pescaia to stay competitive.
Castiglione della Pescaia Airbnb Guest Demographics & Profile Analysis (2026)
Guest Profile Summary for Castiglione della Pescaia
- The typical guest profile for Airbnb in Castiglione della Pescaia consists of a mix of domestic (45%) and international guests, with top international origins including Germany, typically belonging to the Post-2000s (Gen Z/Alpha) group (50%), primarily speaking English or Italian.
- Domestic travelers account for 45.4% of guests.
- Key international markets include Italy (45.4%) and Germany (16.4%).
- Top languages spoken are English (36.7%) followed by Italian (21.6%).
- A significant demographic segment is the Post-2000s (Gen Z/Alpha) group, representing 50% of guests.
Recommendations for Hosts
- Balance marketing efforts between domestic and international channels based on the guest mix.
- Tailor amenities and listing descriptions to appeal to the dominant Post-2000s (Gen Z/Alpha) demographic (e.g., highlight fast WiFi, smart home features, local guides).
- Highlight unique local experiences or amenities relevant to the primary guest profile.
- Consider seasonal promotions aligned with peak travel times for key origin markets.
Nearby Short-Term Rental Market Comparison
How does the Castiglione della Pescaia Airbnb market stack up against its neighbors? Compare key performance metrics like average monthly revenue, ADR, and occupancy rates in surrounding areas to understand the broader regional STR landscape.
| Market | Active Properties | Monthly Revenue | Daily Rate | Avg. Occupancy |
|---|---|---|---|---|
| Tignano | 12 | $4,160 | $366.92 | 45% |
| Marciano della Chiana | 17 | $3,823 | $545.25 | 35% |
| Castelfranco di Sotto | 47 | $3,777 | $377.39 | 39% |
| Porto Cervo | 195 | $3,256 | $555.32 | 40% |
| Buonconvento | 60 | $3,186 | $440.58 | 43% |
| Radda in Chianti | 94 | $3,098 | $361.57 | 39% |
| Impruneta | 146 | $2,887 | $297.45 | 40% |
| Lastra a Signa | 96 | $2,760 | $311.91 | 43% |
| Florence | 10,496 | $2,755 | $225.30 | 49% |
| Marcialla | 29 | $2,745 | $263.00 | 48% |