Caprese Michelangelo Airbnb Market Analysis 2025: Short Term Rental Data & Vacation Rental Statistics in Tuscany, Italy
Is Airbnb profitable in Caprese Michelangelo in 2025? Explore comprehensive Airbnb analytics for Caprese Michelangelo, Tuscany, Italy to uncover income potential. This 2025 STR market report for Caprese Michelangelo, based on AirROI data from August 2024 to July 2025, reveals key trends in the niche market of 18 active listings.
Whether you're considering an Airbnb investment in Caprese Michelangelo, optimizing your existing vacation rental, or exploring rental arbitrage opportunities, understanding the Caprese Michelangelo Airbnb data is crucial. Leveraging the low regulation environment is key to maximizing your short term rental income potential. Let's dive into the specifics.
Key Caprese Michelangelo Airbnb Performance Metrics Overview
Monthly Airbnb Revenue Variations & Income Potential in Caprese Michelangelo (2025)
Understanding the monthly revenue variations for Airbnb listings in Caprese Michelangelo is key to maximizing your short term rental income potential. Seasonality significantly impacts earnings. Our analysis, based on data from the past 12 months, shows that the peak revenue month for STRs in Caprese Michelangelo is typically August, while November often presents the lowest earnings, highlighting opportunities for strategic pricing adjustments during shoulder and low seasons. Explore the typical Airbnb income in Caprese Michelangelo across different performance tiers:
- Best-in-class properties (Top 10%) achieve $3,593+ monthly, often utilizing dynamic pricing and superior guest experiences.
- Strong performing properties (Top 25%) earn $2,345 or more, indicating effective management and desirable locations/amenities.
- Typical properties (Median) generate around $924 per month, representing the average market performance.
- Entry-level properties (Bottom 25%) see earnings around $424, often with potential for optimization.
Average Monthly Airbnb Earnings Trend in Caprese Michelangelo
Caprese Michelangelo Airbnb Occupancy Rate Trends (2025)
Maximize your bookings by understanding the Caprese Michelangelo STR occupancy trends. Seasonal demand shifts significantly influence how often properties are booked. Typically, Augustsees the highest demand (peak season occupancy), while March experiences the lowest (low season). Effective strategies, like adjusting minimum stays or offering promotions, can boost occupancy during slower periods. Here's how different property tiers perform in Caprese Michelangelo:
- Best-in-class properties (Top 10%) achieve 51%+ occupancy, indicating high desirability and potentially optimized availability.
- Strong performing properties (Top 25%) maintain 28% or higher occupancy, suggesting good market fit and guest satisfaction.
- Typical properties (Median) have an occupancy rate around 17%.
- Entry-level properties (Bottom 25%) average 9% occupancy, potentially facing higher vacancy.
Average Monthly Occupancy Rate Trend in Caprese Michelangelo
Average Daily Rate (ADR) Airbnb Trends in Caprese Michelangelo (2025)
Effective short term rental pricing strategy in Caprese Michelangelo involves understanding monthly ADR fluctuations. The Average Daily Rate (ADR) for Airbnb in Caprese Michelangelo typically peaks in July and dips lowest during February. Leveraging Airbnb dynamic pricing tools or strategies based on this seasonality can significantly boost revenue. Here's a look at the typical nightly rates achieved:
- Best-in-class properties (Top 10%) command rates of $466+ per night, often due to premium features or locations.
- Strong performing properties (Top 25%) achieve nightly rates of $344 or more.
- Typical properties (Median) charge around $167 per night.
- Entry-level properties (Bottom 25%) earn around $83 per night.
Average Daily Rate (ADR) Trend by Month in Caprese Michelangelo
Get Live Caprese Michelangelo Market Intelligence 👇

Explore Real-time Analytics
Airbnb Seasonality Analysis & Trends in Caprese Michelangelo (2025)
Peak Season (August, May, April)
- Revenue averages $3,106 per month
- Occupancy rates average 35.9%
- Daily rates average $224
Shoulder Season
- Revenue averages $1,178 per month
- Occupancy maintains around 20.3%
- Daily rates hold near $213
Low Season (February, March, November)
- Revenue drops to average $542 per month
- Occupancy decreases to average 12.6%
- Daily rates adjust to average $207
Seasonality Insights for Caprese Michelangelo
- The Airbnb seasonality in Caprese Michelangelo shows highly seasonal trends requiring careful strategy. While the sections above show seasonal averages, it's also insightful to look at the extremes:
- During the high season, the absolute peak month showcases Caprese Michelangelo's highest earning potential, with monthly revenues capable of climbing to $4,362, occupancy reaching a high of 59.0%, and ADRs peaking at $240.
- Conversely, the slowest single month of the year, typically falling within the low season, marks the market's lowest point. In this month, revenue might dip to $464, occupancy could drop to 6.4%, and ADRs may adjust down to $200.
- Understanding both the seasonal averages and these monthly peaks and troughs in revenue, occupancy, and ADR is crucial for maximizing your Airbnb profit potential in Caprese Michelangelo.
Seasonal Strategies for Maximizing Profit
- Peak Season: Maximize revenue through premium pricing and potentially longer minimum stays. Ensure high availability.
- Low Season: Offer competitive pricing, special promotions (e.g., extended stay discounts), and flexible cancellation policies. Target off-season travelers like remote workers or budget-conscious guests.
- Shoulder Seasons: Implement dynamic pricing that balances peak and low rates. Target weekend travelers or specific events. Offer slightly more flexible terms than peak season.
- Regularly analyze your own performance against these Caprese Michelangelo seasonality benchmarks and adjust your pricing and availability strategy accordingly.
Best Areas for Airbnb Investment in Caprese Michelangelo (2025)
Exploring the top neighborhoods for short-term rentals in Caprese Michelangelo? This section highlights key areas, outlining why they are attractive for hosts and guests, along with notable local attractions. Consider these locations based on your target guest profile and investment strategy.
| Neighborhood / Area | Why Host Here? (Target Guests & Appeal) | Key Attractions & Landmarks |
|---|---|---|
| Centro Storico | The historic center of Caprese Michelangelo is charming and picturesque, drawing tourists interested in art, history, and local culture. It offers access to quaint streets, historical landmarks, and local dining. | Michelangelo's Birthplace, Historic Castle, Local artisan shops, Scenic viewpoints, Galleries of local artists |
| Nature Parks | Surrounded by the beautiful landscapes of Tuscany, Caprese Michelangelo is near several natural parks and reserves, appealing to nature lovers and outdoor enthusiasts for hiking and relaxation. | Casentino Forests, Pieve di Romena, Parco Nazionale delle Foreste Casentinesi, Nature trails, Picnic areas |
| Local Markets | The town hosts vibrant local markets where visitors can experience authentic Tuscan food and artisanal crafts, making it a favorite spot for foodies and cultural enthusiasts. | Weekly Organic Market, Local Cheese Producers, Tuscan Wine Tasting, Artisan Food Workshops, Fresh Produce Stalls |
| Art and Culture | Caprese Michelangelo has a strong artistic heritage and is known for its connection to Michelangelo. It attracts art lovers interested in museums and cultural events. | Michelangelo Museum, Local Art Exhibitions, Cultural Festivals, Art Workshops, Theater Performances |
| Countryside Retreats | The surrounding countryside offers serene landscapes and traditional Tuscan villas, appealing to those looking for a peaceful getaway away from the hustle and bustle. | Farmhouse Stays, Wine Estates, Olive Groves, Biking Trails, Rural Landscapes |
| Family-Friendly | The town provides a safe environment with activities suitable for families, making it an attractive destination for parents with children. | Children's Playgrounds, Family-Friendly Hikes, Local Sports Events, Festivals, Cultural Workshops for Kids |
| Culinary Experiences | Known for its excellent cuisine, Caprese Michelangelo offers numerous cooking classes and culinary tours, appealing to food lovers. | Cooking Classes, Wine Tasting Tours, Trattorias, Local Olive Oil Producers, Gastronomic Festivals |
| Relaxation and Wellness | With several spas and wellness centers, the town is a fantastic destination for those looking to unwind and rejuvenate. | Health Spas, Yoga Retreats, Thermal Baths, Massage Centers, Meditation Workshops |
Understanding Airbnb License Requirements & STR Laws in Caprese Michelangelo (2025)
While Caprese Michelangelo, Tuscany, Italy currently shows low STR regulations, specific Airbnb license requirements might still exist or change. Always verify the latest short term rental regulations and Airbnb license requirements directly with local government authorities for Caprese Michelangelo to ensure full compliance before hosting.
(Source: AirROI data, 2025, based on 6% licensed listings)
Top Performing Airbnb Properties in Caprese Michelangelo (2025)
Benchmark your potential! Explore examples of top-performing Airbnb properties in Caprese Michelangelobased on Trailing Twelve Month (TTM) revenue. Analyze their characteristics, revenue, occupancy rate, and ADR to understand what drives success in this market.
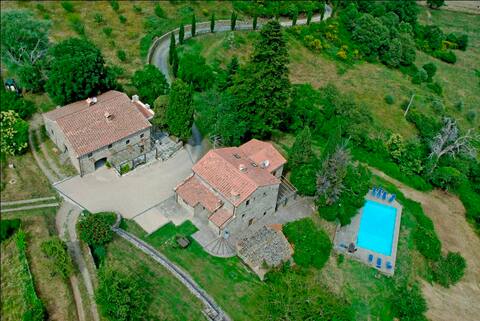
Entire Tuscan Farmhouse w swimming pool excl. use
Entire Place • 6 bedrooms

Oasis on the hills - Lake View Villa
Entire Place • 3 bedrooms

Casa Ciappi
Entire Place • 3 bedrooms

Villa Elisabetta
Entire Place • 10 bedrooms

Villa Querciolo - Private Pool, Relax & Privacy
Entire Place • 3 bedrooms
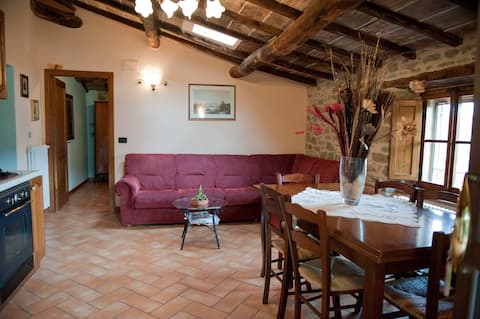
Il Nido apartment 3 bedrooms, bathroom, kitchen
Entire Place • 3 bedrooms
Note: Performance varies based on location, size, amenities, seasonality, and management quality. Data reflects the past 12 months.
Top Performing Airbnb Hosts in Caprese Michelangelo (2025)
Learn from the best! This table showcases top-performing Airbnb hosts in Caprese Michelangelo based on the number of properties managed and estimated total revenue over the past year. Analyze their scale and performance metrics.
| Host Name | Properties | Grossing Revenue | Stay Reviews | Avg Rating |
|---|---|---|---|---|
| Alessandro | 1 | $39,460 | 19 | 4.58/5.0 |
| Adria | 3 | $28,455 | 3 | Not Rated |
| Ludovico | 1 | $25,578 | 5 | 4.80/5.0 |
| Michela | 1 | $14,701 | 41 | 4.95/5.0 |
| Elisabetta | 3 | $13,051 | 25 | 4.55/5.0 |
| Maria Silvia | 1 | $11,814 | 3 | 4.33/5.0 |
| Joseph Victor | 1 | $11,657 | 20 | 4.95/5.0 |
| Rita | 1 | $9,916 | 8 | 4.38/5.0 |
| Raffaele | 1 | $8,677 | 73 | 4.60/5.0 |
| Novasol | 1 | $1,254 | 1 | Not Rated |
Analyzing the strategies of top hosts, such as their property selection, pricing, and guest communication, can offer valuable lessons for optimizing your own Airbnb operations in Caprese Michelangelo.
Dive Deeper: Advanced Caprese Michelangelo STR Market Data (2025)
Ready to unlock more insights? AirROI provides access to advanced metrics and comprehensive Airbnb data for Caprese Michelangelo. Explore detailed analytics beyond this report to refine your investment strategy, optimize pricing, and maximize your vacation rental profits.
Explore Advanced MetricsCaprese Michelangelo Short-Term Rental Market Composition (2025): Property & Room Types
Room Type Distribution
Property Type Distribution
Market Composition Insights for Caprese Michelangelo
- The Caprese Michelangelo Airbnb market composition is heavily skewed towards Entire Home/Apt listings, which make up 83.3% of the 18 active rentals. This indicates strong guest preference for privacy and space.
- Looking at the property type distribution in Caprese Michelangelo, House properties are the most common (55.6%), reflecting the local real estate landscape.
- Houses represent a significant 55.6% portion, catering likely to families or larger groups.
Caprese Michelangelo Airbnb Room Capacity Analysis (2025): Bedroom Distribution
Distribution of Listings by Number of Bedrooms
Room Capacity Insights for Caprese Michelangelo
- The dominant room capacity in Caprese Michelangelo is 3 bedrooms listings, making up 33.3% of the market. This suggests a strong demand for properties suitable for families or small groups.
- Together, 3 bedrooms and 1 bedroom properties represent 61.1% of the active Airbnb listings in Caprese Michelangelo, indicating a high concentration in these sizes.
- A significant 50.0% of listings offer 3+ bedrooms, catering to larger groups and families seeking more space in Caprese Michelangelo.
Caprese Michelangelo Vacation Rental Guest Capacity Trends (2025)
Distribution of Listings by Guest Capacity
Guest Capacity Insights for Caprese Michelangelo
- The most common guest capacity trend in Caprese Michelangelo vacation rentals is listings accommodating 8+ guests (27.8%). This suggests the primary traveler segment is likely larger groups.
- Properties designed for 8+ guests and 2 guests dominate the Caprese Michelangelo STR market, accounting for 50.0% of listings.
- 50.1% of properties accommodate 6+ guests, serving the market segment for larger families or group travel in Caprese Michelangelo.
- On average, properties in Caprese Michelangelo are equipped to host 4.7 guests.
Caprese Michelangelo Airbnb Booking Patterns (2025): Available vs. Booked Days
Available Days Distribution
Booked Days Distribution
Booking Pattern Insights for Caprese Michelangelo
- The most common availability pattern in Caprese Michelangelo falls within the 271-366 days range, representing 88.9% of listings. This suggests many properties have significant open periods on their calendars.
- Approximately 100.0% of listings show high availability (181+ days open annually), indicating potential for increased bookings or specific owner usage patterns.
- For booked days, the 1-30 days range is most frequent in Caprese Michelangelo (55.6%), reflecting common guest stay durations or potential owner blocking patterns.
Caprese Michelangelo Airbnb Minimum Stay Requirements Analysis
Distribution of Listings by Minimum Night Requirement
1 Night
2 listings
11.1% of total
2 Nights
2 listings
11.1% of total
3 Nights
1 listings
5.6% of total
4-6 Nights
5 listings
27.8% of total
7-29 Nights
2 listings
11.1% of total
30+ Nights
6 listings
33.3% of total
Key Insights
- The most prevalent minimum stay requirement in Caprese Michelangelo is 30+ Nights, adopted by 33.3% of listings. This highlights the market's preference for longer commitments.
- A significant segment (33.3%) caters to monthly stays (30+ nights) in Caprese Michelangelo, pointing to opportunities in the extended-stay market.
Recommendations
- Align with the market by considering a 30+ Nights minimum stay, as 33.3% of Caprese Michelangelo hosts use this setting.
- If feasible, allowing 1-night stays, especially midweek or during low season, could capture last-minute bookings, as only 11.1% currently do.
- Explore offering discounts for stays of 30+ nights to attract the 33.3% of the market seeking extended stays.
- Adjust minimum nights based on seasonality – potentially shorter during low season and longer during peak demand periods in Caprese Michelangelo.
Caprese Michelangelo Airbnb Cancellation Policy Trends Analysis (2025)
Super Strict 60 Days
2 listings
11.1% of total
Flexible
7 listings
38.9% of total
Moderate
3 listings
16.7% of total
Strict
6 listings
33.3% of total
Cancellation Policy Insights for Caprese Michelangelo
- The prevailing Airbnb cancellation policy trend in Caprese Michelangelo is Flexible, used by 38.9% of listings.
- There's a relatively balanced mix between guest-friendly (55.6%) and stricter (33.3%) policies, offering choices for different guest needs.
Recommendations for Hosts
- Consider adopting a Flexible policy to align with the 38.9% market standard in Caprese Michelangelo.
- With 33.3% using Strict terms, this is a viable option in Caprese Michelangelo, particularly for high-value properties or during peak demand periods.
- Regularly review your cancellation policy against competitors and market demand shifts in Caprese Michelangelo.
Caprese Michelangelo STR Booking Lead Time Analysis (2025)
Average Booking Lead Time by Month
Booking Lead Time Insights for Caprese Michelangelo
- The overall average booking lead time for vacation rentals in Caprese Michelangelo is 58 days.
- Guests book furthest in advance for stays during August (average 91 days), likely coinciding with peak travel demand or local events.
- The shortest booking windows occur for stays in November (average 6 days), indicating more last-minute travel plans during this time.
- Seasonally, Summer (61 days avg.) sees the longest lead times, while Winter (20 days avg.) has the shortest, reflecting typical travel planning cycles.
Recommendations for Hosts
- Use the overall average lead time (58 days) as a baseline for your pricing and availability strategy in Caprese Michelangelo.
- For August stays, consider implementing length-of-stay discounts or slightly higher rates for bookings made less than 91 days out to capitalize on advance planning.
- During November, focus on last-minute booking availability and promotions, as guests book with very short notice (6 days avg.).
- Target marketing efforts for the Summer season well in advance (at least 61 days) to capture early planners.
- Monitor your own booking lead times against these Caprese Michelangelo averages to identify opportunities for dynamic pricing adjustments.
Popular & Essential Airbnb Amenities in Caprese Michelangelo (2025)
Amenity Prevalence
Amenity Insights for Caprese Michelangelo
- Popular amenities like Free parking on premises, Heating, Wifi are common but not universal. Offering these can provide a competitive edge.
- Warning: Wifi is not universally provided but is considered essential globally. Ensure reliable Wifi is offered.
Recommendations for Hosts
- Consider adding popular differentiators like Free parking on premises or Heating to increase appeal.
- Highlight unique or less common amenities you offer (e.g., hot tub, dedicated workspace, EV charger) in your listing description and photos.
- Regularly check competitor amenities in Caprese Michelangelo to stay competitive.
Caprese Michelangelo Airbnb Guest Demographics & Profile Analysis (2025)
Guest Profile Summary for Caprese Michelangelo
- The typical guest profile for Airbnb in Caprese Michelangelo consists of predominantly international visitors (65%), with top international origins including Germany, typically belonging to the Post-2000s (Gen Z/Alpha) group (50%), primarily speaking English or Italian.
- Domestic travelers account for 34.6% of guests.
- Key international markets include Italy (34.6%) and Germany (19.2%).
- Top languages spoken are English (45.2%) followed by Italian (19.4%).
- A significant demographic segment is the Post-2000s (Gen Z/Alpha) group, representing 50% of guests.
Recommendations for Hosts
- Focus marketing internationally, particularly towards travelers from Germany.
- Tailor amenities and listing descriptions to appeal to the dominant Post-2000s (Gen Z/Alpha) demographic (e.g., highlight fast WiFi, smart home features, local guides).
- Highlight unique local experiences or amenities relevant to the primary guest profile.
- Consider seasonal promotions aligned with peak travel times for key origin markets.
Nearby Short-Term Rental Market Comparison
How does the Caprese Michelangelo Airbnb market stack up against its neighbors? Compare key performance metrics like average monthly revenue, ADR, and occupancy rates in surrounding areas to understand the broader regional STR landscape.
| Market | Active Properties | Monthly Revenue | Daily Rate | Avg. Occupancy |
|---|---|---|---|---|
| Tignano | 10 | $3,870 | $376.27 | 38% |
| Marciano della Chiana | 17 | $3,626 | $494.78 | 34% |
| Castelfranco di Sotto | 50 | $3,092 | $330.87 | 35% |
| Marcialla | 26 | $2,822 | $247.58 | 51% |
| Celleno | 15 | $2,706 | $545.33 | 24% |
| Florence | 10,267 | $2,691 | $215.57 | 51% |
| Monte San Savino | 98 | $2,672 | $344.02 | 39% |
| Impruneta | 144 | $2,644 | $276.31 | 40% |
| Radda in Chianti | 101 | $2,506 | $331.35 | 36% |
| Gaiole in Chianti | 232 | $2,489 | $383.12 | 36% |