Syracuse Airbnb Market Analysis 2026: Short Term Rental Data & Vacation Rental Statistics in Sicily, Italy
Is Airbnb profitable in Syracuse in 2026? Explore comprehensive Airbnb analytics for Syracuse, Sicily, Italy to uncover income potential. This 2026 STR market report for Syracuse, based on AirROI data from February 2025 to January 2026, reveals key trends in the bustling market of 2,383 active listings.
Whether you're considering an Airbnb investment in Syracuse, optimizing your existing vacation rental, or exploring rental arbitrage opportunities, understanding the Syracuse Airbnb data is crucial. Navigating the high regulation landscape is key to maximizing your short term rental income potential. Let's dive into the specifics.
Key Syracuse Airbnb Performance Metrics Overview
Monthly Airbnb Revenue Variations & Income Potential in Syracuse (2026)
Understanding the monthly revenue variations for Airbnb listings in Syracuse is key to maximizing your short term rental income potential. Seasonality significantly impacts earnings. Our analysis, based on data from the past 12 months, shows that the peak revenue month for STRs in Syracuse is typically August, while January often presents the lowest earnings, highlighting opportunities for strategic pricing adjustments during shoulder and low seasons. Explore the typical Airbnb income in Syracuse across different performance tiers:
- Best-in-class properties (Top 10%) achieve $4,253+ monthly, often utilizing dynamic pricing and superior guest experiences.
- Strong performing properties (Top 25%) earn $2,405 or more, indicating effective management and desirable locations/amenities.
- Typical properties (Median) generate around $1,375 per month, representing the average market performance.
- Entry-level properties (Bottom 25%) see earnings around $669, often with potential for optimization.
Average Monthly Airbnb Earnings Trend in Syracuse
Syracuse Airbnb Occupancy Rate Trends (2026)
Maximize your bookings by understanding the Syracuse STR occupancy trends. Seasonal demand shifts significantly influence how often properties are booked. Typically, Augustsees the highest demand (peak season occupancy), while January experiences the lowest (low season). Effective strategies, like adjusting minimum stays or offering promotions, can boost occupancy during slower periods. Here's how different property tiers perform in Syracuse:
- Best-in-class properties (Top 10%) achieve 78%+ occupancy, indicating high desirability and potentially optimized availability.
- Strong performing properties (Top 25%) maintain 61% or higher occupancy, suggesting good market fit and guest satisfaction.
- Typical properties (Median) have an occupancy rate around 39%.
- Entry-level properties (Bottom 25%) average 18% occupancy, potentially facing higher vacancy.
Average Monthly Occupancy Rate Trend in Syracuse
Average Daily Rate (ADR) Airbnb Trends in Syracuse (2026)
Effective short term rental pricing strategy in Syracuse involves understanding monthly ADR fluctuations. The Average Daily Rate (ADR) for Airbnb in Syracuse typically peaks in August and dips lowest during February. Leveraging Airbnb dynamic pricing tools or strategies based on this seasonality can significantly boost revenue. Here's a look at the typical nightly rates achieved:
- Best-in-class properties (Top 10%) command rates of $281+ per night, often due to premium features or locations.
- Strong performing properties (Top 25%) achieve nightly rates of $168 or more.
- Typical properties (Median) charge around $112 per night.
- Entry-level properties (Bottom 25%) earn around $83 per night.
Average Daily Rate (ADR) Trend by Month in Syracuse
Get Live Syracuse Market Intelligence 👇

Explore Real-time Analytics
Airbnb Seasonality Analysis & Trends in Syracuse (2026)
Peak Season (August, July, September)
- Revenue averages $3,033 per month
- Occupancy rates average 53.2%
- Daily rates average $179
Shoulder Season
- Revenue averages $1,920 per month
- Occupancy maintains around 41.3%
- Daily rates hold near $154
Low Season (January, February, December)
- Revenue drops to average $1,061 per month
- Occupancy decreases to average 27.1%
- Daily rates adjust to average $150
Seasonality Insights for Syracuse
- The Airbnb seasonality in Syracuse shows highly seasonal trends requiring careful strategy. While the sections above show seasonal averages, it's also insightful to look at the extremes:
- During the high season, the absolute peak month showcases Syracuse's highest earning potential, with monthly revenues capable of climbing to $3,474, occupancy reaching a high of 57.2%, and ADRs peaking at $185.
- Conversely, the slowest single month of the year, typically falling within the low season, marks the market's lowest point. In this month, revenue might dip to $954, occupancy could drop to 22.8%, and ADRs may adjust down to $144.
- Understanding both the seasonal averages and these monthly peaks and troughs in revenue, occupancy, and ADR is crucial for maximizing your Airbnb profit potential in Syracuse.
Seasonal Strategies for Maximizing Profit
- Peak Season: Maximize revenue through premium pricing and potentially longer minimum stays. Ensure high availability.
- Low Season: Offer competitive pricing, special promotions (e.g., extended stay discounts), and flexible cancellation policies. Target off-season travelers like remote workers or budget-conscious guests.
- Shoulder Seasons: Implement dynamic pricing that balances peak and low rates. Target weekend travelers or specific events. Offer slightly more flexible terms than peak season.
- Regularly analyze your own performance against these Syracuse seasonality benchmarks and adjust your pricing and availability strategy accordingly.
Best Areas for Airbnb Investment in Syracuse (2026)
Exploring the top neighborhoods for short-term rentals in Syracuse? This section highlights key areas, outlining why they are attractive for hosts and guests, along with notable local attractions. Consider these locations based on your target guest profile and investment strategy.
| Neighborhood / Area | Why Host Here? (Target Guests & Appeal) | Key Attractions & Landmarks |
|---|---|---|
| Ortigia | The historical island of Ortigia is the heart of Syracuse, known for its beautiful Baroque architecture and rich history, attracting tourists who seek cultural experiences and stunning seaside views. | Piazza del Duomo, Duarte Fountain, Temple of Apollo, Castello Maniace, Santa Lucia alla Badia, Ortigia Market |
| Neapolis | Neapolis is a vibrant district featuring ancient Greek theater ruins and archaeological sites, appealing to history enthusiasts and tourists looking for exploration in Syracuse. | Greek Theatre, Roman Amphitheatre, Ear of Dionysius, Archaeological Park of Neapolis, Catacombs of San Giovanni |
| Talete | A bustling area known for its local cafes, shops, and proximity to the central market, making it attractive to visitors wanting to experience everyday Sicilian life. | Mercato del Erbe, Piazza Talete, Syracuse Cathedral, local eateries and shops |
| San Giovanni | A tranquil residential area with a lovely atmosphere, appealing to families and those who want a quieter stay while still being close to the city's attractions. | Catacombs of San Giovanni, Parks and gardens, local Sicilian restaurants |
| Plemmirio | Close to the beautiful marine reserve, Plemmirio is favored by nature lovers and beachgoers, with stunning coastal views and outdoor activities. | Plemmirio Marine Park, beautiful beaches, snorkeling and diving spots |
| Fontane Bianche | A popular beach area just outside Syracuse with crystal-clear waters, attracting tourists looking for seaside relaxation and water sports. | White Sands Beach, water sports activities, beach clubs and restaurants |
| Liscia | A scenic coastal area that provides beautiful views and a more laid-back, rural atmosphere, ideal for travelers wanting a peaceful retreat. | coastal walks, local vineyards, picturesque landscapes |
| Viale Tica | A convenient area for both tourists and locals, with a mix of urban living, shopping, and dining options, appealing to those wanting easy access to amenities. | shopping centres, restaurants, public transport hubs |
Understanding Airbnb License Requirements & STR Laws in Syracuse (2026)
Yes, Syracuse, Sicily, Italy enforces high STR regulations. Obtaining a license and ensuring compliance is almost certainly required according to current 2026 STR laws. Always verify the latest short term rental regulations and Airbnb license requirements directly with local government authorities for Syracuse to ensure full compliance before hosting.
(Source: AirROI data, 2026, based on 88% licensed listings)
Top Performing Airbnb Properties in Syracuse (2026)
Benchmark your potential! Explore examples of top-performing Airbnb properties in Syracusebased on Trailing Twelve Month (TTM) revenue. Analyze their characteristics, revenue, occupancy rate, and ADR to understand what drives success in this market.
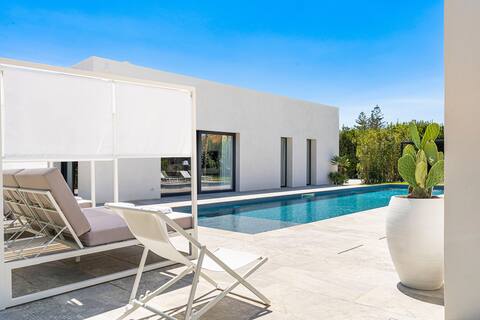
Villa Bonita
Entire Place • 6 bedrooms
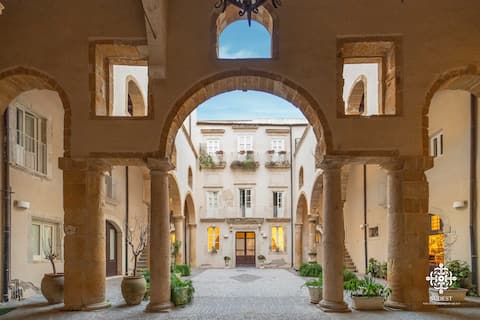
Residenza Dumah - Elegant home in the city center
Entire Place • 3 bedrooms
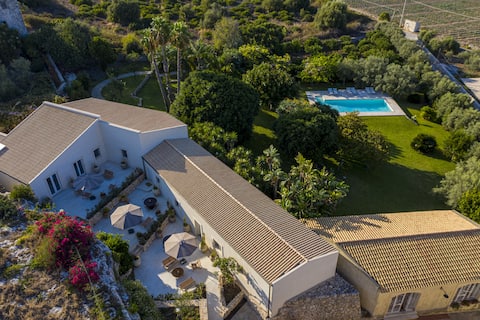
Allisola Country Villa
Entire Place • 5 bedrooms

Casa Maddalena Luxury Apartment
Entire Place • 6 bedrooms
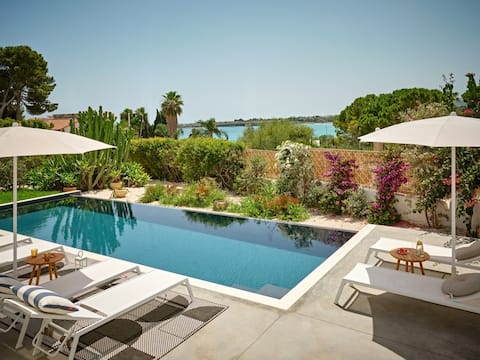
Villa Aria • Rooftop Jacuzzi, Pool & Sea Views
Entire Place • 3 bedrooms

Luxurious penthouse with sunny terrace
Entire Place • 4 bedrooms
Note: Performance varies based on location, size, amenities, seasonality, and management quality. Data reflects the past 12 months.
Top Performing Airbnb Hosts in Syracuse (2026)
Learn from the best! This table showcases top-performing Airbnb hosts in Syracuse based on the number of properties managed and estimated total revenue over the past year. Analyze their scale and performance metrics.
| Host Name | Properties | Grossing Revenue | Stay Reviews | Avg Rating |
|---|---|---|---|---|
| Wonderful Italy Sicilia | 98 | $1,396,597 | 1340 | 4.17/5.0 |
| Davide | 34 | $1,030,594 | 643 | 4.79/5.0 |
| Pierpaolo | 26 | $935,270 | 710 | 4.76/5.0 |
| GuestHost - Welcome To Our Hom | 36 | $810,807 | 2001 | 4.50/5.0 |
| Germana | 22 | $707,722 | 223 | 4.76/5.0 |
| Francesco Ortigia Holidays | 26 | $487,499 | 844 | 4.68/5.0 |
| Giovanna | 11 | $469,600 | 372 | 4.83/5.0 |
| Marianna | 10 | $416,865 | 385 | 4.64/5.0 |
| Cristina | 8 | $408,062 | 77 | 4.87/5.0 |
| Fabrizio | 7 | $360,251 | 495 | 4.85/5.0 |
Analyzing the strategies of top hosts, such as their property selection, pricing, and guest communication, can offer valuable lessons for optimizing your own Airbnb operations in Syracuse.
Dive Deeper: Advanced Syracuse STR Market Data (2026)
Ready to unlock more insights? AirROI provides access to advanced metrics and comprehensive Airbnb data for Syracuse. Explore detailed analytics beyond this report to refine your investment strategy, optimize pricing, and maximize your vacation rental profits.
Explore Advanced MetricsSyracuse Short-Term Rental Market Composition (2026): Property & Room Types
Room Type Distribution
Property Type Distribution
Market Composition Insights for Syracuse
- The Syracuse Airbnb market composition is heavily skewed towards Entire Home/Apt listings, which make up 90.9% of the 2,383 active rentals. This indicates strong guest preference for privacy and space.
- Looking at the property type distribution in Syracuse, Apartment/Condo properties are the most common (58.3%), reflecting the local real estate landscape.
- Houses represent a significant 35.5% portion, catering likely to families or larger groups.
- Smaller segments like hotel/boutique, others, unique stays, outdoor/unique (combined 6.1%) offer potential for unique stay experiences.
Syracuse Airbnb Room Capacity Analysis (2026): Bedroom Distribution
Distribution of Listings by Number of Bedrooms
Room Capacity Insights for Syracuse
- The dominant room capacity in Syracuse is 1 bedroom listings, making up 48.3% of the market. This suggests a strong demand for properties suitable for couples or solo travelers.
- Together, 1 bedroom and 2 bedrooms properties represent 75.7% of the active Airbnb listings in Syracuse, indicating a high concentration in these sizes.
Syracuse Vacation Rental Guest Capacity Trends (2026)
Distribution of Listings by Guest Capacity
Guest Capacity Insights for Syracuse
- The most common guest capacity trend in Syracuse vacation rentals is listings accommodating 4 guests (32.4%). This suggests the primary traveler segment is likely small families or groups.
- Properties designed for 4 guests and 2 guests dominate the Syracuse STR market, accounting for 53.0% of listings.
- 22.6% of properties accommodate 6+ guests, serving the market segment for larger families or group travel in Syracuse.
- On average, properties in Syracuse are equipped to host 4.0 guests.
Syracuse Airbnb Booking Patterns (2026): Available vs. Booked Days
Available Days Distribution
Booked Days Distribution
Booking Pattern Insights for Syracuse
- The most common availability pattern in Syracuse falls within the 271-366 days range, representing 53.2% of listings. This suggests many properties have significant open periods on their calendars.
- Approximately 82.2% of listings show high availability (181+ days open annually), indicating potential for increased bookings or specific owner usage patterns.
- For booked days, the 31-90 days range is most frequent in Syracuse (30.3%), reflecting common guest stay durations or potential owner blocking patterns.
- A notable 19.0% of properties secure long booking periods (181+ days booked per year), highlighting successful long-term rental strategies or significant owner usage.
Syracuse Airbnb Minimum Stay Requirements Analysis
Distribution of Listings by Minimum Night Requirement
1 Night
356 listings
14.9% of total
2 Nights
527 listings
22.1% of total
3 Nights
217 listings
9.1% of total
4-6 Nights
194 listings
8.1% of total
7-29 Nights
131 listings
5.5% of total
30+ Nights
958 listings
40.2% of total
Key Insights
- The most prevalent minimum stay requirement in Syracuse is 30+ Nights, adopted by 40.2% of listings. This highlights the market's preference for longer commitments.
- A significant segment (40.2%) caters to monthly stays (30+ nights) in Syracuse, pointing to opportunities in the extended-stay market.
Recommendations
- Align with the market by considering a 30+ Nights minimum stay, as 40.2% of Syracuse hosts use this setting.
- If feasible, allowing 1-night stays, especially midweek or during low season, could capture last-minute bookings, as only 14.9% currently do.
- Explore offering discounts for stays of 30+ nights to attract the 40.2% of the market seeking extended stays.
- Adjust minimum nights based on seasonality – potentially shorter during low season and longer during peak demand periods in Syracuse.
Syracuse Airbnb Cancellation Policy Trends Analysis (2026)
Super Strict 30 Days
33 listings
1.4% of total
Super Strict 60 Days
36 listings
1.5% of total
Limited
71 listings
3% of total
Flexible
647 listings
27.2% of total
Moderate
1189 listings
50% of total
Firm
329 listings
13.8% of total
Strict
72 listings
3% of total
Cancellation Policy Insights for Syracuse
- The prevailing Airbnb cancellation policy trend in Syracuse is Moderate, used by 50% of listings.
- The market strongly favors guest-friendly terms, with 77.2% of listings offering Flexible or Moderate policies. This suggests guests in Syracuse may expect booking flexibility.
- Strict cancellation policies are quite rare (3%), potentially making listings with this policy less competitive unless justified by high demand or property type.
Recommendations for Hosts
- Consider adopting a Moderate policy to align with the 50% market standard in Syracuse.
- Using a Strict policy might deter some guests, as only 3% of listings use it. Evaluate if potential revenue protection outweighs possible lower booking rates.
- Regularly review your cancellation policy against competitors and market demand shifts in Syracuse.
Syracuse STR Booking Lead Time Analysis (2026)
Average Booking Lead Time by Month
Booking Lead Time Insights for Syracuse
- The overall average booking lead time for vacation rentals in Syracuse is 58 days.
- Guests book furthest in advance for stays during August (average 76 days), likely coinciding with peak travel demand or local events.
- The shortest booking windows occur for stays in February (average 39 days), indicating more last-minute travel plans during this time.
- Seasonally, Summer (64 days avg.) sees the longest lead times, while Winter (41 days avg.) has the shortest, reflecting typical travel planning cycles.
Recommendations for Hosts
- Use the overall average lead time (58 days) as a baseline for your pricing and availability strategy in Syracuse.
- For August stays, consider implementing length-of-stay discounts or slightly higher rates for bookings made less than 76 days out to capitalize on advance planning.
- Target marketing efforts for the Summer season well in advance (at least 64 days) to capture early planners.
- Monitor your own booking lead times against these Syracuse averages to identify opportunities for dynamic pricing adjustments.
Popular & Essential Airbnb Amenities in Syracuse (2026)
Amenity Prevalence
Amenity Insights for Syracuse
- Essential amenities in Syracuse that guests expect include: Air conditioning, Wifi. Lacking these (any) could significantly impact bookings.
- Popular amenities like TV, Hair dryer, Kitchen are common but not universal. Offering these can provide a competitive edge.
Recommendations for Hosts
- Ensure your listing includes all essential amenities for Syracuse: Air conditioning, Wifi.
- Prioritize adding missing essentials: Air conditioning, Wifi.
- Consider adding popular differentiators like TV or Hair dryer to increase appeal.
- Highlight unique or less common amenities you offer (e.g., hot tub, dedicated workspace, EV charger) in your listing description and photos.
- Regularly check competitor amenities in Syracuse to stay competitive.
Syracuse Airbnb Guest Demographics & Profile Analysis (2026)
Guest Profile Summary for Syracuse
- The typical guest profile for Airbnb in Syracuse consists of predominantly international visitors (91%), with top international origins including United Kingdom, typically belonging to the Post-2000s (Gen Z/Alpha) group (50%), primarily speaking English or French.
- Domestic travelers account for 9.5% of guests.
- Key international markets include United States (16.2%) and United Kingdom (16.1%).
- Top languages spoken are English (41.8%) followed by French (14%).
- A significant demographic segment is the Post-2000s (Gen Z/Alpha) group, representing 50% of guests.
Recommendations for Hosts
- Focus marketing internationally, particularly towards travelers from United Kingdom.
- Tailor amenities and listing descriptions to appeal to the dominant Post-2000s (Gen Z/Alpha) demographic (e.g., highlight fast WiFi, smart home features, local guides).
- Highlight unique local experiences or amenities relevant to the primary guest profile.
- Consider seasonal promotions aligned with peak travel times for key origin markets.
Nearby Short-Term Rental Market Comparison
How does the Syracuse Airbnb market stack up against its neighbors? Compare key performance metrics like average monthly revenue, ADR, and occupancy rates in surrounding areas to understand the broader regional STR landscape.
| Market | Active Properties | Monthly Revenue | Daily Rate | Avg. Occupancy |
|---|---|---|---|---|
| Taormina | 1,004 | $2,744 | $247.48 | 48% |
| Trecastagni | 57 | $2,356 | $307.87 | 34% |
| Santa Venerina | 52 | $2,153 | $278.18 | 41% |
| Graniti | 20 | $2,139 | $177.04 | 47% |
| Castelmola | 57 | $2,128 | $232.99 | 48% |
| Għasri | 66 | $1,973 | $219.61 | 38% |
| Valverde | 15 | $1,963 | $212.22 | 34% |
| Piedimonte Etneo | 74 | $1,928 | $225.24 | 36% |
| San Marco d'Alunzio | 11 | $1,912 | $199.80 | 35% |
| Caronia | 43 | $1,883 | $191.71 | 40% |