Noto Airbnb Market Analysis 2026: Short Term Rental Data & Vacation Rental Statistics in Sicily, Italy
Is Airbnb profitable in Noto in 2026? Explore comprehensive Airbnb analytics for Noto, Sicily, Italy to uncover income potential. This 2026 STR market report for Noto, based on AirROI data from February 2025 to January 2026, reveals key trends in the market of 881 active listings.
Whether you're considering an Airbnb investment in Noto, optimizing your existing vacation rental, or exploring rental arbitrage opportunities, understanding the Noto Airbnb data is crucial. Navigating the high regulation landscape is key to maximizing your short term rental income potential. Let's dive into the specifics.
Key Noto Airbnb Performance Metrics Overview
Monthly Airbnb Revenue Variations & Income Potential in Noto (2026)
Understanding the monthly revenue variations for Airbnb listings in Noto is key to maximizing your short term rental income potential. Seasonality significantly impacts earnings. Our analysis, based on data from the past 12 months, shows that the peak revenue month for STRs in Noto is typically August, while January often presents the lowest earnings, highlighting opportunities for strategic pricing adjustments during shoulder and low seasons. Explore the typical Airbnb income in Noto across different performance tiers:
- Best-in-class properties (Top 10%) achieve $6,242+ monthly, often utilizing dynamic pricing and superior guest experiences.
- Strong performing properties (Top 25%) earn $2,941 or more, indicating effective management and desirable locations/amenities.
- Typical properties (Median) generate around $1,345 per month, representing the average market performance.
- Entry-level properties (Bottom 25%) see earnings around $589, often with potential for optimization.
Average Monthly Airbnb Earnings Trend in Noto
Noto Airbnb Occupancy Rate Trends (2026)
Maximize your bookings by understanding the Noto STR occupancy trends. Seasonal demand shifts significantly influence how often properties are booked. Typically, Augustsees the highest demand (peak season occupancy), while January experiences the lowest (low season). Effective strategies, like adjusting minimum stays or offering promotions, can boost occupancy during slower periods. Here's how different property tiers perform in Noto:
- Best-in-class properties (Top 10%) achieve 72%+ occupancy, indicating high desirability and potentially optimized availability.
- Strong performing properties (Top 25%) maintain 53% or higher occupancy, suggesting good market fit and guest satisfaction.
- Typical properties (Median) have an occupancy rate around 31%.
- Entry-level properties (Bottom 25%) average 15% occupancy, potentially facing higher vacancy.
Average Monthly Occupancy Rate Trend in Noto
Average Daily Rate (ADR) Airbnb Trends in Noto (2026)
Effective short term rental pricing strategy in Noto involves understanding monthly ADR fluctuations. The Average Daily Rate (ADR) for Airbnb in Noto typically peaks in August and dips lowest during March. Leveraging Airbnb dynamic pricing tools or strategies based on this seasonality can significantly boost revenue. Here's a look at the typical nightly rates achieved:
- Best-in-class properties (Top 10%) command rates of $420+ per night, often due to premium features or locations.
- Strong performing properties (Top 25%) achieve nightly rates of $215 or more.
- Typical properties (Median) charge around $128 per night.
- Entry-level properties (Bottom 25%) earn around $90 per night.
Average Daily Rate (ADR) Trend by Month in Noto
Get Live Noto Market Intelligence 👇

Explore Real-time Analytics
Airbnb Seasonality Analysis & Trends in Noto (2026)
Peak Season (August, July, September)
- Revenue averages $3,894 per month
- Occupancy rates average 48.4%
- Daily rates average $218
Shoulder Season
- Revenue averages $2,313 per month
- Occupancy maintains around 35.1%
- Daily rates hold near $188
Low Season (January, February, December)
- Revenue drops to average $1,257 per month
- Occupancy decreases to average 21.5%
- Daily rates adjust to average $192
Seasonality Insights for Noto
- The Airbnb seasonality in Noto shows highly seasonal trends requiring careful strategy. While the sections above show seasonal averages, it's also insightful to look at the extremes:
- During the high season, the absolute peak month showcases Noto's highest earning potential, with monthly revenues capable of climbing to $4,664, occupancy reaching a high of 54.4%, and ADRs peaking at $226.
- Conversely, the slowest single month of the year, typically falling within the low season, marks the market's lowest point. In this month, revenue might dip to $1,194, occupancy could drop to 19.0%, and ADRs may adjust down to $175.
- Understanding both the seasonal averages and these monthly peaks and troughs in revenue, occupancy, and ADR is crucial for maximizing your Airbnb profit potential in Noto.
Seasonal Strategies for Maximizing Profit
- Peak Season: Maximize revenue through premium pricing and potentially longer minimum stays. Ensure high availability.
- Low Season: Offer competitive pricing, special promotions (e.g., extended stay discounts), and flexible cancellation policies. Target off-season travelers like remote workers or budget-conscious guests.
- Shoulder Seasons: Implement dynamic pricing that balances peak and low rates. Target weekend travelers or specific events. Offer slightly more flexible terms than peak season.
- Regularly analyze your own performance against these Noto seasonality benchmarks and adjust your pricing and availability strategy accordingly.
Best Areas for Airbnb Investment in Noto (2026)
Exploring the top neighborhoods for short-term rentals in Noto? This section highlights key areas, outlining why they are attractive for hosts and guests, along with notable local attractions. Consider these locations based on your target guest profile and investment strategy.
| Neighborhood / Area | Why Host Here? (Target Guests & Appeal) | Key Attractions & Landmarks |
|---|---|---|
| Centro Storico | The historical center of Noto, renowned for its stunning Baroque architecture and charming streets. Perfect for tourists wanting to immerse themselves in the culture and history of Sicily. | Noto Cathedral, Palazzo Nicolaci, Church of San Domenico, Corso Vittorio Emanuele, Villa Comunale, Noto Antica |
| La Cattedrale | A picturesque area close to the beautiful Cathedral of Noto, offering a range of local cafes and shops. Ideal for visitors looking to enjoy the serene atmosphere and stunning views. | Noto Cathedral, Giardino di Pietra, Piazza Municipio, Palazzo Ducezio, Local trattorias |
| Spiaggia di Noto | Noto Beach is known for its golden sands and clear waters, attracting beach lovers and families during the summer months. A great spot for those looking for a relaxing beach vacation. | Noto Marina, Golden Sands, Lido di Noto, Beach clubs, Seaside restaurants |
| Vendicari Nature Reserve | An untouched natural area that attracts nature lovers, bird watchers, and those looking for a serene getaway. Perfect for eco-tourism and outdoor activities. | Vendicari Nature Reserve, Calamosche Beach, Ancient Tonnara di Vendicari, Birdwatching trails, Scenic hiking routes |
| Isola delle Correnti | Famous for its stunning sunsets and unique geographical features, this area is a favorite for couples and photographers. A peaceful escape close to the coast. | Isola delle Correnti Beach, Local fishing villages, Sunset views, Scenic landscapes |
| Pachino | Just a short drive from Noto, Pachino is known for its tomatoes and local markets, making it a great area for those interested in local cuisine and culture. | Pachino Tomato Festival, Local markets, Nearby beaches, Agricultural tours |
| Avola | A neighboring town famous for its delicious wines and beautiful beaches. Avola has a laid-back vibe and is popular among tourists looking to explore the local wine culture. | Avola Beach, Nero d'Avola Wine, Local wineries, Cultural festivals |
| Marzamemi | A charming fishing village famous for its colorful houses and vibrant squares. Ideal for visitors looking for authentic Sicilian charm and seafood dining. | Marzamemi Square, Old Tonnara, Local restaurants, Vibrant nightlife |
Understanding Airbnb License Requirements & STR Laws in Noto (2026)
Yes, Noto, Sicily, Italy enforces high STR regulations. Obtaining a license and ensuring compliance is almost certainly required according to current 2026 STR laws. Always verify the latest short term rental regulations and Airbnb license requirements directly with local government authorities for Noto to ensure full compliance before hosting.
(Source: AirROI data, 2026, based on 85% licensed listings)
Top Performing Airbnb Properties in Noto (2026)
Benchmark your potential! Explore examples of top-performing Airbnb properties in Notobased on Trailing Twelve Month (TTM) revenue. Analyze their characteristics, revenue, occupancy rate, and ADR to understand what drives success in this market.

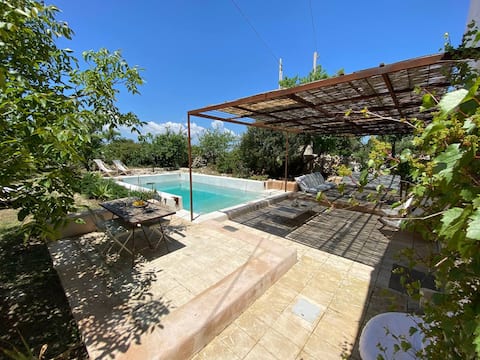
Villa with stunning views of Vendicari and Noto
Entire Place • 6 bedrooms
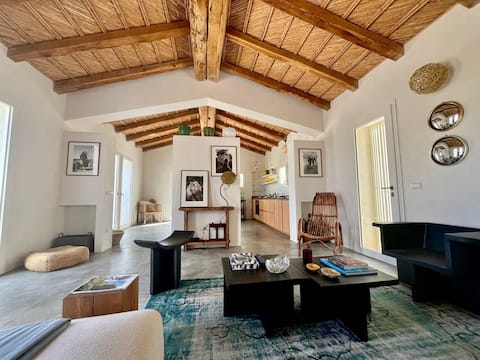
Casa Balat
Entire Place • 3 bedrooms

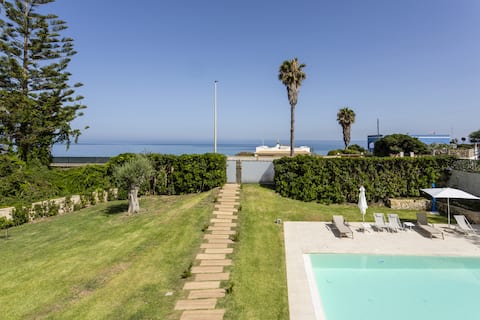
Luxury Villa between Noto and Syracuse
Entire Place • 7 bedrooms
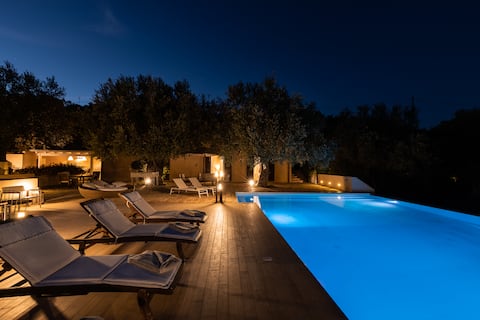
Gioi - Villa with pool in Noto
Entire Place • 4 bedrooms
Eos' Residence
Entire Place • 7 bedrooms
Luxury Villa with pool - private property
Entire Place • 3 bedrooms
Note: Performance varies based on location, size, amenities, seasonality, and management quality. Data reflects the past 12 months.
Top Performing Airbnb Hosts in Noto (2026)
Learn from the best! This table showcases top-performing Airbnb hosts in Noto based on the number of properties managed and estimated total revenue over the past year. Analyze their scale and performance metrics.
| Host Name | Properties | Grossing Revenue | Stay Reviews | Avg Rating |
|---|---|---|---|---|
| Nunzio | 16 | $757,301 | 77 | 4.88/5.0 |
| IsulaTravel | 8 | $491,134 | 134 | 4.80/5.0 |
| Siculus | 14 | $417,939 | 398 | 4.87/5.0 |
| Tiziana | 10 | $409,903 | 394 | 4.79/5.0 |
| Roberto | 4 | $344,708 | 219 | 4.91/5.0 |
| Ivan | 5 | $333,097 | 204 | 4.72/5.0 |
| Cristina | 10 | $296,050 | 26 | 4.71/5.0 |
| Martina | 2 | $236,520 | 79 | 4.88/5.0 |
| Gioacchino | 4 | $210,289 | 129 | 4.96/5.0 |
| Wonderful Italy Sicilia | 17 | $205,437 | 225 | 4.35/5.0 |
Analyzing the strategies of top hosts, such as their property selection, pricing, and guest communication, can offer valuable lessons for optimizing your own Airbnb operations in Noto.
Dive Deeper: Advanced Noto STR Market Data (2026)
Ready to unlock more insights? AirROI provides access to advanced metrics and comprehensive Airbnb data for Noto. Explore detailed analytics beyond this report to refine your investment strategy, optimize pricing, and maximize your vacation rental profits.
Explore Advanced MetricsNoto Short-Term Rental Market Composition (2026): Property & Room Types
Room Type Distribution
Property Type Distribution
Market Composition Insights for Noto
- The Noto Airbnb market composition is heavily skewed towards Entire Home/Apt listings, which make up 91.9% of the 881 active rentals. This indicates strong guest preference for privacy and space.
- Looking at the property type distribution in Noto, House properties are the most common (60%), reflecting the local real estate landscape.
- Houses represent a significant 60% portion, catering likely to families or larger groups.
- Smaller segments like outdoor/unique, hotel/boutique, others, unique stays (combined 10.3%) offer potential for unique stay experiences.
Noto Airbnb Room Capacity Analysis (2026): Bedroom Distribution
Distribution of Listings by Number of Bedrooms
Room Capacity Insights for Noto
- The dominant room capacity in Noto is 2 bedrooms listings, making up 36.1% of the market. This suggests a strong demand for properties suitable for couples or solo travelers.
- Together, 2 bedrooms and 1 bedroom properties represent 67.0% of the active Airbnb listings in Noto, indicating a high concentration in these sizes.
- A significant 25.5% of listings offer 3+ bedrooms, catering to larger groups and families seeking more space in Noto.
Noto Vacation Rental Guest Capacity Trends (2026)
Distribution of Listings by Guest Capacity
Guest Capacity Insights for Noto
- The most common guest capacity trend in Noto vacation rentals is listings accommodating 4 guests (27.7%). This suggests the primary traveler segment is likely small families or groups.
- Properties designed for 4 guests and 6 guests dominate the Noto STR market, accounting for 44.0% of listings.
- 32.1% of properties accommodate 6+ guests, serving the market segment for larger families or group travel in Noto.
- On average, properties in Noto are equipped to host 4.4 guests.
Noto Airbnb Booking Patterns (2026): Available vs. Booked Days
Available Days Distribution
Booked Days Distribution
Booking Pattern Insights for Noto
- The most common availability pattern in Noto falls within the 271-366 days range, representing 66.6% of listings. This suggests many properties have significant open periods on their calendars.
- Approximately 91.8% of listings show high availability (181+ days open annually), indicating potential for increased bookings or specific owner usage patterns.
- For booked days, the 31-90 days range is most frequent in Noto (34.5%), reflecting common guest stay durations or potential owner blocking patterns.
- A notable 8.8% of properties secure long booking periods (181+ days booked per year), highlighting successful long-term rental strategies or significant owner usage.
Noto Airbnb Minimum Stay Requirements Analysis
Distribution of Listings by Minimum Night Requirement
1 Night
80 listings
9.1% of total
2 Nights
103 listings
11.7% of total
3 Nights
61 listings
6.9% of total
4-6 Nights
161 listings
18.3% of total
7-29 Nights
100 listings
11.4% of total
30+ Nights
376 listings
42.7% of total
Key Insights
- The most prevalent minimum stay requirement in Noto is 30+ Nights, adopted by 42.7% of listings. This highlights the market's preference for longer commitments.
- A significant segment (42.7%) caters to monthly stays (30+ nights) in Noto, pointing to opportunities in the extended-stay market.
Recommendations
- Align with the market by considering a 30+ Nights minimum stay, as 42.7% of Noto hosts use this setting.
- If feasible, allowing 1-night stays, especially midweek or during low season, could capture last-minute bookings, as only 9.1% currently do.
- Explore offering discounts for stays of 30+ nights to attract the 42.7% of the market seeking extended stays.
- Adjust minimum nights based on seasonality – potentially shorter during low season and longer during peak demand periods in Noto.
Noto Airbnb Cancellation Policy Trends Analysis (2026)
Super Strict 60 Days
69 listings
7.8% of total
Super Strict 30 Days
22 listings
2.5% of total
Limited
8 listings
0.9% of total
Flexible
184 listings
20.9% of total
Moderate
307 listings
34.9% of total
Firm
214 listings
24.3% of total
Strict
76 listings
8.6% of total
Cancellation Policy Insights for Noto
- The prevailing Airbnb cancellation policy trend in Noto is Moderate, used by 34.9% of listings.
- There's a relatively balanced mix between guest-friendly (55.8%) and stricter (32.9%) policies, offering choices for different guest needs.
- Strict cancellation policies are quite rare (8.6%), potentially making listings with this policy less competitive unless justified by high demand or property type.
Recommendations for Hosts
- Consider adopting a Moderate policy to align with the 34.9% market standard in Noto.
- Using a Strict policy might deter some guests, as only 8.6% of listings use it. Evaluate if potential revenue protection outweighs possible lower booking rates.
- Regularly review your cancellation policy against competitors and market demand shifts in Noto.
Noto STR Booking Lead Time Analysis (2026)
Average Booking Lead Time by Month
Booking Lead Time Insights for Noto
- The overall average booking lead time for vacation rentals in Noto is 60 days.
- Guests book furthest in advance for stays during August (average 83 days), likely coinciding with peak travel demand or local events.
- The shortest booking windows occur for stays in January (average 31 days), indicating more last-minute travel plans during this time.
- Seasonally, Summer (67 days avg.) sees the longest lead times, while Winter (35 days avg.) has the shortest, reflecting typical travel planning cycles.
Recommendations for Hosts
- Use the overall average lead time (60 days) as a baseline for your pricing and availability strategy in Noto.
- For August stays, consider implementing length-of-stay discounts or slightly higher rates for bookings made less than 83 days out to capitalize on advance planning.
- Target marketing efforts for the Summer season well in advance (at least 67 days) to capture early planners.
- Monitor your own booking lead times against these Noto averages to identify opportunities for dynamic pricing adjustments.
Popular & Essential Airbnb Amenities in Noto (2026)
Amenity Prevalence
Amenity Insights for Noto
- Essential amenities in Noto that guests expect include: Air conditioning. Lacking these (this) could significantly impact bookings.
- Popular amenities like Hair dryer, Wifi, Kitchen are common but not universal. Offering these can provide a competitive edge.
- Warning: Wifi is not universally provided but is considered essential globally. Ensure reliable Wifi is offered.
Recommendations for Hosts
- Ensure your listing includes all essential amenities for Noto: Air conditioning.
- Prioritize adding missing essentials: Air conditioning.
- Consider adding popular differentiators like Hair dryer or Wifi to increase appeal.
- Highlight unique or less common amenities you offer (e.g., hot tub, dedicated workspace, EV charger) in your listing description and photos.
- Regularly check competitor amenities in Noto to stay competitive.
Noto Airbnb Guest Demographics & Profile Analysis (2026)
Guest Profile Summary for Noto
- The typical guest profile for Airbnb in Noto consists of predominantly international visitors (86%), with top international origins including Germany, typically belonging to the Post-2000s (Gen Z/Alpha) group (50%), primarily speaking English or French.
- Domestic travelers account for 13.8% of guests.
- Key international markets include United Kingdom (16.3%) and Germany (14.6%).
- Top languages spoken are English (40.3%) followed by French (13.6%).
- A significant demographic segment is the Post-2000s (Gen Z/Alpha) group, representing 50% of guests.
Recommendations for Hosts
- Focus marketing internationally, particularly towards travelers from Germany.
- Tailor amenities and listing descriptions to appeal to the dominant Post-2000s (Gen Z/Alpha) demographic (e.g., highlight fast WiFi, smart home features, local guides).
- Highlight unique local experiences or amenities relevant to the primary guest profile.
- Consider seasonal promotions aligned with peak travel times for key origin markets.
Nearby Short-Term Rental Market Comparison
How does the Noto Airbnb market stack up against its neighbors? Compare key performance metrics like average monthly revenue, ADR, and occupancy rates in surrounding areas to understand the broader regional STR landscape.
| Market | Active Properties | Monthly Revenue | Daily Rate | Avg. Occupancy |
|---|---|---|---|---|
| Mdina | 16 | $3,124 | $218.25 | 57% |
| Taormina | 1,004 | $2,744 | $247.48 | 48% |
| Valletta | 604 | $2,598 | $187.70 | 53% |
| Mellieħa | 455 | $2,387 | $181.28 | 51% |
| Trecastagni | 57 | $2,356 | $307.87 | 34% |
| Senglea | 106 | $2,216 | $142.33 | 60% |
| Żejtun | 44 | $2,210 | $189.49 | 45% |
| Santa Venerina | 52 | $2,153 | $278.18 | 41% |
| Birgu | 108 | $2,141 | $156.24 | 57% |
| Graniti | 20 | $2,139 | $177.04 | 47% |