Menfi Airbnb Market Analysis 2026: Short Term Rental Data & Vacation Rental Statistics in Sicily, Italy
Is Airbnb profitable in Menfi in 2026? Explore comprehensive Airbnb analytics for Menfi, Sicily, Italy to uncover income potential. This 2026 STR market report for Menfi, based on AirROI data from February 2025 to January 2026, reveals key trends in the niche market of 170 active listings.
Whether you're considering an Airbnb investment in Menfi, optimizing your existing vacation rental, or exploring rental arbitrage opportunities, understanding the Menfi Airbnb data is crucial. Navigating the high regulation landscape is key to maximizing your short term rental income potential. Let's dive into the specifics.
Key Menfi Airbnb Performance Metrics Overview
Monthly Airbnb Revenue Variations & Income Potential in Menfi (2026)
Understanding the monthly revenue variations for Airbnb listings in Menfi is key to maximizing your short term rental income potential. Seasonality significantly impacts earnings. Our analysis, based on data from the past 12 months, shows that the peak revenue month for STRs in Menfi is typically August, while January often presents the lowest earnings, highlighting opportunities for strategic pricing adjustments during shoulder and low seasons. Explore the typical Airbnb income in Menfi across different performance tiers:
- Best-in-class properties (Top 10%) achieve $4,533+ monthly, often utilizing dynamic pricing and superior guest experiences.
- Strong performing properties (Top 25%) earn $2,773 or more, indicating effective management and desirable locations/amenities.
- Typical properties (Median) generate around $1,368 per month, representing the average market performance.
- Entry-level properties (Bottom 25%) see earnings around $534, often with potential for optimization.
Average Monthly Airbnb Earnings Trend in Menfi
Menfi Airbnb Occupancy Rate Trends (2026)
Maximize your bookings by understanding the Menfi STR occupancy trends. Seasonal demand shifts significantly influence how often properties are booked. Typically, Augustsees the highest demand (peak season occupancy), while January experiences the lowest (low season). Effective strategies, like adjusting minimum stays or offering promotions, can boost occupancy during slower periods. Here's how different property tiers perform in Menfi:
- Best-in-class properties (Top 10%) achieve 74%+ occupancy, indicating high desirability and potentially optimized availability.
- Strong performing properties (Top 25%) maintain 53% or higher occupancy, suggesting good market fit and guest satisfaction.
- Typical properties (Median) have an occupancy rate around 29%.
- Entry-level properties (Bottom 25%) average 13% occupancy, potentially facing higher vacancy.
Average Monthly Occupancy Rate Trend in Menfi
Average Daily Rate (ADR) Airbnb Trends in Menfi (2026)
Effective short term rental pricing strategy in Menfi involves understanding monthly ADR fluctuations. The Average Daily Rate (ADR) for Airbnb in Menfi typically peaks in August and dips lowest during March. Leveraging Airbnb dynamic pricing tools or strategies based on this seasonality can significantly boost revenue. Here's a look at the typical nightly rates achieved:
- Best-in-class properties (Top 10%) command rates of $318+ per night, often due to premium features or locations.
- Strong performing properties (Top 25%) achieve nightly rates of $194 or more.
- Typical properties (Median) charge around $134 per night.
- Entry-level properties (Bottom 25%) earn around $96 per night.
Average Daily Rate (ADR) Trend by Month in Menfi
Get Live Menfi Market Intelligence 👇

Explore Real-time Analytics
Airbnb Seasonality Analysis & Trends in Menfi (2026)
Peak Season (August, July, September)
- Revenue averages $3,369 per month
- Occupancy rates average 48.5%
- Daily rates average $190
Shoulder Season
- Revenue averages $1,820 per month
- Occupancy maintains around 33.8%
- Daily rates hold near $163
Low Season (January, February, December)
- Revenue drops to average $1,113 per month
- Occupancy decreases to average 24.1%
- Daily rates adjust to average $161
Seasonality Insights for Menfi
- The Airbnb seasonality in Menfi shows highly seasonal trends requiring careful strategy. While the sections above show seasonal averages, it's also insightful to look at the extremes:
- During the high season, the absolute peak month showcases Menfi's highest earning potential, with monthly revenues capable of climbing to $3,915, occupancy reaching a high of 55.6%, and ADRs peaking at $195.
- Conversely, the slowest single month of the year, typically falling within the low season, marks the market's lowest point. In this month, revenue might dip to $992, occupancy could drop to 22.8%, and ADRs may adjust down to $151.
- Understanding both the seasonal averages and these monthly peaks and troughs in revenue, occupancy, and ADR is crucial for maximizing your Airbnb profit potential in Menfi.
Seasonal Strategies for Maximizing Profit
- Peak Season: Maximize revenue through premium pricing and potentially longer minimum stays. Ensure high availability.
- Low Season: Offer competitive pricing, special promotions (e.g., extended stay discounts), and flexible cancellation policies. Target off-season travelers like remote workers or budget-conscious guests.
- Shoulder Seasons: Implement dynamic pricing that balances peak and low rates. Target weekend travelers or specific events. Offer slightly more flexible terms than peak season.
- Regularly analyze your own performance against these Menfi seasonality benchmarks and adjust your pricing and availability strategy accordingly.
Best Areas for Airbnb Investment in Menfi (2026)
Exploring the top neighborhoods for short-term rentals in Menfi? This section highlights key areas, outlining why they are attractive for hosts and guests, along with notable local attractions. Consider these locations based on your target guest profile and investment strategy.
| Neighborhood / Area | Why Host Here? (Target Guests & Appeal) | Key Attractions & Landmarks |
|---|---|---|
| Montalbano Elio | Charming coastal area famous for its stunning beaches and proximity to numerous archaeological sites. Ideal for tourists looking to enjoy the serene Sicilian coast combined with cultural exploration. | Capo Beach, Montalbano Archeological Park, Spiaggia di Bertolino, Scopello, Ancient Greek Temple |
| Menfi Marina | A vibrant marina area that offers beautiful beaches and water activities. Attracts families and beachgoers looking for relaxation and fun in the sun. | Menfi Beach, Lido Fiori, Marina di Menfi, Sea kayaking, Local seafood restaurants |
| Sciacca | Nearby town known for its thermal baths and rich history. A great alternative for guests interested in wellness and historical sights. | Sciacca Thermal Baths, Castello Luna, The Old Town, Via Francesco Crispi, Famous local ceramics |
| Selinunte | Home to some of the most important Greek ruins in the world. Perfect for history buffs and tourists interested in archaeology. | Selinunte Archaeological Park, Greek Temples, Cave di Cusa, Beach at Selinunte, Local wine tours |
| Porto Palo | A picturesque seaside village that is perfect for those seeking tranquility and beautiful sunsets. Great for couples and families alike. | Porto Palo Beach, Tonnara di Sciacca, Beach clubs, Culinary experiences, Outdoor activities |
| Menfi City Center | Cultural hub of Menfi offering local markets, shops, and eateries. Ideal for travelers looking to experience everyday Sicilian life. | Piazza Vittorio Emanuele, Local historical sites, Restaurants and cafes, Cultural events, Artisan shops |
| Castelvetrano | A small town nearby known for its famous olives and as a gateway to the Valley of the Temples. Attracts foodies and history lovers. | Valley of the Temples, Castelvetrano olives, Historical sites, Local vineyards, Farmers markets |
| Cefalù (Nearby) | While slightly farther away, Cefalù is a stunning medieval town with beach access and captivating historical architecture, providing a richer experience for tourists. | Cefalù Cathedral, La Rocca, Cefalù Beach, Old Town streets, Local artisan shops |
Understanding Airbnb License Requirements & STR Laws in Menfi (2026)
Yes, Menfi, Sicily, Italy enforces high STR regulations. Obtaining a license and ensuring compliance is almost certainly required according to current 2026 STR laws. Always verify the latest short term rental regulations and Airbnb license requirements directly with local government authorities for Menfi to ensure full compliance before hosting.
(Source: AirROI data, 2026, based on 82% licensed listings)
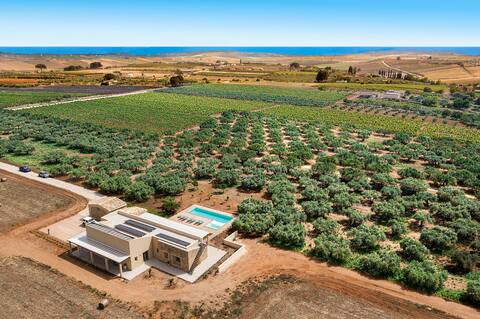
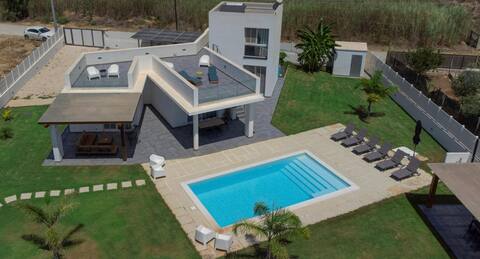
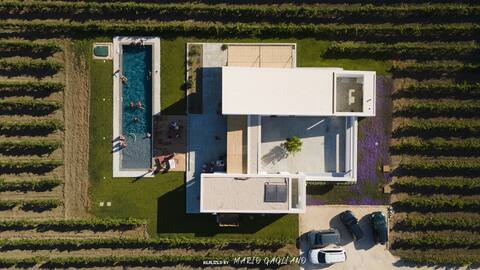
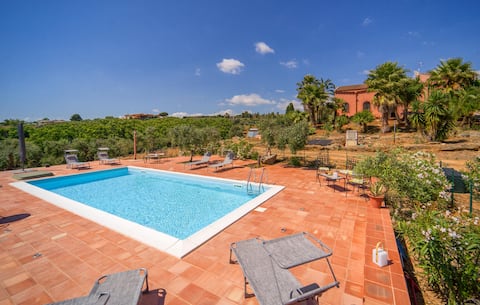
Top Performing Airbnb Properties in Menfi (2026)
Benchmark your potential! Explore examples of top-performing Airbnb properties in Menfibased on Trailing Twelve Month (TTM) revenue. Analyze their characteristics, revenue, occupancy rate, and ADR to understand what drives success in this market.
Cavalè
Entire Place • 4 bedrooms

The Green Window
Entire Place • 3 bedrooms
The White Pearl
Entire Place • 3 bedrooms
Villa del Capitano Luxury contemporary Villa
Entire Place • 2 bedrooms
Gorgeous home in Menfi with WiFi
Entire Place • 3 bedrooms
Beautiful home in Menfi
Entire Place • 3 bedrooms
Note: Performance varies based on location, size, amenities, seasonality, and management quality. Data reflects the past 12 months.
Top Performing Airbnb Hosts in Menfi (2026)
Learn from the best! This table showcases top-performing Airbnb hosts in Menfi based on the number of properties managed and estimated total revenue over the past year. Analyze their scale and performance metrics.
| Host Name | Properties | Grossing Revenue | Stay Reviews | Avg Rating |
|---|---|---|---|---|
| Magali Angèle | 4 | $110,967 | 152 | 4.96/5.0 |
| Nunzio | 1 | $101,341 | 8 | 5.00/5.0 |
| Pia Cossyra Desirè | 2 | $79,179 | 35 | 4.95/5.0 |
| Novasol | 1 | $78,507 | 23 | 4.78/5.0 |
| Giuseppe | 1 | $75,717 | 65 | 5.00/5.0 |
| Daniela | 2 | $74,403 | 44 | 5.00/5.0 |
| Novasol | 4 | $71,221 | 21 | 4.27/5.0 |
| Giovanni | 2 | $70,108 | 136 | 4.97/5.0 |
| Novasol | 1 | $65,138 | 5 | 4.40/5.0 |
| Novasol | 1 | $63,824 | 3 | 4.33/5.0 |
Analyzing the strategies of top hosts, such as their property selection, pricing, and guest communication, can offer valuable lessons for optimizing your own Airbnb operations in Menfi.
Dive Deeper: Advanced Menfi STR Market Data (2026)
Ready to unlock more insights? AirROI provides access to advanced metrics and comprehensive Airbnb data for Menfi. Explore detailed analytics beyond this report to refine your investment strategy, optimize pricing, and maximize your vacation rental profits.
Explore Advanced MetricsMenfi Short-Term Rental Market Composition (2026): Property & Room Types
Room Type Distribution
Property Type Distribution
Market Composition Insights for Menfi
- The Menfi Airbnb market composition is heavily skewed towards Entire Home/Apt listings, which make up 94.7% of the 170 active rentals. This indicates strong guest preference for privacy and space.
- Looking at the property type distribution in Menfi, House properties are the most common (68.8%), reflecting the local real estate landscape.
- Houses represent a significant 68.8% portion, catering likely to families or larger groups.
- Smaller segments like hotel/boutique, outdoor/unique (combined 4.8%) offer potential for unique stay experiences.
Menfi Airbnb Room Capacity Analysis (2026): Bedroom Distribution
Distribution of Listings by Number of Bedrooms
Room Capacity Insights for Menfi
- The dominant room capacity in Menfi is 2 bedrooms listings, making up 48.8% of the market. This suggests a strong demand for properties suitable for couples or solo travelers.
- Together, 2 bedrooms and 3 bedrooms properties represent 72.3% of the active Airbnb listings in Menfi, indicating a high concentration in these sizes.
- A significant 27.6% of listings offer 3+ bedrooms, catering to larger groups and families seeking more space in Menfi.
Menfi Vacation Rental Guest Capacity Trends (2026)
Distribution of Listings by Guest Capacity
Guest Capacity Insights for Menfi
- The most common guest capacity trend in Menfi vacation rentals is listings accommodating 4 guests (35.3%). This suggests the primary traveler segment is likely small families or groups.
- Properties designed for 4 guests and 6 guests dominate the Menfi STR market, accounting for 55.3% of listings.
- 35.8% of properties accommodate 6+ guests, serving the market segment for larger families or group travel in Menfi.
- On average, properties in Menfi are equipped to host 4.9 guests.
Menfi Airbnb Booking Patterns (2026): Available vs. Booked Days
Available Days Distribution
Booked Days Distribution
Booking Pattern Insights for Menfi
- The most common availability pattern in Menfi falls within the 271-366 days range, representing 72.4% of listings. This suggests many properties have significant open periods on their calendars.
- Approximately 92.4% of listings show high availability (181+ days open annually), indicating potential for increased bookings or specific owner usage patterns.
- For booked days, the 1-30 days range is most frequent in Menfi (44.1%), reflecting common guest stay durations or potential owner blocking patterns.
- A notable 8.3% of properties secure long booking periods (181+ days booked per year), highlighting successful long-term rental strategies or significant owner usage.
Menfi Airbnb Minimum Stay Requirements Analysis
Distribution of Listings by Minimum Night Requirement
1 Night
19 listings
11.2% of total
2 Nights
15 listings
8.8% of total
3 Nights
17 listings
10% of total
4-6 Nights
29 listings
17.1% of total
7-29 Nights
21 listings
12.4% of total
30+ Nights
69 listings
40.6% of total
Key Insights
- The most prevalent minimum stay requirement in Menfi is 30+ Nights, adopted by 40.6% of listings. This highlights the market's preference for longer commitments.
- A significant segment (40.6%) caters to monthly stays (30+ nights) in Menfi, pointing to opportunities in the extended-stay market.
Recommendations
- Align with the market by considering a 30+ Nights minimum stay, as 40.6% of Menfi hosts use this setting.
- If feasible, allowing 1-night stays, especially midweek or during low season, could capture last-minute bookings, as only 11.2% currently do.
- Explore offering discounts for stays of 30+ nights to attract the 40.6% of the market seeking extended stays.
- Adjust minimum nights based on seasonality – potentially shorter during low season and longer during peak demand periods in Menfi.
Menfi Airbnb Cancellation Policy Trends Analysis (2026)
Limited
1 listings
0.6% of total
Super Strict 60 Days
26 listings
15.3% of total
Super Strict 30 Days
5 listings
2.9% of total
Flexible
38 listings
22.4% of total
Moderate
48 listings
28.2% of total
Firm
40 listings
23.5% of total
Strict
12 listings
7.1% of total
Cancellation Policy Insights for Menfi
- The prevailing Airbnb cancellation policy trend in Menfi is Moderate, used by 28.2% of listings.
- There's a relatively balanced mix between guest-friendly (50.6%) and stricter (30.6%) policies, offering choices for different guest needs.
- Strict cancellation policies are quite rare (7.1%), potentially making listings with this policy less competitive unless justified by high demand or property type.
Recommendations for Hosts
- Consider adopting a Moderate policy to align with the 28.2% market standard in Menfi.
- Using a Strict policy might deter some guests, as only 7.1% of listings use it. Evaluate if potential revenue protection outweighs possible lower booking rates.
- Regularly review your cancellation policy against competitors and market demand shifts in Menfi.
Menfi STR Booking Lead Time Analysis (2026)
Average Booking Lead Time by Month
Booking Lead Time Insights for Menfi
- The overall average booking lead time for vacation rentals in Menfi is 61 days.
- Guests book furthest in advance for stays during August (average 104 days), likely coinciding with peak travel demand or local events.
- The shortest booking windows occur for stays in December (average 19 days), indicating more last-minute travel plans during this time.
- Seasonally, Summer (74 days avg.) sees the longest lead times, while Winter (31 days avg.) has the shortest, reflecting typical travel planning cycles.
Recommendations for Hosts
- Use the overall average lead time (61 days) as a baseline for your pricing and availability strategy in Menfi.
- For August stays, consider implementing length-of-stay discounts or slightly higher rates for bookings made less than 104 days out to capitalize on advance planning.
- Target marketing efforts for the Summer season well in advance (at least 74 days) to capture early planners.
- Monitor your own booking lead times against these Menfi averages to identify opportunities for dynamic pricing adjustments.
Popular & Essential Airbnb Amenities in Menfi (2026)
Amenity Prevalence
Amenity Insights for Menfi
- Essential amenities in Menfi that guests expect include: Kitchen. Lacking these (this) could significantly impact bookings.
- Popular amenities like Air conditioning, TV, Washer are common but not universal. Offering these can provide a competitive edge.
- Warning: Wifi is not universally provided but is considered essential globally. Ensure reliable Wifi is offered.
Recommendations for Hosts
- Ensure your listing includes all essential amenities for Menfi: Kitchen.
- Prioritize adding missing essentials: Kitchen.
- Consider adding popular differentiators like Air conditioning or TV to increase appeal.
- Highlight unique or less common amenities you offer (e.g., hot tub, dedicated workspace, EV charger) in your listing description and photos.
- Regularly check competitor amenities in Menfi to stay competitive.
Menfi Airbnb Guest Demographics & Profile Analysis (2026)
Guest Profile Summary for Menfi
- The typical guest profile for Airbnb in Menfi consists of predominantly international visitors (81%), with top international origins including Italy, typically belonging to the Post-2000s (Gen Z/Alpha) group (50%), primarily speaking English or German.
- Domestic travelers account for 18.8% of guests.
- Key international markets include Germany (23.2%) and Italy (18.8%).
- Top languages spoken are English (37.6%) followed by German (17%).
- A significant demographic segment is the Post-2000s (Gen Z/Alpha) group, representing 50% of guests.
Recommendations for Hosts
- Focus marketing internationally, particularly towards travelers from Italy.
- Tailor amenities and listing descriptions to appeal to the dominant Post-2000s (Gen Z/Alpha) demographic (e.g., highlight fast WiFi, smart home features, local guides).
- Highlight unique local experiences or amenities relevant to the primary guest profile.
- Consider seasonal promotions aligned with peak travel times for key origin markets.
Nearby Short-Term Rental Market Comparison
How does the Menfi Airbnb market stack up against its neighbors? Compare key performance metrics like average monthly revenue, ADR, and occupancy rates in surrounding areas to understand the broader regional STR landscape.
| Market | Active Properties | Monthly Revenue | Daily Rate | Avg. Occupancy |
|---|---|---|---|---|
| Partinico | 93 | $3,103 | $409.35 | 38% |
| Borgetto | 12 | $2,367 | $217.03 | 50% |
| Collesano | 39 | $1,955 | $230.89 | 34% |
| Buseto Palizzolo | 24 | $1,934 | $266.34 | 40% |
| Marausa Lido | 11 | $1,927 | $253.70 | 34% |
| Santa Flavia | 193 | $1,871 | $173.15 | 47% |
| Altavilla Milicia | 66 | $1,820 | $222.17 | 40% |
| Ficarazzi | 12 | $1,778 | $225.91 | 32% |
| Marausa | 13 | $1,570 | $275.89 | 36% |
| Alcamo | 291 | $1,463 | $189.86 | 40% |