Marsala Airbnb Market Analysis 2026: Short Term Rental Data & Vacation Rental Statistics in Sicily, Italy
Is Airbnb profitable in Marsala in 2026? Explore comprehensive Airbnb analytics for Marsala, Sicily, Italy to uncover income potential. This 2026 STR market report for Marsala, based on AirROI data from February 2025 to January 2026, reveals key trends in the market of 584 active listings.
Whether you're considering an Airbnb investment in Marsala, optimizing your existing vacation rental, or exploring rental arbitrage opportunities, understanding the Marsala Airbnb data is crucial. Navigating the high regulation landscape is key to maximizing your short term rental income potential. Let's dive into the specifics.
Key Marsala Airbnb Performance Metrics Overview
Monthly Airbnb Revenue Variations & Income Potential in Marsala (2026)
Understanding the monthly revenue variations for Airbnb listings in Marsala is key to maximizing your short term rental income potential. Seasonality significantly impacts earnings. Our analysis, based on data from the past 12 months, shows that the peak revenue month for STRs in Marsala is typically August, while January often presents the lowest earnings, highlighting opportunities for strategic pricing adjustments during shoulder and low seasons. Explore the typical Airbnb income in Marsala across different performance tiers:
- Best-in-class properties (Top 10%) achieve $2,468+ monthly, often utilizing dynamic pricing and superior guest experiences.
- Strong performing properties (Top 25%) earn $1,485 or more, indicating effective management and desirable locations/amenities.
- Typical properties (Median) generate around $768 per month, representing the average market performance.
- Entry-level properties (Bottom 25%) see earnings around $361, often with potential for optimization.
Average Monthly Airbnb Earnings Trend in Marsala
Marsala Airbnb Occupancy Rate Trends (2026)
Maximize your bookings by understanding the Marsala STR occupancy trends. Seasonal demand shifts significantly influence how often properties are booked. Typically, Augustsees the highest demand (peak season occupancy), while January experiences the lowest (low season). Effective strategies, like adjusting minimum stays or offering promotions, can boost occupancy during slower periods. Here's how different property tiers perform in Marsala:
- Best-in-class properties (Top 10%) achieve 66%+ occupancy, indicating high desirability and potentially optimized availability.
- Strong performing properties (Top 25%) maintain 47% or higher occupancy, suggesting good market fit and guest satisfaction.
- Typical properties (Median) have an occupancy rate around 28%.
- Entry-level properties (Bottom 25%) average 13% occupancy, potentially facing higher vacancy.
Average Monthly Occupancy Rate Trend in Marsala
Average Daily Rate (ADR) Airbnb Trends in Marsala (2026)
Effective short term rental pricing strategy in Marsala involves understanding monthly ADR fluctuations. The Average Daily Rate (ADR) for Airbnb in Marsala typically peaks in August and dips lowest during November. Leveraging Airbnb dynamic pricing tools or strategies based on this seasonality can significantly boost revenue. Here's a look at the typical nightly rates achieved:
- Best-in-class properties (Top 10%) command rates of $220+ per night, often due to premium features or locations.
- Strong performing properties (Top 25%) achieve nightly rates of $131 or more.
- Typical properties (Median) charge around $93 per night.
- Entry-level properties (Bottom 25%) earn around $66 per night.
Average Daily Rate (ADR) Trend by Month in Marsala
Get Live Marsala Market Intelligence 👇

Explore Real-time Analytics
Airbnb Seasonality Analysis & Trends in Marsala (2026)
Peak Season (August, July, September)
- Revenue averages $2,029 per month
- Occupancy rates average 45.9%
- Daily rates average $152
Shoulder Season
- Revenue averages $1,089 per month
- Occupancy maintains around 29.4%
- Daily rates hold near $133
Low Season (January, February, December)
- Revenue drops to average $663 per month
- Occupancy decreases to average 21.8%
- Daily rates adjust to average $129
Seasonality Insights for Marsala
- The Airbnb seasonality in Marsala shows highly seasonal trends requiring careful strategy. While the sections above show seasonal averages, it's also insightful to look at the extremes:
- During the high season, the absolute peak month showcases Marsala's highest earning potential, with monthly revenues capable of climbing to $2,550, occupancy reaching a high of 52.4%, and ADRs peaking at $160.
- Conversely, the slowest single month of the year, typically falling within the low season, marks the market's lowest point. In this month, revenue might dip to $585, occupancy could drop to 20.4%, and ADRs may adjust down to $127.
- Understanding both the seasonal averages and these monthly peaks and troughs in revenue, occupancy, and ADR is crucial for maximizing your Airbnb profit potential in Marsala.
Seasonal Strategies for Maximizing Profit
- Peak Season: Maximize revenue through premium pricing and potentially longer minimum stays. Ensure high availability.
- Low Season: Offer competitive pricing, special promotions (e.g., extended stay discounts), and flexible cancellation policies. Target off-season travelers like remote workers or budget-conscious guests.
- Shoulder Seasons: Implement dynamic pricing that balances peak and low rates. Target weekend travelers or specific events. Offer slightly more flexible terms than peak season.
- Regularly analyze your own performance against these Marsala seasonality benchmarks and adjust your pricing and availability strategy accordingly.
Best Areas for Airbnb Investment in Marsala (2026)
Exploring the top neighborhoods for short-term rentals in Marsala? This section highlights key areas, outlining why they are attractive for hosts and guests, along with notable local attractions. Consider these locations based on your target guest profile and investment strategy.
| Neighborhood / Area | Why Host Here? (Target Guests & Appeal) | Key Attractions & Landmarks |
|---|---|---|
| Centro Storico | The historical center of Marsala, known for its charming streets, ancient architecture, and vibrant local culture. A prime spot for tourists interested in history and local cuisine. | Piazza della Repubblica, Marsala Cathedral, Museo degli Arazzi, Palazzo VII Aprile, Port of Marsala |
| Lido Signorino | A popular beach area known for its sandy shores and calm waters, perfect for families and beachgoers. It attracts tourists looking for relaxation and sunbathing. | Lido Signorino Beach, Natural Reserve of Stagnone, Kitesurfing spots, Restaurants and beach bars |
| Isola di Mozia | An archaeological site and island that offers a unique glimpse into ancient Phoenician civilization. Attracts history enthusiasts and nature lovers. | Mozia Archaeological Park, Whitaker Museum, Stagnone Lagoon, Birdwatching opportunities |
| Via Roma | The main shopping street in Marsala filled with local shops, cafes, and restaurants. Ideal for tourists wanting to experience the local lifestyle and services. | Shopping boutiques, Cafes and eateries, Local markets, Cultural events |
| Contrada Spagnola | A tranquil area in the countryside known for its vineyards and wine production. Perfect for those interested in wine tourism and local agriculture. | Wine cellars, Vineyard tours, Local wineries, Scenic countryside views |
| Temple of Segesta | Near the ancient site of Segesta, featuring stunning ruins and beautiful landscapes. Attracts tourists interested in archaeology and history. | Ancient Greek Temple, Theater of Segesta, Stunning views of surrounding countryside |
| Saline di Marsala | Famous for its salt flats and picturesque landscapes. A unique area that offers stunning views and a chance to learn about salt production. | Salt Museum, Windmills, Stagnone Lagoon, Birdwatching opportunities |
| Faro di Capo Boeo | The historic lighthouse area offers beautiful coastal views and is perfect for those wanting to experience Marsala's maritime culture. | Capo Boeo Lighthouse, Coastal paths, Stunning sunset views, Scenic walking areas |
Understanding Airbnb License Requirements & STR Laws in Marsala (2026)
Yes, Marsala, Sicily, Italy enforces high STR regulations. Obtaining a license and ensuring compliance is almost certainly required according to current 2026 STR laws. Always verify the latest short term rental regulations and Airbnb license requirements directly with local government authorities for Marsala to ensure full compliance before hosting.
(Source: AirROI data, 2026, based on 83% licensed listings)
Top Performing Airbnb Properties in Marsala (2026)
Benchmark your potential! Explore examples of top-performing Airbnb properties in Marsalabased on Trailing Twelve Month (TTM) revenue. Analyze their characteristics, revenue, occupancy rate, and ADR to understand what drives success in this market.
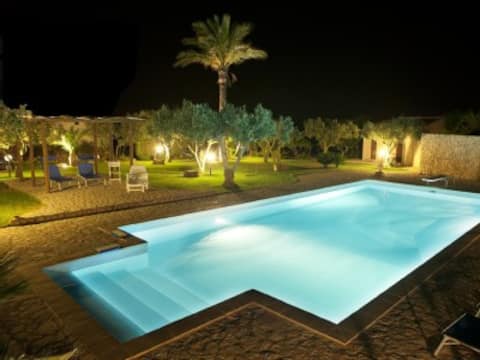
Large villa with pool in Sicily in Marsala (TP)
Entire Place • 9 bedrooms
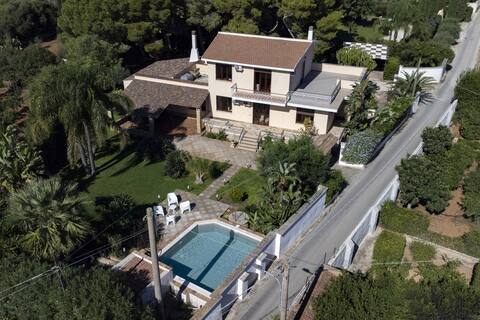
Villa Stella
Entire Place • 5 bedrooms
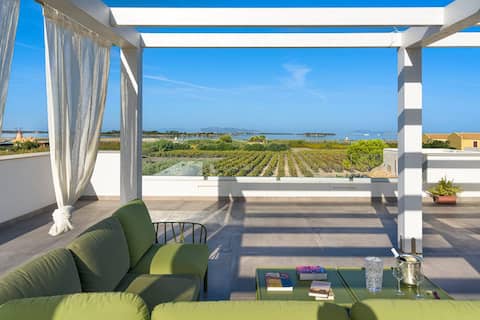
Villa with pool and a breathtaking view of the salt flats
Entire Place • 3 bedrooms

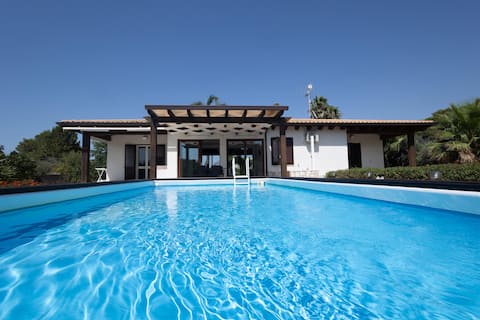
Villa Marsala_With views of the Egadi Islands
Entire Place • 5 bedrooms

House A - with Pool - Lo Stagnone Kite Spot - PKP
Entire Place • 4 bedrooms
Villa le Muse
Entire Place • 4 bedrooms
Note: Performance varies based on location, size, amenities, seasonality, and management quality. Data reflects the past 12 months.
Top Performing Airbnb Hosts in Marsala (2026)
Learn from the best! This table showcases top-performing Airbnb hosts in Marsala based on the number of properties managed and estimated total revenue over the past year. Analyze their scale and performance metrics.
| Host Name | Properties | Grossing Revenue | Stay Reviews | Avg Rating |
|---|---|---|---|---|
| Vincenzo | 2 | $144,999 | 96 | 4.97/5.0 |
| Holidu | 2 | $125,688 | 28 | 4.70/5.0 |
| Homes In Eataly | 2 | $115,571 | 5 | 4.75/5.0 |
| Martina | 3 | $110,503 | 27 | 5.00/5.0 |
| Anna Maria | 6 | $96,918 | 215 | 4.92/5.0 |
| Salvatore | 7 | $89,574 | 128 | 4.95/5.0 |
| Andrea | 7 | $88,681 | 313 | 4.68/5.0 |
| Vivi | 6 | $84,436 | 114 | 4.91/5.0 |
| Harald | 3 | $79,972 | 4 | Not Rated |
| Nunzio | 5 | $70,402 | 24 | 4.91/5.0 |
Analyzing the strategies of top hosts, such as their property selection, pricing, and guest communication, can offer valuable lessons for optimizing your own Airbnb operations in Marsala.
Dive Deeper: Advanced Marsala STR Market Data (2026)
Ready to unlock more insights? AirROI provides access to advanced metrics and comprehensive Airbnb data for Marsala. Explore detailed analytics beyond this report to refine your investment strategy, optimize pricing, and maximize your vacation rental profits.
Explore Advanced MetricsMarsala Short-Term Rental Market Composition (2026): Property & Room Types
Room Type Distribution
Property Type Distribution
Market Composition Insights for Marsala
- The Marsala Airbnb market composition is heavily skewed towards Entire Home/Apt listings, which make up 82.9% of the 584 active rentals. This indicates strong guest preference for privacy and space.
- Looking at the property type distribution in Marsala, House properties are the most common (52.7%), reflecting the local real estate landscape.
- Houses represent a significant 52.7% portion, catering likely to families or larger groups.
- The presence of 7.2% Hotel/Boutique listings indicates integration with traditional hospitality.
- Smaller segments like others, outdoor/unique, unique stays (combined 1.0%) offer potential for unique stay experiences.
Marsala Airbnb Room Capacity Analysis (2026): Bedroom Distribution
Distribution of Listings by Number of Bedrooms
Room Capacity Insights for Marsala
- The dominant room capacity in Marsala is 1 bedroom listings, making up 33.7% of the market. This suggests a strong demand for properties suitable for couples or solo travelers.
- Together, 1 bedroom and 2 bedrooms properties represent 66.9% of the active Airbnb listings in Marsala, indicating a high concentration in these sizes.
Marsala Vacation Rental Guest Capacity Trends (2026)
Distribution of Listings by Guest Capacity
Guest Capacity Insights for Marsala
- The most common guest capacity trend in Marsala vacation rentals is listings accommodating 4 guests (29.1%). This suggests the primary traveler segment is likely small families or groups.
- Properties designed for 4 guests and 6 guests dominate the Marsala STR market, accounting for 42.6% of listings.
- 27.9% of properties accommodate 6+ guests, serving the market segment for larger families or group travel in Marsala.
- On average, properties in Marsala are equipped to host 4.1 guests.
Marsala Airbnb Booking Patterns (2026): Available vs. Booked Days
Available Days Distribution
Booked Days Distribution
Booking Pattern Insights for Marsala
- The most common availability pattern in Marsala falls within the 271-366 days range, representing 74.1% of listings. This suggests many properties have significant open periods on their calendars.
- Approximately 94.8% of listings show high availability (181+ days open annually), indicating potential for increased bookings or specific owner usage patterns.
- For booked days, the 31-90 days range is most frequent in Marsala (36.8%), reflecting common guest stay durations or potential owner blocking patterns.
- A notable 5.7% of properties secure long booking periods (181+ days booked per year), highlighting successful long-term rental strategies or significant owner usage.
Marsala Airbnb Minimum Stay Requirements Analysis
Distribution of Listings by Minimum Night Requirement
1 Night
95 listings
16.3% of total
2 Nights
97 listings
16.6% of total
3 Nights
52 listings
8.9% of total
4-6 Nights
39 listings
6.7% of total
7-29 Nights
52 listings
8.9% of total
30+ Nights
249 listings
42.6% of total
Key Insights
- The most prevalent minimum stay requirement in Marsala is 30+ Nights, adopted by 42.6% of listings. This highlights the market's preference for longer commitments.
- A significant segment (42.6%) caters to monthly stays (30+ nights) in Marsala, pointing to opportunities in the extended-stay market.
Recommendations
- Align with the market by considering a 30+ Nights minimum stay, as 42.6% of Marsala hosts use this setting.
- If feasible, allowing 1-night stays, especially midweek or during low season, could capture last-minute bookings, as only 16.3% currently do.
- Explore offering discounts for stays of 30+ nights to attract the 42.6% of the market seeking extended stays.
- Adjust minimum nights based on seasonality – potentially shorter during low season and longer during peak demand periods in Marsala.
Marsala Airbnb Cancellation Policy Trends Analysis (2026)
Super Strict 30 Days
7 listings
1.2% of total
Limited
3 listings
0.5% of total
Super Strict 60 Days
16 listings
2.8% of total
Flexible
204 listings
35.1% of total
Moderate
196 listings
33.7% of total
Firm
124 listings
21.3% of total
Strict
31 listings
5.3% of total
Cancellation Policy Insights for Marsala
- The prevailing Airbnb cancellation policy trend in Marsala is Flexible, used by 35.1% of listings.
- There's a relatively balanced mix between guest-friendly (68.8%) and stricter (26.6%) policies, offering choices for different guest needs.
- Strict cancellation policies are quite rare (5.3%), potentially making listings with this policy less competitive unless justified by high demand or property type.
Recommendations for Hosts
- Consider adopting a Flexible policy to align with the 35.1% market standard in Marsala.
- Using a Strict policy might deter some guests, as only 5.3% of listings use it. Evaluate if potential revenue protection outweighs possible lower booking rates.
- Regularly review your cancellation policy against competitors and market demand shifts in Marsala.
Marsala STR Booking Lead Time Analysis (2026)
Average Booking Lead Time by Month
Booking Lead Time Insights for Marsala
- The overall average booking lead time for vacation rentals in Marsala is 55 days.
- Guests book furthest in advance for stays during August (average 74 days), likely coinciding with peak travel demand or local events.
- The shortest booking windows occur for stays in January (average 25 days), indicating more last-minute travel plans during this time.
- Seasonally, Summer (57 days avg.) sees the longest lead times, while Winter (28 days avg.) has the shortest, reflecting typical travel planning cycles.
Recommendations for Hosts
- Use the overall average lead time (55 days) as a baseline for your pricing and availability strategy in Marsala.
- For August stays, consider implementing length-of-stay discounts or slightly higher rates for bookings made less than 74 days out to capitalize on advance planning.
- Target marketing efforts for the Summer season well in advance (at least 57 days) to capture early planners.
- Monitor your own booking lead times against these Marsala averages to identify opportunities for dynamic pricing adjustments.
Popular & Essential Airbnb Amenities in Marsala (2026)
Amenity Prevalence
Amenity Insights for Marsala
- Popular amenities like Air conditioning, TV, Hair dryer are common but not universal. Offering these can provide a competitive edge.
- Warning: Wifi is not universally provided but is considered essential globally. Ensure reliable Wifi is offered.
Recommendations for Hosts
- Consider adding popular differentiators like Air conditioning or TV to increase appeal.
- Highlight unique or less common amenities you offer (e.g., hot tub, dedicated workspace, EV charger) in your listing description and photos.
- Regularly check competitor amenities in Marsala to stay competitive.
Marsala Airbnb Guest Demographics & Profile Analysis (2026)
Guest Profile Summary for Marsala
- The typical guest profile for Airbnb in Marsala consists of predominantly international visitors (73%), with top international origins including France, typically belonging to the Post-2000s (Gen Z/Alpha) group (50%), primarily speaking English or Italian.
- Domestic travelers account for 26.6% of guests.
- Key international markets include Italy (26.6%) and France (14.5%).
- Top languages spoken are English (37.5%) followed by Italian (16%).
- A significant demographic segment is the Post-2000s (Gen Z/Alpha) group, representing 50% of guests.
Recommendations for Hosts
- Focus marketing internationally, particularly towards travelers from France.
- Tailor amenities and listing descriptions to appeal to the dominant Post-2000s (Gen Z/Alpha) demographic (e.g., highlight fast WiFi, smart home features, local guides).
- Highlight unique local experiences or amenities relevant to the primary guest profile.
- Consider seasonal promotions aligned with peak travel times for key origin markets.
Nearby Short-Term Rental Market Comparison
How does the Marsala Airbnb market stack up against its neighbors? Compare key performance metrics like average monthly revenue, ADR, and occupancy rates in surrounding areas to understand the broader regional STR landscape.
| Market | Active Properties | Monthly Revenue | Daily Rate | Avg. Occupancy |
|---|---|---|---|---|
| Partinico | 93 | $3,103 | $409.35 | 38% |
| Borgetto | 12 | $2,367 | $217.03 | 50% |
| Collesano | 39 | $1,955 | $230.89 | 34% |
| Buseto Palizzolo | 24 | $1,934 | $266.34 | 40% |
| Marausa Lido | 11 | $1,927 | $253.70 | 34% |
| Santa Flavia | 193 | $1,871 | $173.15 | 47% |
| Altavilla Milicia | 66 | $1,820 | $222.17 | 40% |
| Ficarazzi | 12 | $1,778 | $225.91 | 32% |
| Marausa | 13 | $1,570 | $275.89 | 36% |
| Alcamo | 291 | $1,463 | $189.86 | 40% |