Tortolì Airbnb Market Analysis 2026: Short Term Rental Data & Vacation Rental Statistics in Sardinia, Italy
Is Airbnb profitable in Tortolì in 2026? Explore comprehensive Airbnb analytics for Tortolì, Sardinia, Italy to uncover income potential. This 2026 STR market report for Tortolì, based on AirROI data from February 2025 to January 2026, reveals key trends in the market of 314 active listings.
Whether you're considering an Airbnb investment in Tortolì, optimizing your existing vacation rental, or exploring rental arbitrage opportunities, understanding the Tortolì Airbnb data is crucial. Navigating the high regulation landscape is key to maximizing your short term rental income potential. Let's dive into the specifics.
Key Tortolì Airbnb Performance Metrics Overview
Monthly Airbnb Revenue Variations & Income Potential in Tortolì (2026)
Understanding the monthly revenue variations for Airbnb listings in Tortolì is key to maximizing your short term rental income potential. Seasonality significantly impacts earnings. Our analysis, based on data from the past 12 months, shows that the peak revenue month for STRs in Tortolì is typically August, while January often presents the lowest earnings, highlighting opportunities for strategic pricing adjustments during shoulder and low seasons. Explore the typical Airbnb income in Tortolì across different performance tiers:
- Best-in-class properties (Top 10%) achieve $3,510+ monthly, often utilizing dynamic pricing and superior guest experiences.
- Strong performing properties (Top 25%) earn $2,206 or more, indicating effective management and desirable locations/amenities.
- Typical properties (Median) generate around $1,251 per month, representing the average market performance.
- Entry-level properties (Bottom 25%) see earnings around $661, often with potential for optimization.
Average Monthly Airbnb Earnings Trend in Tortolì
Tortolì Airbnb Occupancy Rate Trends (2026)
Maximize your bookings by understanding the Tortolì STR occupancy trends. Seasonal demand shifts significantly influence how often properties are booked. Typically, Augustsees the highest demand (peak season occupancy), while December experiences the lowest (low season). Effective strategies, like adjusting minimum stays or offering promotions, can boost occupancy during slower periods. Here's how different property tiers perform in Tortolì:
- Best-in-class properties (Top 10%) achieve 69%+ occupancy, indicating high desirability and potentially optimized availability.
- Strong performing properties (Top 25%) maintain 52% or higher occupancy, suggesting good market fit and guest satisfaction.
- Typical properties (Median) have an occupancy rate around 32%.
- Entry-level properties (Bottom 25%) average 16% occupancy, potentially facing higher vacancy.
Average Monthly Occupancy Rate Trend in Tortolì
Average Daily Rate (ADR) Airbnb Trends in Tortolì (2026)
Effective short term rental pricing strategy in Tortolì involves understanding monthly ADR fluctuations. The Average Daily Rate (ADR) for Airbnb in Tortolì typically peaks in January and dips lowest during April. Leveraging Airbnb dynamic pricing tools or strategies based on this seasonality can significantly boost revenue. Here's a look at the typical nightly rates achieved:
- Best-in-class properties (Top 10%) command rates of $255+ per night, often due to premium features or locations.
- Strong performing properties (Top 25%) achieve nightly rates of $165 or more.
- Typical properties (Median) charge around $119 per night.
- Entry-level properties (Bottom 25%) earn around $91 per night.
Average Daily Rate (ADR) Trend by Month in Tortolì
Get Live Tortolì Market Intelligence 👇

Explore Real-time Analytics
Airbnb Seasonality Analysis & Trends in Tortolì (2026)
Peak Season (August, July, September)
- Revenue averages $3,038 per month
- Occupancy rates average 56.2%
- Daily rates average $165
Shoulder Season
- Revenue averages $1,505 per month
- Occupancy maintains around 33.9%
- Daily rates hold near $149
Low Season (January, February, December)
- Revenue drops to average $677 per month
- Occupancy decreases to average 18.6%
- Daily rates adjust to average $172
Seasonality Insights for Tortolì
- The Airbnb seasonality in Tortolì shows highly seasonal trends requiring careful strategy. While the sections above show seasonal averages, it's also insightful to look at the extremes:
- During the high season, the absolute peak month showcases Tortolì's highest earning potential, with monthly revenues capable of climbing to $3,832, occupancy reaching a high of 64.7%, and ADRs peaking at $177.
- Conversely, the slowest single month of the year, typically falling within the low season, marks the market's lowest point. In this month, revenue might dip to $567, occupancy could drop to 15.1%, and ADRs may adjust down to $135.
- Understanding both the seasonal averages and these monthly peaks and troughs in revenue, occupancy, and ADR is crucial for maximizing your Airbnb profit potential in Tortolì.
Seasonal Strategies for Maximizing Profit
- Peak Season: Maximize revenue through premium pricing and potentially longer minimum stays. Ensure high availability.
- Low Season: Offer competitive pricing, special promotions (e.g., extended stay discounts), and flexible cancellation policies. Target off-season travelers like remote workers or budget-conscious guests.
- Shoulder Seasons: Implement dynamic pricing that balances peak and low rates. Target weekend travelers or specific events. Offer slightly more flexible terms than peak season.
- Regularly analyze your own performance against these Tortolì seasonality benchmarks and adjust your pricing and availability strategy accordingly.
Best Areas for Airbnb Investment in Tortolì (2026)
Exploring the top neighborhoods for short-term rentals in Tortolì? This section highlights key areas, outlining why they are attractive for hosts and guests, along with notable local attractions. Consider these locations based on your target guest profile and investment strategy.
| Neighborhood / Area | Why Host Here? (Target Guests & Appeal) | Key Attractions & Landmarks |
|---|---|---|
| Tortolì Beach | Stunning sandy beaches and crystal-clear waters make this area a top destination for tourists seeking sun and relaxation. Close proximity to water sports and beachside restaurants enhances its appeal. | Spiaggia di Orrì, Spiaggia del Lido di Tortolì, Cala Ginepro, Torre di San Gemiliano, Club di Vela Tortolì |
| Historical Center of Tortolì | Rich in history and charm, the historical center offers a glimpse into local culture with its narrow streets and traditional architecture. Ideal for visitors looking to explore local markets and eateries. | Chiesa di San Giovanni Battista, Museo Archeologico, Piazza dell'Unità, Local artisan shops, Traditional Sardinian restaurants |
| Arbatax | Known for its beautiful red rock cliffs and stunning coastal views. Arbatax is also a key port and offers access to various boat tours and excursions. | Torre di Arbatax, Cala Moresca, Red Rocks of Arbatax, Boat tours to Cala Goloritzé, Local seafood restaurants |
| Bays of Orosei | Popular destination for its breathtaking landscapes and visiting opportunities to the famous beaches and coves. Attracts nature enthusiasts and adventure seekers. | Cala Luna, Cala Goloritzé, Gennargentu National Park, Boat tours, Snorkeling and diving spots |
| San Gemiliano | Quiet residential area close to the sea, perfect for families and tourists looking for a peaceful retreat with easy access to beaches and nature. | Spiaggia di San Gemiliano, Local parks, Cultural events, Walking trails |
| Lido di Orrì | Family-friendly beach area with amenities such as sunbeds and beach clubs. Great for families vacationing during summer months. | Beach clubs, Family-friendly restaurants, Water sports activities, Children's playgrounds |
| Cala marino di Baunei | A more secluded area known for its natural beauty and tranquility. Popular among those looking for a more off-the-beaten-path experience. | Cala Marinella, Hiking trails, Secluded beaches, Nature walks |
| Capo di Porto | Offers stunning views and a scenic coastline. Popular for hiking, nature walks, and small, intimate beaches. | Hiking trails, Scenic viewpoints, Picnic spots, Natural beauty |
Understanding Airbnb License Requirements & STR Laws in Tortolì (2026)
Yes, Tortolì, Sardinia, Italy enforces high STR regulations. Obtaining a license and ensuring compliance is almost certainly required according to current 2026 STR laws. Always verify the latest short term rental regulations and Airbnb license requirements directly with local government authorities for Tortolì to ensure full compliance before hosting.
(Source: AirROI data, 2026, based on 89% licensed listings)
Top Performing Airbnb Properties in Tortolì (2026)
Benchmark your potential! Explore examples of top-performing Airbnb properties in Tortolìbased on Trailing Twelve Month (TTM) revenue. Analyze their characteristics, revenue, occupancy rate, and ADR to understand what drives success in this market.
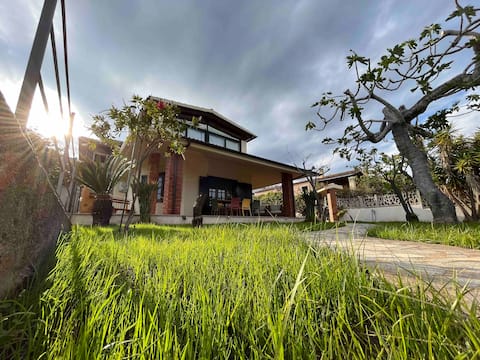
Villa Settimia 50 meters from the beach!
Entire Place • 2 bedrooms

Villa with SEAVIEW TERRACE, close by a sandy beach
Entire Place • 1 bedroom

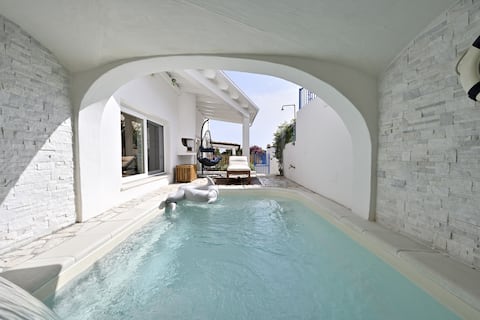
House with sea-view private pool 150m to the beach
Entire Place • 1 bedroom

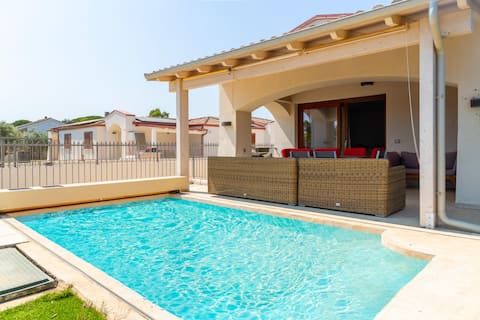
Villa with pool - 300 m from the sea
Entire Place • 3 bedrooms
House with private pool near beach
Entire Place • 1 bedroom
Villa Hercules - Seafront Villa
Entire Place • 4 bedrooms
Note: Performance varies based on location, size, amenities, seasonality, and management quality. Data reflects the past 12 months.
Top Performing Airbnb Hosts in Tortolì (2026)
Learn from the best! This table showcases top-performing Airbnb hosts in Tortolì based on the number of properties managed and estimated total revenue over the past year. Analyze their scale and performance metrics.
| Host Name | Properties | Grossing Revenue | Stay Reviews | Avg Rating |
|---|---|---|---|---|
| Lorenzo | 4 | $211,153 | 739 | 4.96/5.0 |
| Barbara | 13 | $176,241 | 69 | 4.68/5.0 |
| Gianfranco | 8 | $147,983 | 242 | 4.92/5.0 |
| Manuel | 3 | $147,843 | 173 | 4.95/5.0 |
| Marco | 6 | $135,170 | 79 | 4.70/5.0 |
| Federica | 4 | $126,487 | 263 | 4.90/5.0 |
| Paola | 6 | $120,995 | 520 | 4.92/5.0 |
| Jennas | 6 | $94,958 | 40 | 4.80/5.0 |
| All4sardinia Srl | 6 | $86,248 | 115 | 4.80/5.0 |
| Tabernabè | 9 | $85,969 | 155 | 4.77/5.0 |
Analyzing the strategies of top hosts, such as their property selection, pricing, and guest communication, can offer valuable lessons for optimizing your own Airbnb operations in Tortolì.
Dive Deeper: Advanced Tortolì STR Market Data (2026)
Ready to unlock more insights? AirROI provides access to advanced metrics and comprehensive Airbnb data for Tortolì. Explore detailed analytics beyond this report to refine your investment strategy, optimize pricing, and maximize your vacation rental profits.
Explore Advanced MetricsTortolì Short-Term Rental Market Composition (2026): Property & Room Types
Room Type Distribution
Property Type Distribution
Market Composition Insights for Tortolì
- The Tortolì Airbnb market composition is heavily skewed towards Entire Home/Apt listings, which make up 86% of the 314 active rentals. This indicates strong guest preference for privacy and space.
- Looking at the property type distribution in Tortolì, Apartment/Condo properties are the most common (59.6%), reflecting the local real estate landscape.
- Houses represent a significant 29.9% portion, catering likely to families or larger groups.
- The presence of 10.2% Hotel/Boutique listings indicates integration with traditional hospitality.
- Smaller segments like others (combined 0.3%) offer potential for unique stay experiences.
Tortolì Airbnb Room Capacity Analysis (2026): Bedroom Distribution
Distribution of Listings by Number of Bedrooms
Room Capacity Insights for Tortolì
- The dominant room capacity in Tortolì is 2 bedrooms listings, making up 42% of the market. This suggests a strong demand for properties suitable for couples or solo travelers.
- Together, 2 bedrooms and 1 bedroom properties represent 75.8% of the active Airbnb listings in Tortolì, indicating a high concentration in these sizes.
Tortolì Vacation Rental Guest Capacity Trends (2026)
Distribution of Listings by Guest Capacity
Guest Capacity Insights for Tortolì
- The most common guest capacity trend in Tortolì vacation rentals is listings accommodating 4 guests (43.6%). This suggests the primary traveler segment is likely small families or groups.
- Properties designed for 4 guests and 2 guests dominate the Tortolì STR market, accounting for 57.3% of listings.
- 18.5% of properties accommodate 6+ guests, serving the market segment for larger families or group travel in Tortolì.
- On average, properties in Tortolì are equipped to host 3.7 guests.
Tortolì Airbnb Booking Patterns (2026): Available vs. Booked Days
Available Days Distribution
Booked Days Distribution
Booking Pattern Insights for Tortolì
- The most common availability pattern in Tortolì falls within the 271-366 days range, representing 65.3% of listings. This suggests many properties have significant open periods on their calendars.
- Approximately 93.6% of listings show high availability (181+ days open annually), indicating potential for increased bookings or specific owner usage patterns.
- For booked days, the 31-90 days range is most frequent in Tortolì (34.1%), reflecting common guest stay durations or potential owner blocking patterns.
- A notable 6.7% of properties secure long booking periods (181+ days booked per year), highlighting successful long-term rental strategies or significant owner usage.
Tortolì Airbnb Minimum Stay Requirements Analysis
Distribution of Listings by Minimum Night Requirement
1 Night
26 listings
8.3% of total
2 Nights
27 listings
8.6% of total
3 Nights
20 listings
6.4% of total
4-6 Nights
85 listings
27.2% of total
7-29 Nights
41 listings
13.1% of total
30+ Nights
114 listings
36.4% of total
Key Insights
- The most prevalent minimum stay requirement in Tortolì is 30+ Nights, adopted by 36.4% of listings. This highlights the market's preference for longer commitments.
- Very short stays (1-2 nights) are less common (16.9%), suggesting hosts prefer slightly longer bookings to optimize turnover.
- A significant segment (36.4%) caters to monthly stays (30+ nights) in Tortolì, pointing to opportunities in the extended-stay market.
Recommendations
- Align with the market by considering a 30+ Nights minimum stay, as 36.4% of Tortolì hosts use this setting.
- If feasible, allowing 1-night stays, especially midweek or during low season, could capture last-minute bookings, as only 8.3% currently do.
- Explore offering discounts for stays of 30+ nights to attract the 36.4% of the market seeking extended stays.
- Adjust minimum nights based on seasonality – potentially shorter during low season and longer during peak demand periods in Tortolì.
Tortolì Airbnb Cancellation Policy Trends Analysis (2026)
Limited
8 listings
2.6% of total
Super Strict 60 Days
20 listings
6.4% of total
Super Strict 30 Days
24 listings
7.7% of total
Flexible
44 listings
14.1% of total
Moderate
117 listings
37.4% of total
Firm
69 listings
22% of total
Strict
31 listings
9.9% of total
Cancellation Policy Insights for Tortolì
- The prevailing Airbnb cancellation policy trend in Tortolì is Moderate, used by 37.4% of listings.
- There's a relatively balanced mix between guest-friendly (51.5%) and stricter (31.9%) policies, offering choices for different guest needs.
- Strict cancellation policies are quite rare (9.9%), potentially making listings with this policy less competitive unless justified by high demand or property type.
Recommendations for Hosts
- Consider adopting a Moderate policy to align with the 37.4% market standard in Tortolì.
- Using a Strict policy might deter some guests, as only 9.9% of listings use it. Evaluate if potential revenue protection outweighs possible lower booking rates.
- Regularly review your cancellation policy against competitors and market demand shifts in Tortolì.
Tortolì STR Booking Lead Time Analysis (2026)
Average Booking Lead Time by Month
Booking Lead Time Insights for Tortolì
- The overall average booking lead time for vacation rentals in Tortolì is 66 days.
- Guests book furthest in advance for stays during August (average 97 days), likely coinciding with peak travel demand or local events.
- The shortest booking windows occur for stays in December (average 27 days), indicating more last-minute travel plans during this time.
- Seasonally, Summer (80 days avg.) sees the longest lead times, while Winter (30 days avg.) has the shortest, reflecting typical travel planning cycles.
Recommendations for Hosts
- Use the overall average lead time (66 days) as a baseline for your pricing and availability strategy in Tortolì.
- For August stays, consider implementing length-of-stay discounts or slightly higher rates for bookings made less than 97 days out to capitalize on advance planning.
- Target marketing efforts for the Summer season well in advance (at least 80 days) to capture early planners.
- Monitor your own booking lead times against these Tortolì averages to identify opportunities for dynamic pricing adjustments.
Popular & Essential Airbnb Amenities in Tortolì (2026)
Amenity Prevalence
Amenity Insights for Tortolì
- Essential amenities in Tortolì that guests expect include: TV. Lacking these (this) could significantly impact bookings.
- Popular amenities like Air conditioning, Hair dryer, Hot water are common but not universal. Offering these can provide a competitive edge.
- Warning: Wifi is not universally provided but is considered essential globally. Ensure reliable Wifi is offered.
Recommendations for Hosts
- Ensure your listing includes all essential amenities for Tortolì: TV.
- Prioritize adding missing essentials: TV.
- Consider adding popular differentiators like Air conditioning or Hair dryer to increase appeal.
- Highlight unique or less common amenities you offer (e.g., hot tub, dedicated workspace, EV charger) in your listing description and photos.
- Regularly check competitor amenities in Tortolì to stay competitive.
Tortolì Airbnb Guest Demographics & Profile Analysis (2026)
Guest Profile Summary for Tortolì
- The typical guest profile for Airbnb in Tortolì consists of predominantly international visitors (83%), with top international origins including Italy, typically belonging to the Post-2000s (Gen Z/Alpha) group (50%), primarily speaking English or German.
- Domestic travelers account for 16.9% of guests.
- Key international markets include Germany (26%) and Italy (16.9%).
- Top languages spoken are English (40.5%) followed by German (19%).
- A significant demographic segment is the Post-2000s (Gen Z/Alpha) group, representing 50% of guests.
Recommendations for Hosts
- Focus marketing internationally, particularly towards travelers from Italy.
- Tailor amenities and listing descriptions to appeal to the dominant Post-2000s (Gen Z/Alpha) demographic (e.g., highlight fast WiFi, smart home features, local guides).
- Highlight unique local experiences or amenities relevant to the primary guest profile.
- Consider seasonal promotions aligned with peak travel times for key origin markets.
Nearby Short-Term Rental Market Comparison
How does the Tortolì Airbnb market stack up against its neighbors? Compare key performance metrics like average monthly revenue, ADR, and occupancy rates in surrounding areas to understand the broader regional STR landscape.
| Market | Active Properties | Monthly Revenue | Daily Rate | Avg. Occupancy |
|---|---|---|---|---|
| Maracalagonis | 268 | $2,396 | $338.45 | 43% |
| Torre Delle Stelle (Maracalagonis) | 18 | $2,082 | $416.40 | 42% |
| Pittulongu | 22 | $2,036 | $399.40 | 45% |
| Sarrocu/Sarroch | 89 | $1,968 | $239.26 | 43% |
| Golfo Aranci | 36 | $1,963 | $362.29 | 46% |
| Castiadas | 188 | $1,953 | $263.12 | 42% |
| Santa Margherita di Pula | 28 | $1,860 | $393.54 | 46% |
| Santu Diadòru/San Teodoro | 880 | $1,815 | $286.96 | 43% |
| La Caletta | 13 | $1,801 | $176.59 | 50% |
| Figari/Golfo Aranci | 383 | $1,651 | $286.39 | 39% |