Santa Teresa Gallura Airbnb Market Analysis 2026: Short Term Rental Data & Vacation Rental Statistics in Sardegna, Italy
Is Airbnb profitable in Santa Teresa Gallura in 2026? Explore comprehensive Airbnb analytics for Santa Teresa Gallura, Sardegna, Italy to uncover income potential. This 2026 STR market report for Santa Teresa Gallura, based on AirROI data from February 2025 to January 2026, reveals key trends in the niche market of 50 active listings.
Whether you're considering an Airbnb investment in Santa Teresa Gallura, optimizing your existing vacation rental, or exploring rental arbitrage opportunities, understanding the Santa Teresa Gallura Airbnb data is crucial. Navigating the high regulation landscape is key to maximizing your short term rental income potential. Let's dive into the specifics.
Key Santa Teresa Gallura Airbnb Performance Metrics Overview
Monthly Airbnb Revenue Variations & Income Potential in Santa Teresa Gallura (2026)
Understanding the monthly revenue variations for Airbnb listings in Santa Teresa Gallura is key to maximizing your short term rental income potential. Seasonality significantly impacts earnings. Our analysis, based on data from the past 12 months, shows that the peak revenue month for STRs in Santa Teresa Gallura is typically August, while May often presents the lowest earnings, highlighting opportunities for strategic pricing adjustments during shoulder and low seasons. Explore the typical Airbnb income in Santa Teresa Gallura across different performance tiers:
- Best-in-class properties (Top 10%) achieve $3,898+ monthly, often utilizing dynamic pricing and superior guest experiences.
- Strong performing properties (Top 25%) earn $2,845 or more, indicating effective management and desirable locations/amenities.
- Typical properties (Median) generate around $1,586 per month, representing the average market performance.
- Entry-level properties (Bottom 25%) see earnings around $954, often with potential for optimization.
Average Monthly Airbnb Earnings Trend in Santa Teresa Gallura
Santa Teresa Gallura Airbnb Occupancy Rate Trends (2026)
Maximize your bookings by understanding the Santa Teresa Gallura STR occupancy trends. Seasonal demand shifts significantly influence how often properties are booked. Typically, Augustsees the highest demand (peak season occupancy), while May experiences the lowest (low season). Effective strategies, like adjusting minimum stays or offering promotions, can boost occupancy during slower periods. Here's how different property tiers perform in Santa Teresa Gallura:
- Best-in-class properties (Top 10%) achieve 60%+ occupancy, indicating high desirability and potentially optimized availability.
- Strong performing properties (Top 25%) maintain 47% or higher occupancy, suggesting good market fit and guest satisfaction.
- Typical properties (Median) have an occupancy rate around 37%.
- Entry-level properties (Bottom 25%) average 22% occupancy, potentially facing higher vacancy.
Average Monthly Occupancy Rate Trend in Santa Teresa Gallura
Average Daily Rate (ADR) Airbnb Trends in Santa Teresa Gallura (2026)
Effective short term rental pricing strategy in Santa Teresa Gallura involves understanding monthly ADR fluctuations. The Average Daily Rate (ADR) for Airbnb in Santa Teresa Gallura typically peaks in January and dips lowest during September. Leveraging Airbnb dynamic pricing tools or strategies based on this seasonality can significantly boost revenue. Here's a look at the typical nightly rates achieved:
- Best-in-class properties (Top 10%) command rates of $290+ per night, often due to premium features or locations.
- Strong performing properties (Top 25%) achieve nightly rates of $213 or more.
- Typical properties (Median) charge around $161 per night.
- Entry-level properties (Bottom 25%) earn around $132 per night.
Average Daily Rate (ADR) Trend by Month in Santa Teresa Gallura
Get Live Santa Teresa Gallura Market Intelligence 👇
Explore Real-time Analytics
Airbnb Seasonality Analysis & Trends in Santa Teresa Gallura (2026)
Peak Season (August, January, July)
- Revenue averages $3,319 per month
- Occupancy rates average 48.5%
- Daily rates average $228
Shoulder Season
- Revenue averages $1,466 per month
- Occupancy maintains around 31.1%
- Daily rates hold near $176
Low Season (February, March, April)
- Revenue drops to average $0 per month
- Occupancy decreases to average 0.0%
- Daily rates adjust to average $201
Seasonality Insights for Santa Teresa Gallura
- The Airbnb seasonality in Santa Teresa Gallura shows highly seasonal trends requiring careful strategy. While the sections above show seasonal averages, it's also insightful to look at the extremes:
- During the high season, the absolute peak month showcases Santa Teresa Gallura's highest earning potential, with monthly revenues capable of climbing to $4,319, occupancy reaching a high of 74.9%, and ADRs peaking at $310.
- Conversely, the slowest single month of the year, typically falling within the low season, marks the market's lowest point. In this month, revenue might dip to $0, occupancy could drop to 0.0%, and ADRs may adjust down to $144.
- Understanding both the seasonal averages and these monthly peaks and troughs in revenue, occupancy, and ADR is crucial for maximizing your Airbnb profit potential in Santa Teresa Gallura.
Seasonal Strategies for Maximizing Profit
- Peak Season: Maximize revenue through premium pricing and potentially longer minimum stays. Ensure high availability.
- Low Season: Offer competitive pricing, special promotions (e.g., extended stay discounts), and flexible cancellation policies. Target off-season travelers like remote workers or budget-conscious guests.
- Shoulder Seasons: Implement dynamic pricing that balances peak and low rates. Target weekend travelers or specific events. Offer slightly more flexible terms than peak season.
- Regularly analyze your own performance against these Santa Teresa Gallura seasonality benchmarks and adjust your pricing and availability strategy accordingly.
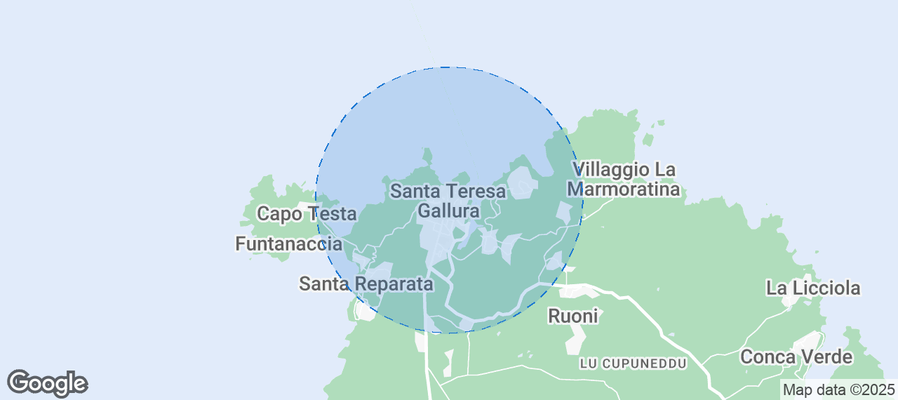
Best Areas for Airbnb Investment in Santa Teresa Gallura (2026)
Exploring the top neighborhoods for short-term rentals in Santa Teresa Gallura? This section highlights key areas, outlining why they are attractive for hosts and guests, along with notable local attractions. Consider these locations based on your target guest profile and investment strategy.
| Neighborhood / Area | Why Host Here? (Target Guests & Appeal) | Key Attractions & Landmarks |
|---|---|---|
| La Pelosetta | A stunning beach known for its crystal clear waters and beautiful sand, ideal for beach lovers and families. This spot is perfect for hosting vacationers seeking a relaxing beach getaway. | La Pelosetta Beach, Capo Testa, Rena Bianca Beach, Monte Limbara |
| Capo Testa | Famous for its unique rock formations and breathtaking views, Capo Testa attracts nature lovers and adventurous travelers. It's a hotspot for hiking and exploring stunning coastal scenery. | Capo Testa Cliffs, Tavolara Island, Trekking paths, Beach of Cala Francese |
| Rena Bianca | Known for its scenic beauty and pristine white sand, Rena Bianca is one of the most picturesque beaches in Sardinia, drawing tourists who appreciate natural beauty and tranquility. | Rena Bianca Beach, Historical center of Santa Teresa Gallura, Water sports facilities |
| Santa Teresa Gallura Town | The town itself is vibrant and charming, offering a mix of cultural experiences, shopping, and local cuisine. It's a great location for visitors wanting to explore local life and attractions. | The Old Town, Piazza Vittorio Emanuele, Local restaurants and cafes, Ferry Terminal |
| Spiaggia di Cala Sanguinaria | A hidden gem, this beach is more secluded and offers an intimate setting for couples and travelers looking for a quieter beach experience away from the crowds. | Cala Sanguinaria Beach, Snorkeling opportunities, Natural surroundings |
| L'Isola dei Gabbiani | A popular spot for windsurfing and kitesurfing, attracting sports enthusiasts. It's perfect for those looking to be active during their stay and enjoy water sports. | Windsurfing spots, Kitesurfing schools, Natural beauty |
| Porto Pozzo | A quaint seaside village offering a more tranquil atmosphere, ideal for families and tourists looking for relaxation. Close to beautiful beaches and nature. | Porto Pozzo Beach, Boat rentals, Scenic walks |
| Cala Corsara | Known for its stunning landscape and off-the-beaten-path charm, this area attracts nature enthusiasts and those seeking a unique and peaceful retreat. | Cala Corsara Beach, Boat excursions, Nature trails |
Understanding Airbnb License Requirements & STR Laws in Santa Teresa Gallura (2026)
Yes, Santa Teresa Gallura, Sardegna, Italy enforces high STR regulations. Obtaining a license and ensuring compliance is almost certainly required according to current 2026 STR laws. Always verify the latest short term rental regulations and Airbnb license requirements directly with local government authorities for Santa Teresa Gallura to ensure full compliance before hosting.
(Source: AirROI data, 2026, based on 96% licensed listings)
Top Performing Airbnb Properties in Santa Teresa Gallura (2026)
Benchmark your potential! Explore examples of top-performing Airbnb properties in Santa Teresa Gallurabased on Trailing Twelve Month (TTM) revenue. Analyze their characteristics, revenue, occupancy rate, and ADR to understand what drives success in this market.

Villa Luce in sunny Sardinia
Entire Place • 4 bedrooms
Aquarius Deluxe Apartment DX
Entire Place • 1 bedroom
Aquarius deluxe apartment P1
Entire Place • 2 bedrooms

Bilancia's VI (30 minutes from Porto Cervo) + Sea View
Entire Place • 2 bedrooms

Leone Flat VI (30' from Porto Cervo) + Private Terrace
Entire Place • 1 bedroom

Toro Flat IV (Private Terrace & Sea View)
Entire Place • 1 bedroom
Note: Performance varies based on location, size, amenities, seasonality, and management quality. Data reflects the past 12 months.
Top Performing Airbnb Hosts in Santa Teresa Gallura (2026)
Learn from the best! This table showcases top-performing Airbnb hosts in Santa Teresa Gallura based on the number of properties managed and estimated total revenue over the past year. Analyze their scale and performance metrics.
| Host Name | Properties | Grossing Revenue | Stay Reviews | Avg Rating |
|---|---|---|---|---|
| Rocca Lughente Resort | 19 | $244,486 | 119 | 4.72/5.0 |
| Giuseppe | 3 | $51,815 | 14 | 5.00/5.0 |
| Monika Anna | 1 | $45,724 | 5 | 4.60/5.0 |
| Valentina | 1 | $16,757 | 2 | Not Rated |
| Valeria | 1 | $16,144 | 5 | 5.00/5.0 |
| Arrigo&Frigerio Real Estate S | 2 | $14,824 | 6 | 3.50/5.0 |
| Gian Michele | 2 | $14,641 | 2 | Not Rated |
| Chiara | 1 | $14,393 | 1 | Not Rated |
| Gianpietro | 2 | $14,354 | 36 | 3.89/5.0 |
| Roberta | 1 | $13,195 | 13 | 4.62/5.0 |
Analyzing the strategies of top hosts, such as their property selection, pricing, and guest communication, can offer valuable lessons for optimizing your own Airbnb operations in Santa Teresa Gallura.
Dive Deeper: Advanced Santa Teresa Gallura STR Market Data (2026)
Ready to unlock more insights? AirROI provides access to advanced metrics and comprehensive Airbnb data for Santa Teresa Gallura. Explore detailed analytics beyond this report to refine your investment strategy, optimize pricing, and maximize your vacation rental profits.
Explore Advanced MetricsSanta Teresa Gallura Short-Term Rental Market Composition (2026): Property & Room Types
Room Type Distribution
Property Type Distribution
Market Composition Insights for Santa Teresa Gallura
- The Santa Teresa Gallura Airbnb market composition is heavily skewed towards Entire Home/Apt listings, which make up 96% of the 50 active rentals. This indicates strong guest preference for privacy and space.
- Looking at the property type distribution in Santa Teresa Gallura, Apartment/Condo properties are the most common (74%), reflecting the local real estate landscape.
- Houses represent a significant 22% portion, catering likely to families or larger groups.
- Smaller segments like hotel/boutique (combined 4.0%) offer potential for unique stay experiences.
Santa Teresa Gallura Airbnb Room Capacity Analysis (2026): Bedroom Distribution
Distribution of Listings by Number of Bedrooms
Room Capacity Insights for Santa Teresa Gallura
- The dominant room capacity in Santa Teresa Gallura is 1 bedroom listings, making up 58% of the market. This suggests a strong demand for properties suitable for couples or solo travelers.
- Together, 1 bedroom and 2 bedrooms properties represent 90.0% of the active Airbnb listings in Santa Teresa Gallura, indicating a high concentration in these sizes.
- With over half the market (58%) consisting of studios or 1-bedroom units, Santa Teresa Gallura is particularly well-suited for individuals or couples.
- Listings with 3+ bedrooms (8.0%) represent a smaller niche, potentially indicating an underserved market for larger group accommodations in Santa Teresa Gallura.
Santa Teresa Gallura Vacation Rental Guest Capacity Trends (2026)
Distribution of Listings by Guest Capacity
Guest Capacity Insights for Santa Teresa Gallura
- The most common guest capacity trend in Santa Teresa Gallura vacation rentals is listings accommodating 4 guests (50%). This suggests the primary traveler segment is likely small families or groups.
- Properties designed for 4 guests and 6 guests dominate the Santa Teresa Gallura STR market, accounting for 70.0% of listings.
- 26.0% of properties accommodate 6+ guests, serving the market segment for larger families or group travel in Santa Teresa Gallura.
- On average, properties in Santa Teresa Gallura are equipped to host 4.4 guests.
Santa Teresa Gallura Airbnb Booking Patterns (2026): Available vs. Booked Days
Available Days Distribution
Booked Days Distribution
Booking Pattern Insights for Santa Teresa Gallura
- The most common availability pattern in Santa Teresa Gallura falls within the 271-366 days range, representing 88% of listings. This suggests many properties have significant open periods on their calendars.
- Approximately 100.0% of listings show high availability (181+ days open annually), indicating potential for increased bookings or specific owner usage patterns.
- For booked days, the 31-90 days range is most frequent in Santa Teresa Gallura (72%), reflecting common guest stay durations or potential owner blocking patterns.
Santa Teresa Gallura Airbnb Minimum Stay Requirements Analysis
Distribution of Listings by Minimum Night Requirement
1 Night
4 listings
8% of total
3 Nights
3 listings
6% of total
4-6 Nights
25 listings
50% of total
7-29 Nights
3 listings
6% of total
30+ Nights
15 listings
30% of total
Key Insights
- The most prevalent minimum stay requirement in Santa Teresa Gallura is 4-6 Nights, adopted by 50% of listings. This highlights the market's preference for longer commitments.
- Very short stays (1-2 nights) are less common (8.0%), suggesting hosts prefer slightly longer bookings to optimize turnover.
- A significant segment (30%) caters to monthly stays (30+ nights) in Santa Teresa Gallura, pointing to opportunities in the extended-stay market.
Recommendations
- Align with the market by considering a 4-6 Nights minimum stay, as 50% of Santa Teresa Gallura hosts use this setting.
- If feasible, allowing 1-night stays, especially midweek or during low season, could capture last-minute bookings, as only 8% currently do.
- Explore offering discounts for stays of 30+ nights to attract the 30% of the market seeking extended stays.
- Adjust minimum nights based on seasonality – potentially shorter during low season and longer during peak demand periods in Santa Teresa Gallura.
Santa Teresa Gallura Airbnb Cancellation Policy Trends Analysis (2026)
Super Strict 30 Days
8 listings
16% of total
Limited
1 listings
2% of total
Flexible
5 listings
10% of total
Moderate
25 listings
50% of total
Firm
11 listings
22% of total
Cancellation Policy Insights for Santa Teresa Gallura
- The prevailing Airbnb cancellation policy trend in Santa Teresa Gallura is Moderate, used by 50% of listings.
- There's a relatively balanced mix between guest-friendly (60.0%) and stricter (22.0%) policies, offering choices for different guest needs.
Recommendations for Hosts
- Consider adopting a Moderate policy to align with the 50% market standard in Santa Teresa Gallura.
- Regularly review your cancellation policy against competitors and market demand shifts in Santa Teresa Gallura.
Santa Teresa Gallura STR Booking Lead Time Analysis (2026)
Average Booking Lead Time by Month
Booking Lead Time Insights for Santa Teresa Gallura
- The overall average booking lead time for vacation rentals in Santa Teresa Gallura is 23 days.
- Guests book furthest in advance for stays during August (average 39 days), likely coinciding with peak travel demand or local events.
- The shortest booking windows occur for stays in April (average 0 days), indicating more last-minute travel plans during this time.
- Seasonally, Summer (25 days avg.) sees the longest lead times, while Spring (0 days avg.) has the shortest, reflecting typical travel planning cycles.
Recommendations for Hosts
- Use the overall average lead time (23 days) as a baseline for your pricing and availability strategy in Santa Teresa Gallura.
- For August stays, consider implementing length-of-stay discounts or slightly higher rates for bookings made less than 39 days out to capitalize on advance planning.
- During April, focus on last-minute booking availability and promotions, as guests book with very short notice (0 days avg.).
- Target marketing efforts for the Summer season well in advance (at least 25 days) to capture early planners.
- Monitor your own booking lead times against these Santa Teresa Gallura averages to identify opportunities for dynamic pricing adjustments.
Popular & Essential Airbnb Amenities in Santa Teresa Gallura (2026)
Amenity Prevalence
Amenity Insights for Santa Teresa Gallura
- Essential amenities in Santa Teresa Gallura that guests expect include: TV. Lacking these (this) could significantly impact bookings.
- Popular amenities like Washer, Air conditioning, Kitchen are common but not universal. Offering these can provide a competitive edge.
Recommendations for Hosts
- Ensure your listing includes all essential amenities for Santa Teresa Gallura: TV.
- Prioritize adding missing essentials: TV.
- Consider adding popular differentiators like Washer or Air conditioning to increase appeal.
- Highlight unique or less common amenities you offer (e.g., hot tub, dedicated workspace, EV charger) in your listing description and photos.
- Regularly check competitor amenities in Santa Teresa Gallura to stay competitive.
Santa Teresa Gallura Airbnb Guest Demographics & Profile Analysis (2026)
Guest Profile Summary for Santa Teresa Gallura
- The typical guest profile for Airbnb in Santa Teresa Gallura consists of predominantly international visitors (81%), with top international origins including Italy, typically belonging to the Post-2000s (Gen Z/Alpha) group (50%), primarily speaking English or Italian.
- Domestic travelers account for 18.7% of guests.
- Key international markets include France (29.3%) and Italy (18.7%).
- Top languages spoken are English (35.5%) followed by Italian (15.5%).
- A significant demographic segment is the Post-2000s (Gen Z/Alpha) group, representing 50% of guests.
Recommendations for Hosts
- Focus marketing internationally, particularly towards travelers from Italy.
- Tailor amenities and listing descriptions to appeal to the dominant Post-2000s (Gen Z/Alpha) demographic (e.g., highlight fast WiFi, smart home features, local guides).
- Highlight unique local experiences or amenities relevant to the primary guest profile.
- Consider seasonal promotions aligned with peak travel times for key origin markets.
Nearby Short-Term Rental Market Comparison
How does the Santa Teresa Gallura Airbnb market stack up against its neighbors? Compare key performance metrics like average monthly revenue, ADR, and occupancy rates in surrounding areas to understand the broader regional STR landscape.
| Market | Active Properties | Monthly Revenue | Daily Rate | Avg. Occupancy |
|---|---|---|---|---|
| Porto Cervo | 195 | $3,256 | $555.32 | 40% |
| Poltu Quatu | 53 | $2,363 | $299.65 | 43% |
| Alzachèna/Arzachena | 341 | $2,156 | $337.95 | 42% |
| Lecci | 596 | $2,094 | $281.02 | 45% |
| Zonza | 761 | $2,049 | $304.05 | 42% |
| Baja Sardinia | 123 | $2,046 | $307.54 | 42% |
| Pittulongu | 22 | $2,036 | $399.40 | 45% |
| Golfo Aranci | 36 | $1,963 | $362.29 | 46% |
| Sotta | 189 | $1,917 | $205.74 | 51% |
| Bonifacio / Bunifaziu | 527 | $1,892 | $237.98 | 46% |