Torino Airbnb Market Analysis 2026: Short Term Rental Data & Vacation Rental Statistics in Piemonte, Italy
Is Airbnb profitable in Torino in 2026? Explore comprehensive Airbnb analytics for Torino, Piemonte, Italy to uncover income potential. This 2026 STR market report for Torino, based on AirROI data from February 2025 to January 2026, reveals key trends in the market of 229 active listings.
Whether you're considering an Airbnb investment in Torino, optimizing your existing vacation rental, or exploring rental arbitrage opportunities, understanding the Torino Airbnb data is crucial. Navigating the high regulation landscape is key to maximizing your short term rental income potential. Let's dive into the specifics.
Key Torino Airbnb Performance Metrics Overview
Monthly Airbnb Revenue Variations & Income Potential in Torino (2026)
Understanding the monthly revenue variations for Airbnb listings in Torino is key to maximizing your short term rental income potential. Seasonality significantly impacts earnings. Our analysis, based on data from the past 12 months, shows that the peak revenue month for STRs in Torino is typically November, while May often presents the lowest earnings, highlighting opportunities for strategic pricing adjustments during shoulder and low seasons. Explore the typical Airbnb income in Torino across different performance tiers:
- Best-in-class properties (Top 10%) achieve $2,958+ monthly, often utilizing dynamic pricing and superior guest experiences.
- Strong performing properties (Top 25%) earn $1,873 or more, indicating effective management and desirable locations/amenities.
- Typical properties (Median) generate around $1,221 per month, representing the average market performance.
- Entry-level properties (Bottom 25%) see earnings around $735, often with potential for optimization.
Average Monthly Airbnb Earnings Trend in Torino
Torino Airbnb Occupancy Rate Trends (2026)
Maximize your bookings by understanding the Torino STR occupancy trends. Seasonal demand shifts significantly influence how often properties are booked. Typically, Octobersees the highest demand (peak season occupancy), while April experiences the lowest (low season). Effective strategies, like adjusting minimum stays or offering promotions, can boost occupancy during slower periods. Here's how different property tiers perform in Torino:
- Best-in-class properties (Top 10%) achieve 57%+ occupancy, indicating high desirability and potentially optimized availability.
- Strong performing properties (Top 25%) maintain 47% or higher occupancy, suggesting good market fit and guest satisfaction.
- Typical properties (Median) have an occupancy rate around 34%.
- Entry-level properties (Bottom 25%) average 20% occupancy, potentially facing higher vacancy.
Average Monthly Occupancy Rate Trend in Torino
Average Daily Rate (ADR) Airbnb Trends in Torino (2026)
Effective short term rental pricing strategy in Torino involves understanding monthly ADR fluctuations. The Average Daily Rate (ADR) for Airbnb in Torino typically peaks in November and dips lowest during June. Leveraging Airbnb dynamic pricing tools or strategies based on this seasonality can significantly boost revenue. Here's a look at the typical nightly rates achieved:
- Best-in-class properties (Top 10%) command rates of $210+ per night, often due to premium features or locations.
- Strong performing properties (Top 25%) achieve nightly rates of $155 or more.
- Typical properties (Median) charge around $111 per night.
- Entry-level properties (Bottom 25%) earn around $78 per night.
Average Daily Rate (ADR) Trend by Month in Torino
Get Live Torino Market Intelligence 👇
Explore Real-time Analytics
Airbnb Seasonality Analysis & Trends in Torino (2026)
Peak Season (November, October, December)
- Revenue averages $2,565 per month
- Occupancy rates average 48.6%
- Daily rates average $165
Shoulder Season
- Revenue averages $1,550 per month
- Occupancy maintains around 39.3%
- Daily rates hold near $121
Low Season (February, April, May)
- Revenue drops to average $485 per month
- Occupancy decreases to average 8.5%
- Daily rates adjust to average $112
Seasonality Insights for Torino
- The Airbnb seasonality in Torino shows highly seasonal trends requiring careful strategy. While the sections above show seasonal averages, it's also insightful to look at the extremes:
- During the high season, the absolute peak month showcases Torino's highest earning potential, with monthly revenues capable of climbing to $2,798, occupancy reaching a high of 53.2%, and ADRs peaking at $179.
- Conversely, the slowest single month of the year, typically falling within the low season, marks the market's lowest point. In this month, revenue might dip to $422, occupancy could drop to 6.7%, and ADRs may adjust down to $109.
- Understanding both the seasonal averages and these monthly peaks and troughs in revenue, occupancy, and ADR is crucial for maximizing your Airbnb profit potential in Torino.
Seasonal Strategies for Maximizing Profit
- Peak Season: Maximize revenue through premium pricing and potentially longer minimum stays. Ensure high availability.
- Low Season: Offer competitive pricing, special promotions (e.g., extended stay discounts), and flexible cancellation policies. Target off-season travelers like remote workers or budget-conscious guests.
- Shoulder Seasons: Implement dynamic pricing that balances peak and low rates. Target weekend travelers or specific events. Offer slightly more flexible terms than peak season.
- Regularly analyze your own performance against these Torino seasonality benchmarks and adjust your pricing and availability strategy accordingly.
Best Areas for Airbnb Investment in Torino (2026)
Exploring the top neighborhoods for short-term rentals in Torino? This section highlights key areas, outlining why they are attractive for hosts and guests, along with notable local attractions. Consider these locations based on your target guest profile and investment strategy.
| Neighborhood / Area | Why Host Here? (Target Guests & Appeal) | Key Attractions & Landmarks |
|---|---|---|
| Centro Storico | The historical center of Turin, filled with stunning architecture, shops, and restaurants. Ideal for tourists wanting to experience the rich culture and history of the city. | Mole Antonelliana, Egyptian Museum, Piazza Castello, Royal Palace of Turin, Via Roma, Galleria San Federico |
| San Salvario | A lively neighborhood known for its nightlife, restaurants, and bars. It's a popular area for young travelers and locals looking for a good time. | Parco del Valentino, Viale Vittorio Veneto, Museo del Cinema, Bars and nightclubs, Street food vendors, Cafes |
| Vanchiglia | A bohemian area next to the river, attracting artists and creatives. It has a relaxed vibe and is close to the university, appealing to students and young professionals. | Museum of Antiquities, The Po River, Local artisan shops, Restaurants and cafes, Parco della Gran Madre |
| Quadrilatero Romano | Famous for its Roman origins and vibrant atmosphere. Strolling through its narrow streets gives a taste of both ancient and modern Turin. | Roman ruins, Piazza della Repubblica, Outdoor markets, Traditional restaurants, Art galleries |
| Borgo Vittoria | A quaint neighborhood with a local and authentic feel. It offers a mix of residential charm and great local shops, making it appealing to families and longer-term guests. | Borgo Filadelfia, Local markets, Parks, Caselle Park |
| Parella | A quiet residential area with good access to public transportation. It's suitable for families or those seeking a more suburban feel while being close to the city center. | Parco della Pellerina, National Museum of the Italian Risorgimento, Local eateries, Nearby cycling paths |
| Lingotto | Known for the iconic Fiat factory and its transformation into a cultural hub. It attracts visitors interested in industrial heritage and modern architecture. | Lingotto Fiere, Pinacoteca Giovanni e Marella Agnelli, Piazza Galimberti, Shopping malls |
| Nizza Millefonti | An area that is developing with new buildings and infrastructure. It's attractive for business travelers and those visiting for events at the trade fair. | Lingotto Conference Center, Shopping centers, Easy access to transportation, Parks |
Understanding Airbnb License Requirements & STR Laws in Torino (2026)
Yes, Torino, Piemonte, Italy enforces high STR regulations. Obtaining a license and ensuring compliance is almost certainly required according to current 2026 STR laws. Always verify the latest short term rental regulations and Airbnb license requirements directly with local government authorities for Torino to ensure full compliance before hosting.
(Source: AirROI data, 2026, based on 86% licensed listings)
Top Performing Airbnb Properties in Torino (2026)
Benchmark your potential! Explore examples of top-performing Airbnb properties in Torinobased on Trailing Twelve Month (TTM) revenue. Analyze their characteristics, revenue, occupancy rate, and ADR to understand what drives success in this market.
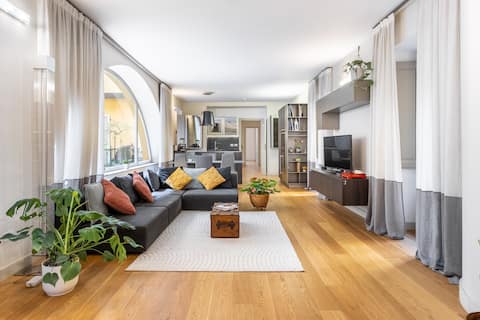
![[Rivoli Metro] just 15 minutes from the Historic Center!](https://a0.muscache.com/im/pictures/miso/Hosting-1342882391994134350/original/749f91b7-7ba0-450c-91ac-b02f961e4beb.jpeg?im_w=480&im_format=avif)
[Rivoli Metro] just 15 minutes from the Historic Center!
Entire Place • 1 bedroom
Elegant & Central 200 mq | Terrace | Jacuzzi
Entire Place • 3 bedrooms

Cozy downtown apartment
Entire Place • 2 bedrooms

San Carlo Luxe | Turin center 200m² + Jacuzzi
Entire Place • 2 bedrooms
![[V-Home] Center of Quadrilatero - with 2 bedrooms](https://a0.muscache.com/im/pictures/hosting/Hosting-U3RheVN1cHBseUxpc3Rpbmc6MTI4MjY1MjExNjAyMjI4NjQ1OA%3D%3D/original/c93b2191-a1a9-4fbf-8980-d69d9c3bf164.jpeg?im_w=480&im_format=avif)
[V-Home] Center of Quadrilatero - with 2 bedrooms
Entire Place • 2 bedrooms

Piazza C Apartment - in the heart of Turin
Entire Place • 2 bedrooms
Note: Performance varies based on location, size, amenities, seasonality, and management quality. Data reflects the past 12 months.
Top Performing Airbnb Hosts in Torino (2026)
Learn from the best! This table showcases top-performing Airbnb hosts in Torino based on the number of properties managed and estimated total revenue over the past year. Analyze their scale and performance metrics.
| Host Name | Properties | Grossing Revenue | Stay Reviews | Avg Rating |
|---|---|---|---|---|
| GuestHost - Welcome To Turin | 19 | $250,335 | 250 | 4.17/5.0 |
| Maison Metropole | 13 | $96,089 | 67 | 4.27/5.0 |
| Atriums Apartments | 4 | $96,067 | 108 | 4.70/5.0 |
| Wonderful Italy Piemonte | 8 | $95,205 | 56 | 4.08/5.0 |
| Andrea | 1 | $94,400 | 59 | 4.92/5.0 |
| Ambrosini Suites | 4 | $90,996 | 72 | 4.59/5.0 |
| Francesco | 2 | $89,877 | 39 | 4.96/5.0 |
| Walter | 1 | $88,959 | 35 | 5.00/5.0 |
| Giada | 7 | $87,519 | 41 | 4.59/5.0 |
| Valeria | 1 | $68,885 | 63 | 4.95/5.0 |
Analyzing the strategies of top hosts, such as their property selection, pricing, and guest communication, can offer valuable lessons for optimizing your own Airbnb operations in Torino.
Dive Deeper: Advanced Torino STR Market Data (2026)
Ready to unlock more insights? AirROI provides access to advanced metrics and comprehensive Airbnb data for Torino. Explore detailed analytics beyond this report to refine your investment strategy, optimize pricing, and maximize your vacation rental profits.
Explore Advanced MetricsTorino Short-Term Rental Market Composition (2026): Property & Room Types
Room Type Distribution
Property Type Distribution
Market Composition Insights for Torino
- The Torino Airbnb market composition is heavily skewed towards Entire Home/Apt listings, which make up 90.8% of the 229 active rentals. This indicates strong guest preference for privacy and space.
- Looking at the property type distribution in Torino, Apartment/Condo properties are the most common (96.9%), reflecting the local real estate landscape.
- Smaller segments like house, hotel/boutique (combined 3.0%) offer potential for unique stay experiences.
Torino Airbnb Room Capacity Analysis (2026): Bedroom Distribution
Distribution of Listings by Number of Bedrooms
Room Capacity Insights for Torino
- The dominant room capacity in Torino is 1 bedroom listings, making up 63.8% of the market. This suggests a strong demand for properties suitable for couples or solo travelers.
- Together, 1 bedroom and 2 bedrooms properties represent 82.1% of the active Airbnb listings in Torino, indicating a high concentration in these sizes.
- With over half the market (63.8%) consisting of studios or 1-bedroom units, Torino is particularly well-suited for individuals or couples.
- Listings with 3+ bedrooms (4.8%) represent a smaller niche, potentially indicating an underserved market for larger group accommodations in Torino.
Torino Vacation Rental Guest Capacity Trends (2026)
Distribution of Listings by Guest Capacity
Guest Capacity Insights for Torino
- The most common guest capacity trend in Torino vacation rentals is listings accommodating 4 guests (35.4%). This suggests the primary traveler segment is likely small families or groups.
- Properties designed for 4 guests and 2 guests dominate the Torino STR market, accounting for 64.2% of listings.
- 14.4% of properties accommodate 6+ guests, serving the market segment for larger families or group travel in Torino.
- On average, properties in Torino are equipped to host 3.4 guests.
Torino Airbnb Booking Patterns (2026): Available vs. Booked Days
Available Days Distribution
Booked Days Distribution
Booking Pattern Insights for Torino
- The most common availability pattern in Torino falls within the 271-366 days range, representing 49.3% of listings. This suggests many properties have significant open periods on their calendars.
- Approximately 96.5% of listings show high availability (181+ days open annually), indicating potential for increased bookings or specific owner usage patterns.
- For booked days, the 91-180 days range is most frequent in Torino (48%), reflecting common guest stay durations or potential owner blocking patterns.
- A notable 4.4% of properties secure long booking periods (181+ days booked per year), highlighting successful long-term rental strategies or significant owner usage.
Torino Airbnb Minimum Stay Requirements Analysis
Distribution of Listings by Minimum Night Requirement
1 Night
69 listings
30.1% of total
2 Nights
51 listings
22.3% of total
3 Nights
2 listings
0.9% of total
4-6 Nights
3 listings
1.3% of total
7-29 Nights
2 listings
0.9% of total
30+ Nights
102 listings
44.5% of total
Key Insights
- The most prevalent minimum stay requirement in Torino is 30+ Nights, adopted by 44.5% of listings. This highlights the market's preference for longer commitments.
- A significant segment (44.5%) caters to monthly stays (30+ nights) in Torino, pointing to opportunities in the extended-stay market.
Recommendations
- Align with the market by considering a 30+ Nights minimum stay, as 44.5% of Torino hosts use this setting.
- Explore offering discounts for stays of 30+ nights to attract the 44.5% of the market seeking extended stays.
- Adjust minimum nights based on seasonality – potentially shorter during low season and longer during peak demand periods in Torino.
Torino Airbnb Cancellation Policy Trends Analysis (2026)
Limited
21 listings
9.2% of total
Super Strict 30 Days
4 listings
1.7% of total
Flexible
91 listings
39.7% of total
Moderate
95 listings
41.5% of total
Firm
14 listings
6.1% of total
Strict
4 listings
1.7% of total
Cancellation Policy Insights for Torino
- The prevailing Airbnb cancellation policy trend in Torino is Moderate, used by 41.5% of listings.
- The market strongly favors guest-friendly terms, with 81.2% of listings offering Flexible or Moderate policies. This suggests guests in Torino may expect booking flexibility.
- Strict cancellation policies are quite rare (1.7%), potentially making listings with this policy less competitive unless justified by high demand or property type.
Recommendations for Hosts
- Consider adopting a Moderate policy to align with the 41.5% market standard in Torino.
- Using a Strict policy might deter some guests, as only 1.7% of listings use it. Evaluate if potential revenue protection outweighs possible lower booking rates.
- Regularly review your cancellation policy against competitors and market demand shifts in Torino.
Torino STR Booking Lead Time Analysis (2026)
Average Booking Lead Time by Month
Booking Lead Time Insights for Torino
- The overall average booking lead time for vacation rentals in Torino is 22 days.
- Guests book furthest in advance for stays during November (average 43 days), likely coinciding with peak travel demand or local events.
- The shortest booking windows occur for stays in February (average 1 days), indicating more last-minute travel plans during this time.
- Seasonally, Fall (33 days avg.) sees the longest lead times, while Spring (5 days avg.) has the shortest, reflecting typical travel planning cycles.
Recommendations for Hosts
- Use the overall average lead time (22 days) as a baseline for your pricing and availability strategy in Torino.
- For November stays, consider implementing length-of-stay discounts or slightly higher rates for bookings made less than 43 days out to capitalize on advance planning.
- During February, focus on last-minute booking availability and promotions, as guests book with very short notice (1 days avg.).
- Target marketing efforts for the Fall season well in advance (at least 33 days) to capture early planners.
- Monitor your own booking lead times against these Torino averages to identify opportunities for dynamic pricing adjustments.
Popular & Essential Airbnb Amenities in Torino (2026)
Amenity Prevalence
Amenity Insights for Torino
- Essential amenities in Torino that guests expect include: Wifi. Lacking these (this) could significantly impact bookings.
- Popular amenities like Heating, Hair dryer, Kitchen are common but not universal. Offering these can provide a competitive edge.
Recommendations for Hosts
- Ensure your listing includes all essential amenities for Torino: Wifi.
- Prioritize adding missing essentials: Wifi.
- Consider adding popular differentiators like Heating or Hair dryer to increase appeal.
- Highlight unique or less common amenities you offer (e.g., hot tub, dedicated workspace, EV charger) in your listing description and photos.
- Regularly check competitor amenities in Torino to stay competitive.
Torino Airbnb Guest Demographics & Profile Analysis (2026)
Guest Profile Summary for Torino
- The typical guest profile for Airbnb in Torino consists of predominantly international visitors (68%), with top international origins including France, typically belonging to the Post-2000s (Gen Z/Alpha) group (50%), primarily speaking English or Italian.
- Domestic travelers account for 32.1% of guests.
- Key international markets include Italy (32.1%) and France (20.7%).
- Top languages spoken are English (35.5%) followed by Italian (18.2%).
- A significant demographic segment is the Post-2000s (Gen Z/Alpha) group, representing 50% of guests.
Recommendations for Hosts
- Focus marketing internationally, particularly towards travelers from France.
- Tailor amenities and listing descriptions to appeal to the dominant Post-2000s (Gen Z/Alpha) demographic (e.g., highlight fast WiFi, smart home features, local guides).
- Highlight unique local experiences or amenities relevant to the primary guest profile.
- Consider seasonal promotions aligned with peak travel times for key origin markets.
Nearby Short-Term Rental Market Comparison
How does the Torino Airbnb market stack up against its neighbors? Compare key performance metrics like average monthly revenue, ADR, and occupancy rates in surrounding areas to understand the broader regional STR landscape.
| Market | Active Properties | Monthly Revenue | Daily Rate | Avg. Occupancy |
|---|---|---|---|---|
| Brienzwiler | 11 | $7,335 | $514.27 | 60% |
| Niederried bei Interlaken | 19 | $6,267 | $552.03 | 44% |
| Lauterbrunnen | 552 | $6,108 | $487.83 | 51% |
| Ranco | 12 | $5,691 | $536.46 | 42% |
| Matten bei Interlaken | 64 | $5,607 | $336.51 | 59% |
| Grindelwald | 513 | $5,587 | $396.62 | 56% |
| Les Clefs | 34 | $5,585 | $314.08 | 47% |
| Monteu Roero | 12 | $5,184 | $403.07 | 41% |
| Wengen | 12 | $5,115 | $595.38 | 46% |
| Oberhofen am Thunersee | 25 | $5,051 | $329.28 | 51% |