Verduno Airbnb Market Analysis 2025: Short Term Rental Data & Vacation Rental Statistics in Piedmont, Italy
Is Airbnb profitable in Verduno in 2025? Explore comprehensive Airbnb analytics for Verduno, Piedmont, Italy to uncover income potential. This 2025 STR market report for Verduno, based on AirROI data from September 2024 to August 2025, reveals key trends in the niche market of 18 active listings.
Whether you're considering an Airbnb investment in Verduno, optimizing your existing vacation rental, or exploring rental arbitrage opportunities, understanding the Verduno Airbnb data is crucial. Leveraging the low regulation environment is key to maximizing your short term rental income potential. Let's dive into the specifics.
Key Verduno Airbnb Performance Metrics Overview
Monthly Airbnb Revenue Variations & Income Potential in Verduno (2025)
Understanding the monthly revenue variations for Airbnb listings in Verduno is key to maximizing your short term rental income potential. Seasonality significantly impacts earnings. Our analysis, based on data from the past 12 months, shows that the peak revenue month for STRs in Verduno is typically July, while January often presents the lowest earnings, highlighting opportunities for strategic pricing adjustments during shoulder and low seasons. Explore the typical Airbnb income in Verduno across different performance tiers:
- Best-in-class properties (Top 10%) achieve $4,543+ monthly, often utilizing dynamic pricing and superior guest experiences.
- Strong performing properties (Top 25%) earn $2,332 or more, indicating effective management and desirable locations/amenities.
- Typical properties (Median) generate around $1,259 per month, representing the average market performance.
- Entry-level properties (Bottom 25%) see earnings around $645, often with potential for optimization.
Average Monthly Airbnb Earnings Trend in Verduno
Verduno Airbnb Occupancy Rate Trends (2025)
Maximize your bookings by understanding the Verduno STR occupancy trends. Seasonal demand shifts significantly influence how often properties are booked. Typically, Octobersees the highest demand (peak season occupancy), while February experiences the lowest (low season). Effective strategies, like adjusting minimum stays or offering promotions, can boost occupancy during slower periods. Here's how different property tiers perform in Verduno:
- Best-in-class properties (Top 10%) achieve 61%+ occupancy, indicating high desirability and potentially optimized availability.
- Strong performing properties (Top 25%) maintain 45% or higher occupancy, suggesting good market fit and guest satisfaction.
- Typical properties (Median) have an occupancy rate around 27%.
- Entry-level properties (Bottom 25%) average 12% occupancy, potentially facing higher vacancy.
Average Monthly Occupancy Rate Trend in Verduno
Average Daily Rate (ADR) Airbnb Trends in Verduno (2025)
Effective short term rental pricing strategy in Verduno involves understanding monthly ADR fluctuations. The Average Daily Rate (ADR) for Airbnb in Verduno typically peaks in August and dips lowest during February. Leveraging Airbnb dynamic pricing tools or strategies based on this seasonality can significantly boost revenue. Here's a look at the typical nightly rates achieved:
- Best-in-class properties (Top 10%) command rates of $710+ per night, often due to premium features or locations.
- Strong performing properties (Top 25%) achieve nightly rates of $193 or more.
- Typical properties (Median) charge around $139 per night.
- Entry-level properties (Bottom 25%) earn around $109 per night.
Average Daily Rate (ADR) Trend by Month in Verduno
Get Live Verduno Market Intelligence 👇
Explore Real-time Analytics
Airbnb Seasonality Analysis & Trends in Verduno (2025)
Peak Season (July, June, August)
- Revenue averages $3,131 per month
- Occupancy rates average 41.5%
- Daily rates average $302
Shoulder Season
- Revenue averages $1,857 per month
- Occupancy maintains around 34.8%
- Daily rates hold near $262
Low Season (January, February, March)
- Revenue drops to average $836 per month
- Occupancy decreases to average 15.8%
- Daily rates adjust to average $244
Seasonality Insights for Verduno
- The Airbnb seasonality in Verduno shows highly seasonal trends requiring careful strategy. While the sections above show seasonal averages, it's also insightful to look at the extremes:
- During the high season, the absolute peak month showcases Verduno's highest earning potential, with monthly revenues capable of climbing to $3,806, occupancy reaching a high of 59.0%, and ADRs peaking at $306.
- Conversely, the slowest single month of the year, typically falling within the low season, marks the market's lowest point. In this month, revenue might dip to $524, occupancy could drop to 13.7%, and ADRs may adjust down to $238.
- Understanding both the seasonal averages and these monthly peaks and troughs in revenue, occupancy, and ADR is crucial for maximizing your Airbnb profit potential in Verduno.
Seasonal Strategies for Maximizing Profit
- Peak Season: Maximize revenue through premium pricing and potentially longer minimum stays. Ensure high availability.
- Low Season: Offer competitive pricing, special promotions (e.g., extended stay discounts), and flexible cancellation policies. Target off-season travelers like remote workers or budget-conscious guests.
- Shoulder Seasons: Implement dynamic pricing that balances peak and low rates. Target weekend travelers or specific events. Offer slightly more flexible terms than peak season.
- Regularly analyze your own performance against these Verduno seasonality benchmarks and adjust your pricing and availability strategy accordingly.
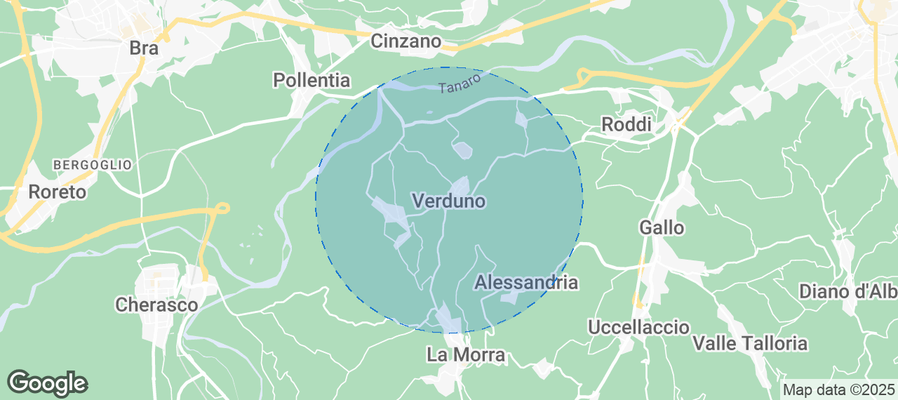
Best Areas for Airbnb Investment in Verduno (2025)
Exploring the top neighborhoods for short-term rentals in Verduno? This section highlights key areas, outlining why they are attractive for hosts and guests, along with notable local attractions. Consider these locations based on your target guest profile and investment strategy.
| Neighborhood / Area | Why Host Here? (Target Guests & Appeal) | Key Attractions & Landmarks |
|---|---|---|
| Centro Storico | The historic center of Verduno features charming streets, traditional architecture, and proximity to local attractions. It's ideal for tourists who want to experience authentic Italian culture and cuisine. | Verduno Castle, Local wine cellars, Piedmontese cuisine restaurants, Church of San Francesco, Local art galleries |
| Vineyards of Verduno | Surrounding areas filled with renowned vineyards and wineries offer a picturesque setting for wine tourism. Perfect for guests looking to enjoy wine tastings and beautiful landscapes. | Bricco del Cucù, Cappella del Barolo, Wine tasting tours, Vineyard walks, Local wine festivals |
| Trattoria del Bacco | A popular dining spot in Verduno known for its excellent local dishes and wines. Tourists often visit for culinary experiences, making it a great area for food enthusiasts. | Authentic Piedmontese cuisine, Cooking classes, Local food markets, Wine pairing dinners, Gastronomy events |
| Natural Reserves | The nearby natural reserves provide opportunities for hiking and outdoor activities, attracting nature lovers and those seeking a retreat in nature. Ideal for guests looking for tranquility and exploration. | Natural Park of the Barolo, Hiking trails, Scenic viewpoints, Flora and fauna watching, Outdoor sports |
| Local Markets | Access to local markets where visitors can experience the vibrant atmosphere and shop for local produce. Great for travelers who appreciate local culture and products. | Verduno weekly market, Local handicrafts, Piedmont cheese stalls, Fresh produce stands, Cultural events and festivals |
| Nearby Barolo | Located close to Barolo, a famous wine town, attracting wine aficionados and tourists. Guests can enjoy wine tours and visit prestigious wineries. | Barolo Castle, Wine tours, Enoteca Regionale del Barolo, Local dining experiences, Cultural events |
| Scenic Lookouts | The scenic lookouts in and around Verduno provide breathtaking views of the rolling hills and vineyards, ideal for romantic getaways and photography enthusiasts. | Belvedere di Verduno, Panoramic viewpoints, Photography spots, Sunset watching, Picnic areas |
| Cultural Events | Hosting several cultural events and festivals throughout the year, this area attracts visitors interested in local traditions, art, and music, enhancing the cultural experience. | Annual wine festivals, Local art exhibitions, Music events, Culinary festivals, Historical reenactments |
Understanding Airbnb License Requirements & STR Laws in Verduno (2025)
While Verduno, Piedmont, Italy currently shows low STR regulations, specific Airbnb license requirements might still exist or change. Always verify the latest short term rental regulations and Airbnb license requirements directly with local government authorities for Verduno to ensure full compliance before hosting.
(Source: AirROI data, 2025, based on 6% licensed listings)
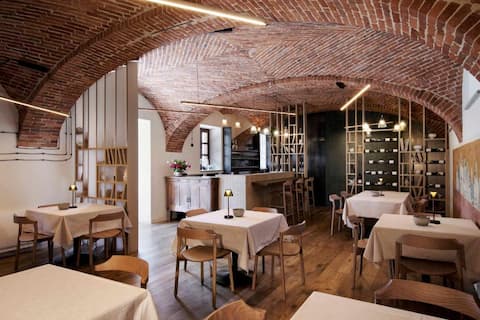
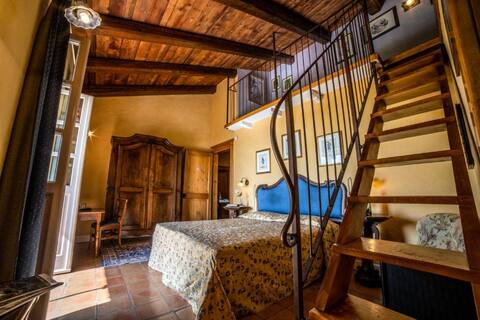
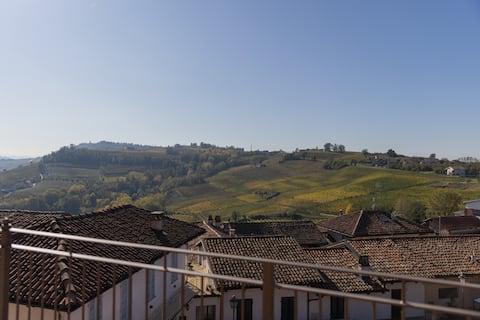
Top Performing Airbnb Properties in Verduno (2025)
Benchmark your potential! Explore examples of top-performing Airbnb properties in Verdunobased on Trailing Twelve Month (TTM) revenue. Analyze their characteristics, revenue, occupancy rate, and ADR to understand what drives success in this market.

Villa La Bogliona
Entire Place • 4 bedrooms

Villa I Bricchi
Entire Place • 5 bedrooms
![Swimming Pool Langhe View [Domus in Cauda] - WI-FI](https://a0.muscache.com/im/pictures/hosting/Hosting-U3RheVN1cHBseUxpc3Rpbmc6MTI3MzgzMDQzMDQ2Mzg5MDYyNg%3D%3D/original/7778d2ce-e486-41a6-be1c-24c3570158ff.jpeg?im_w=480&im_format=avif)
Swimming Pool Langhe View [Domus in Cauda] - WI-FI
Entire Place • 1 bedroom
Agriturismo Ca' del Re Double Room Deluxe
Private Room • N/A
Villa Bricco dei Cogni - Country Residence Room 2
Private Room • N/A
BuonVivere House with Terrace
Entire Place • 2 bedrooms
Note: Performance varies based on location, size, amenities, seasonality, and management quality. Data reflects the past 12 months.
Top Performing Airbnb Hosts in Verduno (2025)
Learn from the best! This table showcases top-performing Airbnb hosts in Verduno based on the number of properties managed and estimated total revenue over the past year. Analyze their scale and performance metrics.
| Host Name | Properties | Grossing Revenue | Stay Reviews | Avg Rating |
|---|---|---|---|---|
| Davide | 2 | $74,229 | 3 | Not Rated |
| Ca' Del Re | 4 | $53,948 | 10 | 4.67/5.0 |
| Elia | 4 | $49,074 | 42 | 4.93/5.0 |
| Cascina Arcangelo Raffaele | 3 | $38,522 | 89 | 4.64/5.0 |
| Gabriele | 1 | $34,423 | 17 | 4.94/5.0 |
| Claudia | 1 | $25,422 | 3 | 5.00/5.0 |
| Salvatore | 2 | $6,838 | 15 | 4.50/5.0 |
| Gabriella | 1 | $844 | 4 | 5.00/5.0 |
Analyzing the strategies of top hosts, such as their property selection, pricing, and guest communication, can offer valuable lessons for optimizing your own Airbnb operations in Verduno.
Dive Deeper: Advanced Verduno STR Market Data (2025)
Ready to unlock more insights? AirROI provides access to advanced metrics and comprehensive Airbnb data for Verduno. Explore detailed analytics beyond this report to refine your investment strategy, optimize pricing, and maximize your vacation rental profits.
Explore Advanced MetricsVerduno Short-Term Rental Market Composition (2025): Property & Room Types
Room Type Distribution
Property Type Distribution
Market Composition Insights for Verduno
- The Verduno Airbnb market composition is heavily skewed towards Entire Home/Apt listings, which make up 61.1% of the 18 active rentals. This indicates strong guest preference for privacy and space.
- However, a notable 38.9% share for Private Rooms suggests opportunities for budget-conscious travelers or hosts renting out spare rooms.
- Looking at the property type distribution in Verduno, Apartment/Condo properties are the most common (50%), reflecting the local real estate landscape.
- Houses represent a significant 16.7% portion, catering likely to families or larger groups.
- The presence of 5.6% Hotel/Boutique listings indicates integration with traditional hospitality.
Verduno Airbnb Room Capacity Analysis (2025): Bedroom Distribution
Distribution of Listings by Number of Bedrooms
Room Capacity Insights for Verduno
- The dominant room capacity in Verduno is 1 bedroom listings, making up 38.9% of the market. This suggests a strong demand for properties suitable for couples or solo travelers.
- Together, 1 bedroom and 2 bedrooms properties represent 50.0% of the active Airbnb listings in Verduno, indicating a high concentration in these sizes.
Verduno Vacation Rental Guest Capacity Trends (2025)
Distribution of Listings by Guest Capacity
Guest Capacity Insights for Verduno
- The most common guest capacity trend in Verduno vacation rentals is listings accommodating 4 guests (16.7%). This suggests the primary traveler segment is likely small families or groups.
- Properties designed for 4 guests and 3 guests dominate the Verduno STR market, accounting for 27.8% of listings.
- 16.8% of properties accommodate 6+ guests, serving the market segment for larger families or group travel in Verduno.
- On average, properties in Verduno are equipped to host 2.7 guests.
Verduno Airbnb Booking Patterns (2025): Available vs. Booked Days
Available Days Distribution
Booked Days Distribution
Booking Pattern Insights for Verduno
- The most common availability pattern in Verduno falls within the 271-366 days range, representing 61.1% of listings. This suggests many properties have significant open periods on their calendars.
- Approximately 100.0% of listings show high availability (181+ days open annually), indicating potential for increased bookings or specific owner usage patterns.
- For booked days, the 91-180 days range is most frequent in Verduno (44.4%), reflecting common guest stay durations or potential owner blocking patterns.
Verduno Airbnb Minimum Stay Requirements Analysis
Distribution of Listings by Minimum Night Requirement
1 Night
5 listings
27.8% of total
2 Nights
5 listings
27.8% of total
3 Nights
1 listings
5.6% of total
7-29 Nights
2 listings
11.1% of total
30+ Nights
5 listings
27.8% of total
Key Insights
- The most prevalent minimum stay requirement in Verduno is 1 Night, adopted by 27.8% of listings. This highlights the market's preference for shorter, flexible bookings.
- A significant segment (27.8%) caters to monthly stays (30+ nights) in Verduno, pointing to opportunities in the extended-stay market.
Recommendations
- Align with the market by considering a 1 Night minimum stay, as 27.8% of Verduno hosts use this setting.
- If feasible, allowing 1-night stays, especially midweek or during low season, could capture last-minute bookings, as only 27.8% currently do.
- Explore offering discounts for stays of 30+ nights to attract the 27.8% of the market seeking extended stays.
- Adjust minimum nights based on seasonality – potentially shorter during low season and longer during peak demand periods in Verduno.
Verduno Airbnb Cancellation Policy Trends Analysis (2025)
Super Strict 60 Days
1 listings
5.6% of total
Super Strict 30 Days
1 listings
5.6% of total
Moderate
14 listings
77.8% of total
Strict
2 listings
11.1% of total
Cancellation Policy Insights for Verduno
- The prevailing Airbnb cancellation policy trend in Verduno is Moderate, used by 77.8% of listings.
- The market strongly favors guest-friendly terms, with 77.8% of listings offering Flexible or Moderate policies. This suggests guests in Verduno may expect booking flexibility.
Recommendations for Hosts
- Consider adopting a Moderate policy to align with the 77.8% market standard in Verduno.
- Using a Strict policy might deter some guests, as only 11.1% of listings use it. Evaluate if potential revenue protection outweighs possible lower booking rates.
- Regularly review your cancellation policy against competitors and market demand shifts in Verduno.
Verduno STR Booking Lead Time Analysis (2025)
Average Booking Lead Time by Month
Booking Lead Time Insights for Verduno
- The overall average booking lead time for vacation rentals in Verduno is 62 days.
- Guests book furthest in advance for stays during June (average 97 days), likely coinciding with peak travel demand or local events.
- The shortest booking windows occur for stays in January (average 25 days), indicating more last-minute travel plans during this time.
- Seasonally, Summer (80 days avg.) sees the longest lead times, while Winter (34 days avg.) has the shortest, reflecting typical travel planning cycles.
Recommendations for Hosts
- Use the overall average lead time (62 days) as a baseline for your pricing and availability strategy in Verduno.
- For June stays, consider implementing length-of-stay discounts or slightly higher rates for bookings made less than 97 days out to capitalize on advance planning.
- Target marketing efforts for the Summer season well in advance (at least 80 days) to capture early planners.
- Monitor your own booking lead times against these Verduno averages to identify opportunities for dynamic pricing adjustments.
Popular & Essential Airbnb Amenities in Verduno (2025)
Amenity Prevalence
Amenity Insights for Verduno
- Essential amenities in Verduno that guests expect include: Wifi. Lacking these (this) could significantly impact bookings.
- Popular amenities like Hair dryer, Outdoor dining area, Essentials are common but not universal. Offering these can provide a competitive edge.
Recommendations for Hosts
- Ensure your listing includes all essential amenities for Verduno: Wifi.
- Consider adding popular differentiators like Hair dryer or Outdoor dining area to increase appeal.
- Highlight unique or less common amenities you offer (e.g., hot tub, dedicated workspace, EV charger) in your listing description and photos.
- Regularly check competitor amenities in Verduno to stay competitive.
Verduno Airbnb Guest Demographics & Profile Analysis (2025)
Guest Profile Summary for Verduno
- The typical guest profile for Airbnb in Verduno consists of predominantly international visitors (82%), with top international origins including Italy, typically belonging to the Post-2000s (Gen Z/Alpha) group (50%), primarily speaking English or German.
- Domestic travelers account for 18.4% of guests.
- Key international markets include Switzerland (21.1%) and Italy (18.4%).
- Top languages spoken are English (37.9%) followed by German (17.2%).
- A significant demographic segment is the Post-2000s (Gen Z/Alpha) group, representing 50% of guests.
Recommendations for Hosts
- Focus marketing internationally, particularly towards travelers from Italy.
- Tailor amenities and listing descriptions to appeal to the dominant Post-2000s (Gen Z/Alpha) demographic (e.g., highlight fast WiFi, smart home features, local guides).
- Highlight unique local experiences or amenities relevant to the primary guest profile.
- Consider seasonal promotions aligned with peak travel times for key origin markets.
Nearby Short-Term Rental Market Comparison
How does the Verduno Airbnb market stack up against its neighbors? Compare key performance metrics like average monthly revenue, ADR, and occupancy rates in surrounding areas to understand the broader regional STR landscape.
| Market | Active Properties | Monthly Revenue | Daily Rate | Avg. Occupancy |
|---|---|---|---|---|
| Les Clefs | 34 | $5,895 | $319.30 | 43% |
| Monteu Roero | 11 | $5,562 | $419.23 | 44% |
| Ranco | 13 | $4,237 | $443.85 | 38% |
| Manigod | 214 | $3,915 | $444.48 | 39% |
| Saint-Jean-Cap-Ferrat | 109 | $3,826 | $444.36 | 44% |
| Cossano Belbo | 13 | $3,748 | $368.77 | 36% |
| Saint-Nicolas-la-Chapelle | 26 | $3,546 | $450.58 | 42% |
| Val-d'Isère | 480 | $3,366 | $389.98 | 47% |
| Ramatuelle | 226 | $3,352 | $645.94 | 37% |
| La Môle | 16 | $3,268 | $457.45 | 36% |