Verbania Airbnb Market Analysis 2026: Short Term Rental Data & Vacation Rental Statistics in Piedmont, Italy
Is Airbnb profitable in Verbania in 2026? Explore comprehensive Airbnb analytics for Verbania, Piedmont, Italy to uncover income potential. This 2026 STR market report for Verbania, based on AirROI data from February 2025 to January 2026, reveals key trends in the market of 294 active listings.
Whether you're considering an Airbnb investment in Verbania, optimizing your existing vacation rental, or exploring rental arbitrage opportunities, understanding the Verbania Airbnb data is crucial. Navigating the high regulation landscape is key to maximizing your short term rental income potential. Let's dive into the specifics.
Key Verbania Airbnb Performance Metrics Overview
Monthly Airbnb Revenue Variations & Income Potential in Verbania (2026)
Understanding the monthly revenue variations for Airbnb listings in Verbania is key to maximizing your short term rental income potential. Seasonality significantly impacts earnings. Our analysis, based on data from the past 12 months, shows that the peak revenue month for STRs in Verbania is typically August, while February often presents the lowest earnings, highlighting opportunities for strategic pricing adjustments during shoulder and low seasons. Explore the typical Airbnb income in Verbania across different performance tiers:
- Best-in-class properties (Top 10%) achieve $3,236+ monthly, often utilizing dynamic pricing and superior guest experiences.
- Strong performing properties (Top 25%) earn $2,152 or more, indicating effective management and desirable locations/amenities.
- Typical properties (Median) generate around $1,381 per month, representing the average market performance.
- Entry-level properties (Bottom 25%) see earnings around $741, often with potential for optimization.
Average Monthly Airbnb Earnings Trend in Verbania
Verbania Airbnb Occupancy Rate Trends (2026)
Maximize your bookings by understanding the Verbania STR occupancy trends. Seasonal demand shifts significantly influence how often properties are booked. Typically, Augustsees the highest demand (peak season occupancy), while January experiences the lowest (low season). Effective strategies, like adjusting minimum stays or offering promotions, can boost occupancy during slower periods. Here's how different property tiers perform in Verbania:
- Best-in-class properties (Top 10%) achieve 71%+ occupancy, indicating high desirability and potentially optimized availability.
- Strong performing properties (Top 25%) maintain 56% or higher occupancy, suggesting good market fit and guest satisfaction.
- Typical properties (Median) have an occupancy rate around 37%.
- Entry-level properties (Bottom 25%) average 20% occupancy, potentially facing higher vacancy.
Average Monthly Occupancy Rate Trend in Verbania
Average Daily Rate (ADR) Airbnb Trends in Verbania (2026)
Effective short term rental pricing strategy in Verbania involves understanding monthly ADR fluctuations. The Average Daily Rate (ADR) for Airbnb in Verbania typically peaks in August and dips lowest during November. Leveraging Airbnb dynamic pricing tools or strategies based on this seasonality can significantly boost revenue. Here's a look at the typical nightly rates achieved:
- Best-in-class properties (Top 10%) command rates of $230+ per night, often due to premium features or locations.
- Strong performing properties (Top 25%) achieve nightly rates of $158 or more.
- Typical properties (Median) charge around $116 per night.
- Entry-level properties (Bottom 25%) earn around $93 per night.
Average Daily Rate (ADR) Trend by Month in Verbania
Get Live Verbania Market Intelligence 👇

Explore Real-time Analytics
Airbnb Seasonality Analysis & Trends in Verbania (2026)
Peak Season (August, July, June)
- Revenue averages $3,052 per month
- Occupancy rates average 58.7%
- Daily rates average $182
Shoulder Season
- Revenue averages $1,687 per month
- Occupancy maintains around 39.2%
- Daily rates hold near $164
Low Season (January, February, December)
- Revenue drops to average $763 per month
- Occupancy decreases to average 19.9%
- Daily rates adjust to average $162
Seasonality Insights for Verbania
- The Airbnb seasonality in Verbania shows highly seasonal trends requiring careful strategy. While the sections above show seasonal averages, it's also insightful to look at the extremes:
- During the high season, the absolute peak month showcases Verbania's highest earning potential, with monthly revenues capable of climbing to $3,439, occupancy reaching a high of 66.8%, and ADRs peaking at $185.
- Conversely, the slowest single month of the year, typically falling within the low season, marks the market's lowest point. In this month, revenue might dip to $600, occupancy could drop to 15.3%, and ADRs may adjust down to $159.
- Understanding both the seasonal averages and these monthly peaks and troughs in revenue, occupancy, and ADR is crucial for maximizing your Airbnb profit potential in Verbania.
Seasonal Strategies for Maximizing Profit
- Peak Season: Maximize revenue through premium pricing and potentially longer minimum stays. Ensure high availability.
- Low Season: Offer competitive pricing, special promotions (e.g., extended stay discounts), and flexible cancellation policies. Target off-season travelers like remote workers or budget-conscious guests.
- Shoulder Seasons: Implement dynamic pricing that balances peak and low rates. Target weekend travelers or specific events. Offer slightly more flexible terms than peak season.
- Regularly analyze your own performance against these Verbania seasonality benchmarks and adjust your pricing and availability strategy accordingly.
Best Areas for Airbnb Investment in Verbania (2026)
Exploring the top neighborhoods for short-term rentals in Verbania? This section highlights key areas, outlining why they are attractive for hosts and guests, along with notable local attractions. Consider these locations based on your target guest profile and investment strategy.
| Neighborhood / Area | Why Host Here? (Target Guests & Appeal) | Key Attractions & Landmarks |
|---|---|---|
| Lake Maggiore | Stunning lakefront area perfect for vacationers seeking relaxation and outdoor activities. Popular for water sports, hiking, and beautiful scenery. | Villa Taranto Botanical Gardens, Isola Bella, Isola Madre, Stresa, Mottarone, Castles of Cannero |
| Verbania Intra | The main town in Verbania offering vibrant shops, local restaurants, and a bustling waterfront. Attracts visitors looking for a mix of culture and leisure by the lake. | Intra Ferry Terminal, Sanctuary of Santa Maria del Monte, Piazza Ranzoni, Palazzo Dugnani, Lakeside Promenade, Forest of Valgrande |
| Suna | A charming district in Verbania known for its picturesque lakeside views and tranquility. It's ideal for those seeking a peaceful stay away from the crowd. | Basilica di San Vittore, Lakeside Park, Local beaches, Suna Port, Walking trails, Restaurants with lake views |
| Germignaga | A small yet enchanting area on the opposite side of Lake Maggiore, popular for its serene atmosphere and natural beauty, attracting nature lovers. | Spiaggia di Germignaga, Natural Reserve of Val Grande, Hiking trails, Scenic viewpoints, Local eateries |
| Baveno | Just across the lake, Baveno offers beautiful views and proximity to the Borromean Islands, making it a great spot for tourists. | Baveno Beach, Borromean Islands, Cemetery of Baveno, Piazza IV Novembre, Local shops, Dining with lake views |
| Stresa | A famous tourist destination on the western shore of Lake Maggiore known for luxury hotels and proximity to the mountains, ideal for adventure lovers. | Fiume Maggiore, Cable Car to Mottarone, Isola Pescatori, Piazza Marconi, Villa Pallavicino Park |
| Cannobio | A little gem on the shores of Lake Maggiore, known for its delightful old town and lakeside promenade, drawing visitors for its charm and cultural experience. | Cannobio Old Town, Lakeside Market, Church of San Vittore, Local beaches, Local festivals |
| Pallanza | A tranquil area noted for its beautiful villas, gardens, and access to the lake, attracting families and couples seeking a serene getaway. | Villa Giulia, Parco Villa Taranto, Local beaches, Pallanza Promenade, Historical buildings |
Understanding Airbnb License Requirements & STR Laws in Verbania (2026)
Yes, Verbania, Piedmont, Italy enforces high STR regulations. Obtaining a license and ensuring compliance is almost certainly required according to current 2026 STR laws. Always verify the latest short term rental regulations and Airbnb license requirements directly with local government authorities for Verbania to ensure full compliance before hosting.
(Source: AirROI data, 2026, based on 89% licensed listings)
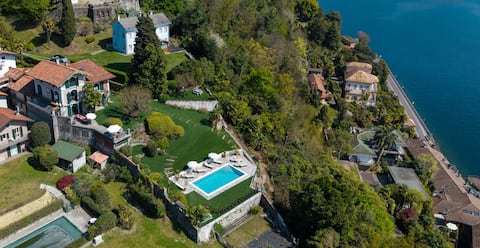
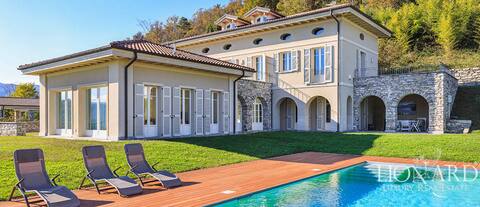
Top Performing Airbnb Properties in Verbania (2026)
Benchmark your potential! Explore examples of top-performing Airbnb properties in Verbaniabased on Trailing Twelve Month (TTM) revenue. Analyze their characteristics, revenue, occupancy rate, and ADR to understand what drives success in this market.
Charming villa Il Motto with pool
Entire Place • 7 bedrooms
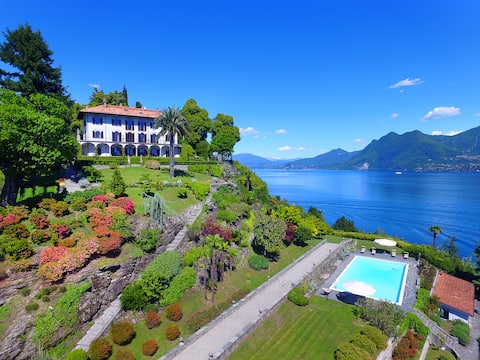
Gracious villa, pool & views! Villino San Remigio
Entire Place • 9 bedrooms

Aqualago holiday home Lake Maggiore
Entire Place • 8 bedrooms
Luxury Lake Maggiore villa
Entire Place • 3 bedrooms
Villa with pool at Lake Maggiore
Entire Place • 6 bedrooms

Isola Bella large charming accommodation overlooking the lake
Entire Place • 3 bedrooms
Note: Performance varies based on location, size, amenities, seasonality, and management quality. Data reflects the past 12 months.
Top Performing Airbnb Hosts in Verbania (2026)
Learn from the best! This table showcases top-performing Airbnb hosts in Verbania based on the number of properties managed and estimated total revenue over the past year. Analyze their scale and performance metrics.
| Host Name | Properties | Grossing Revenue | Stay Reviews | Avg Rating |
|---|---|---|---|---|
| Lago Maggiore | 10 | $359,768 | 185 | 4.73/5.0 |
| Michela | 10 | $307,478 | 625 | 4.86/5.0 |
| La Tua Casa | 22 | $268,858 | 368 | 4.34/5.0 |
| Northitaly Villas | 3 | $151,478 | 19 | 4.77/5.0 |
| Lake And Italy Prestige Rental | 11 | $143,725 | 93 | 4.42/5.0 |
| Paolo | 4 | $132,657 | 28 | 5.00/5.0 |
| Joanne Elizabeth | 2 | $132,077 | 37 | 4.95/5.0 |
| Andrea | 3 | $81,941 | 295 | 4.90/5.0 |
| Gudrun | 3 | $75,265 | 320 | 4.85/5.0 |
| Lena - Interhome | 4 | $74,918 | 35 | 4.60/5.0 |
Analyzing the strategies of top hosts, such as their property selection, pricing, and guest communication, can offer valuable lessons for optimizing your own Airbnb operations in Verbania.
Dive Deeper: Advanced Verbania STR Market Data (2026)
Ready to unlock more insights? AirROI provides access to advanced metrics and comprehensive Airbnb data for Verbania. Explore detailed analytics beyond this report to refine your investment strategy, optimize pricing, and maximize your vacation rental profits.
Explore Advanced MetricsVerbania Short-Term Rental Market Composition (2026): Property & Room Types
Room Type Distribution
Property Type Distribution
Market Composition Insights for Verbania
- The Verbania Airbnb market composition is heavily skewed towards Entire Home/Apt listings, which make up 96.6% of the 294 active rentals. This indicates strong guest preference for privacy and space.
- Looking at the property type distribution in Verbania, Apartment/Condo properties are the most common (75.5%), reflecting the local real estate landscape.
- Houses represent a significant 21.4% portion, catering likely to families or larger groups.
- Smaller segments like hotel/boutique, others, outdoor/unique (combined 3.0%) offer potential for unique stay experiences.
Verbania Airbnb Room Capacity Analysis (2026): Bedroom Distribution
Distribution of Listings by Number of Bedrooms
Room Capacity Insights for Verbania
- The dominant room capacity in Verbania is 1 bedroom listings, making up 55.1% of the market. This suggests a strong demand for properties suitable for couples or solo travelers.
- Together, 1 bedroom and 2 bedrooms properties represent 84.0% of the active Airbnb listings in Verbania, indicating a high concentration in these sizes.
- With over half the market (55.1%) consisting of studios or 1-bedroom units, Verbania is particularly well-suited for individuals or couples.
- Listings with 3+ bedrooms (9.5%) represent a smaller niche, potentially indicating an underserved market for larger group accommodations in Verbania.
Verbania Vacation Rental Guest Capacity Trends (2026)
Distribution of Listings by Guest Capacity
Guest Capacity Insights for Verbania
- The most common guest capacity trend in Verbania vacation rentals is listings accommodating 4 guests (41.2%). This suggests the primary traveler segment is likely small families or groups.
- Properties designed for 4 guests and 2 guests dominate the Verbania STR market, accounting for 57.5% of listings.
- 17.7% of properties accommodate 6+ guests, serving the market segment for larger families or group travel in Verbania.
- On average, properties in Verbania are equipped to host 4.1 guests.
Verbania Airbnb Booking Patterns (2026): Available vs. Booked Days
Available Days Distribution
Booked Days Distribution
Booking Pattern Insights for Verbania
- The most common availability pattern in Verbania falls within the 271-366 days range, representing 48% of listings. This suggests many properties have significant open periods on their calendars.
- Approximately 86.8% of listings show high availability (181+ days open annually), indicating potential for increased bookings or specific owner usage patterns.
- For booked days, the 91-180 days range is most frequent in Verbania (39.5%), reflecting common guest stay durations or potential owner blocking patterns.
- A notable 14.6% of properties secure long booking periods (181+ days booked per year), highlighting successful long-term rental strategies or significant owner usage.
Verbania Airbnb Minimum Stay Requirements Analysis
Distribution of Listings by Minimum Night Requirement
1 Night
29 listings
9.9% of total
2 Nights
53 listings
18% of total
3 Nights
60 listings
20.4% of total
4-6 Nights
19 listings
6.5% of total
7-29 Nights
9 listings
3.1% of total
30+ Nights
124 listings
42.2% of total
Key Insights
- The most prevalent minimum stay requirement in Verbania is 30+ Nights, adopted by 42.2% of listings. This highlights the market's preference for longer commitments.
- A significant segment (42.2%) caters to monthly stays (30+ nights) in Verbania, pointing to opportunities in the extended-stay market.
Recommendations
- Align with the market by considering a 30+ Nights minimum stay, as 42.2% of Verbania hosts use this setting.
- If feasible, allowing 1-night stays, especially midweek or during low season, could capture last-minute bookings, as only 9.9% currently do.
- Explore offering discounts for stays of 30+ nights to attract the 42.2% of the market seeking extended stays.
- Adjust minimum nights based on seasonality – potentially shorter during low season and longer during peak demand periods in Verbania.
Verbania Airbnb Cancellation Policy Trends Analysis (2026)
Limited
20 listings
6.8% of total
Super Strict 30 Days
12 listings
4.1% of total
Super Strict 60 Days
6 listings
2% of total
Flexible
53 listings
18% of total
Moderate
147 listings
50% of total
Firm
42 listings
14.3% of total
Strict
14 listings
4.8% of total
Cancellation Policy Insights for Verbania
- The prevailing Airbnb cancellation policy trend in Verbania is Moderate, used by 50% of listings.
- There's a relatively balanced mix between guest-friendly (68.0%) and stricter (19.1%) policies, offering choices for different guest needs.
- Strict cancellation policies are quite rare (4.8%), potentially making listings with this policy less competitive unless justified by high demand or property type.
Recommendations for Hosts
- Consider adopting a Moderate policy to align with the 50% market standard in Verbania.
- Using a Strict policy might deter some guests, as only 4.8% of listings use it. Evaluate if potential revenue protection outweighs possible lower booking rates.
- Regularly review your cancellation policy against competitors and market demand shifts in Verbania.
Verbania STR Booking Lead Time Analysis (2026)
Average Booking Lead Time by Month
Booking Lead Time Insights for Verbania
- The overall average booking lead time for vacation rentals in Verbania is 62 days.
- Guests book furthest in advance for stays during August (average 91 days), likely coinciding with peak travel demand or local events.
- The shortest booking windows occur for stays in February (average 20 days), indicating more last-minute travel plans during this time.
- Seasonally, Summer (77 days avg.) sees the longest lead times, while Winter (37 days avg.) has the shortest, reflecting typical travel planning cycles.
Recommendations for Hosts
- Use the overall average lead time (62 days) as a baseline for your pricing and availability strategy in Verbania.
- For August stays, consider implementing length-of-stay discounts or slightly higher rates for bookings made less than 91 days out to capitalize on advance planning.
- Target marketing efforts for the Summer season well in advance (at least 77 days) to capture early planners.
- Monitor your own booking lead times against these Verbania averages to identify opportunities for dynamic pricing adjustments.
Popular & Essential Airbnb Amenities in Verbania (2026)
Amenity Prevalence
Amenity Insights for Verbania
- Popular amenities like Kitchen, Heating, TV are common but not universal. Offering these can provide a competitive edge.
- Warning: Wifi is not universally provided but is considered essential globally. Ensure reliable Wifi is offered.
Recommendations for Hosts
- Consider adding popular differentiators like Kitchen or Heating to increase appeal.
- Highlight unique or less common amenities you offer (e.g., hot tub, dedicated workspace, EV charger) in your listing description and photos.
- Regularly check competitor amenities in Verbania to stay competitive.
Verbania Airbnb Guest Demographics & Profile Analysis (2026)
Guest Profile Summary for Verbania
- The typical guest profile for Airbnb in Verbania consists of predominantly international visitors (91%), with top international origins including France, typically belonging to the Post-2000s (Gen Z/Alpha) group (50%), primarily speaking English or German.
- Domestic travelers account for 9.1% of guests.
- Key international markets include Germany (33.8%) and France (23%).
- Top languages spoken are English (37%) followed by German (22.9%).
- A significant demographic segment is the Post-2000s (Gen Z/Alpha) group, representing 50% of guests.
Recommendations for Hosts
- Focus marketing internationally, particularly towards travelers from France.
- Tailor amenities and listing descriptions to appeal to the dominant Post-2000s (Gen Z/Alpha) demographic (e.g., highlight fast WiFi, smart home features, local guides).
- Highlight unique local experiences or amenities relevant to the primary guest profile.
- Consider seasonal promotions aligned with peak travel times for key origin markets.
Nearby Short-Term Rental Market Comparison
How does the Verbania Airbnb market stack up against its neighbors? Compare key performance metrics like average monthly revenue, ADR, and occupancy rates in surrounding areas to understand the broader regional STR landscape.
| Market | Active Properties | Monthly Revenue | Daily Rate | Avg. Occupancy |
|---|---|---|---|---|
| Brienzwiler | 11 | $7,335 | $514.27 | 60% |
| Niederried bei Interlaken | 19 | $6,267 | $552.03 | 44% |
| Lauterbrunnen | 552 | $6,108 | $487.83 | 51% |
| Ranco | 12 | $5,691 | $536.46 | 42% |
| Matten bei Interlaken | 64 | $5,607 | $336.51 | 59% |
| Grindelwald | 513 | $5,587 | $396.62 | 56% |
| Monteu Roero | 12 | $5,184 | $403.07 | 41% |
| Wengen | 12 | $5,115 | $595.38 | 46% |
| Oberhofen am Thunersee | 25 | $5,051 | $329.28 | 51% |
| Zermatt | 792 | $5,017 | $504.14 | 46% |