Susa Airbnb Market Analysis 2025: Short Term Rental Data & Vacation Rental Statistics in Piedmont, Italy
Is Airbnb profitable in Susa in 2025? Explore comprehensive Airbnb analytics for Susa, Piedmont, Italy to uncover income potential. This 2025 STR market report for Susa, based on AirROI data from December 2024 to November 2025, reveals key trends in the niche market of 18 active listings.
Whether you're considering an Airbnb investment in Susa, optimizing your existing vacation rental, or exploring rental arbitrage opportunities, understanding the Susa Airbnb data is crucial. Navigating the high regulation landscape is key to maximizing your short term rental income potential. Let's dive into the specifics.
Key Susa Airbnb Performance Metrics Overview
Monthly Airbnb Revenue Variations & Income Potential in Susa (2025)
Understanding the monthly revenue variations for Airbnb listings in Susa is key to maximizing your short term rental income potential. Seasonality significantly impacts earnings. Our analysis, based on data from the past 12 months, shows that the peak revenue month for STRs in Susa is typically August, while November often presents the lowest earnings, highlighting opportunities for strategic pricing adjustments during shoulder and low seasons. Explore the typical Airbnb income in Susa across different performance tiers:
- Best-in-class properties (Top 10%) achieve $2,315+ monthly, often utilizing dynamic pricing and superior guest experiences.
- Strong performing properties (Top 25%) earn $1,586 or more, indicating effective management and desirable locations/amenities.
- Typical properties (Median) generate around $968 per month, representing the average market performance.
- Entry-level properties (Bottom 25%) see earnings around $523, often with potential for optimization.
Average Monthly Airbnb Earnings Trend in Susa
Susa Airbnb Occupancy Rate Trends (2025)
Maximize your bookings by understanding the Susa STR occupancy trends. Seasonal demand shifts significantly influence how often properties are booked. Typically, Augustsees the highest demand (peak season occupancy), while November experiences the lowest (low season). Effective strategies, like adjusting minimum stays or offering promotions, can boost occupancy during slower periods. Here's how different property tiers perform in Susa:
- Best-in-class properties (Top 10%) achieve 79%+ occupancy, indicating high desirability and potentially optimized availability.
- Strong performing properties (Top 25%) maintain 58% or higher occupancy, suggesting good market fit and guest satisfaction.
- Typical properties (Median) have an occupancy rate around 32%.
- Entry-level properties (Bottom 25%) average 17% occupancy, potentially facing higher vacancy.
Average Monthly Occupancy Rate Trend in Susa
Average Daily Rate (ADR) Airbnb Trends in Susa (2025)
Effective short term rental pricing strategy in Susa involves understanding monthly ADR fluctuations. The Average Daily Rate (ADR) for Airbnb in Susa typically peaks in October and dips lowest during December. Leveraging Airbnb dynamic pricing tools or strategies based on this seasonality can significantly boost revenue. Here's a look at the typical nightly rates achieved:
- Best-in-class properties (Top 10%) command rates of $156+ per night, often due to premium features or locations.
- Strong performing properties (Top 25%) achieve nightly rates of $97 or more.
- Typical properties (Median) charge around $88 per night.
- Entry-level properties (Bottom 25%) earn around $74 per night.
Average Daily Rate (ADR) Trend by Month in Susa
Get Live Susa Market Intelligence 👇

Explore Real-time Analytics
Airbnb Seasonality Analysis & Trends in Susa (2025)
Peak Season (August, May, July)
- Revenue averages $1,911 per month
- Occupancy rates average 50.3%
- Daily rates average $102
Shoulder Season
- Revenue averages $1,158 per month
- Occupancy maintains around 40.9%
- Daily rates hold near $97
Low Season (February, March, November)
- Revenue drops to average $576 per month
- Occupancy decreases to average 26.9%
- Daily rates adjust to average $96
Seasonality Insights for Susa
- The Airbnb seasonality in Susa shows highly seasonal trends requiring careful strategy. While the sections above show seasonal averages, it's also insightful to look at the extremes:
- During the high season, the absolute peak month showcases Susa's highest earning potential, with monthly revenues capable of climbing to $2,222, occupancy reaching a high of 55.4%, and ADRs peaking at $107.
- Conversely, the slowest single month of the year, typically falling within the low season, marks the market's lowest point. In this month, revenue might dip to $385, occupancy could drop to 18.1%, and ADRs may adjust down to $91.
- Understanding both the seasonal averages and these monthly peaks and troughs in revenue, occupancy, and ADR is crucial for maximizing your Airbnb profit potential in Susa.
Seasonal Strategies for Maximizing Profit
- Peak Season: Maximize revenue through premium pricing and potentially longer minimum stays. Ensure high availability.
- Low Season: Offer competitive pricing, special promotions (e.g., extended stay discounts), and flexible cancellation policies. Target off-season travelers like remote workers or budget-conscious guests.
- Shoulder Seasons: Implement dynamic pricing that balances peak and low rates. Target weekend travelers or specific events. Offer slightly more flexible terms than peak season.
- Regularly analyze your own performance against these Susa seasonality benchmarks and adjust your pricing and availability strategy accordingly.
Best Areas for Airbnb Investment in Susa (2025)
Exploring the top neighborhoods for short-term rentals in Susa? This section highlights key areas, outlining why they are attractive for hosts and guests, along with notable local attractions. Consider these locations based on your target guest profile and investment strategy.
| Neighborhood / Area | Why Host Here? (Target Guests & Appeal) | Key Attractions & Landmarks |
|---|---|---|
| Susa Historic Center | The historic center of Susa is known for its rich history, beautiful architecture, and charming streets. It's an ideal location for tourists who want to explore ancient sites and enjoy local cuisine. | Roman Theater, Susa Cathedral, Arch of Augustus, Museum of Ancient Susa, Piazza San Giovanni |
| Moncenisio | A picturesque alpine village located near the French border, Moncenisio is popular for winter sports enthusiasts and nature lovers, making it a great destination year-round. | Lago del Moncenisio, Ski resorts, Hiking trails, Traditional alpine architecture |
| Cesana Torinese | Located in the Susa Valley, this ski resort town offers stunning mountain views and is popular for both summer and winter activities, making it attractive for both domestic and international tourists. | Via Lattea Ski Area, Mountain biking trails, Charming village center, Local restaurants and shops |
| Villar Dora | A quaint village near Susa, Villar Dora offers a peaceful escape with its natural beauty, ideal for outdoor activities and relaxation. | Nature parks, Hiking trails, Scenic views |
| Bardonecchia | A renowned ski resort, Bardonecchia attracts winter sports enthusiasts as well as summer hikers, with excellent accommodations and amenities for visitors. | Ski slopes, Bardonecchia train station, Local market, Mountain trails |
| Oulx | Oulx is a ski and holiday destination known for its accessibility and various outdoor activities, appealing to adventurers and families alike. | Nature reserves, Ski areas, Cycling paths, Local festivals |
| Salbertrand | A small village with beautiful landscapes and access to the Susa Valley Natural Park, perfect for those seeking tranquility and nature experiences. | Natural Park of Gran Bosco di Salbertrand, Hiking routes, Cultural heritage sites |
| Sauze d'Oulx | A lively ski resort with a vibrant nightlife and a wide range of winter sports facilities, Sauze d'Oulx is popular among younger crowds and families. | Sestriere ski area, Winter and summer festivals, Active nightlife |
Understanding Airbnb License Requirements & STR Laws in Susa (2025)
Yes, Susa, Piedmont, Italy enforces high STR regulations. Obtaining a license and ensuring compliance is almost certainly required according to current 2025 STR laws. Always verify the latest short term rental regulations and Airbnb license requirements directly with local government authorities for Susa to ensure full compliance before hosting.
(Source: AirROI data, 2025, based on 61% licensed listings)
Top Performing Airbnb Properties in Susa (2025)
Benchmark your potential! Explore examples of top-performing Airbnb properties in Susabased on Trailing Twelve Month (TTM) revenue. Analyze their characteristics, revenue, occupancy rate, and ADR to understand what drives success in this market.
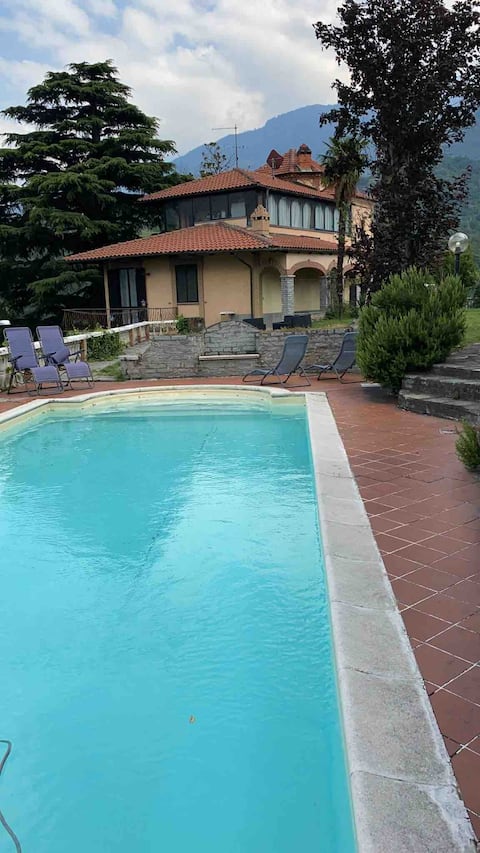
Villa belvedere
Private Room • 3 bedrooms
San Marco Condominium
Entire Place • 2 bedrooms
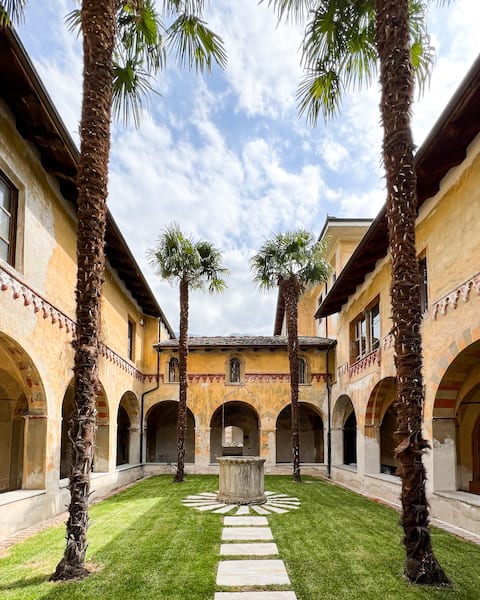
Room in Convento Boutique Hotel
Private Room • 1 bedroom
Call Ratin
Entire Place • 1 bedroom
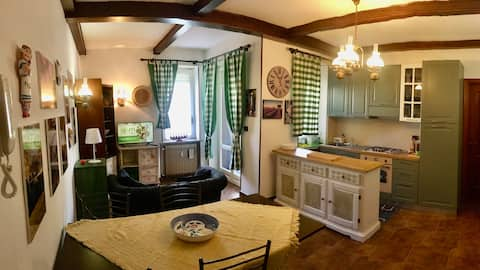
Apartment in the historic center
Entire Place • 1 bedroom
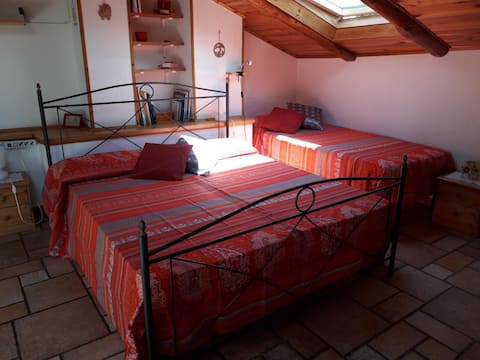
Room in Susa with private bathroom and kitchenette
Private Room • N/A
Note: Performance varies based on location, size, amenities, seasonality, and management quality. Data reflects the past 12 months.
Top Performing Airbnb Hosts in Susa (2025)
Learn from the best! This table showcases top-performing Airbnb hosts in Susa based on the number of properties managed and estimated total revenue over the past year. Analyze their scale and performance metrics.
| Host Name | Properties | Grossing Revenue | Stay Reviews | Avg Rating |
|---|---|---|---|---|
| Luca | 1 | $32,078 | 40 | 4.68/5.0 |
| Emanuela | 1 | $17,782 | 8 | 5.00/5.0 |
| Flavio | 6 | $15,867 | 61 | 4.79/5.0 |
| Gabriele | 1 | $14,443 | 16 | 4.81/5.0 |
| Doriana | 1 | $13,792 | 411 | 4.92/5.0 |
| Massimo | 1 | $13,197 | 16 | 4.81/5.0 |
| Silvia | 1 | $13,115 | 147 | 4.95/5.0 |
| Marianne | 2 | $12,885 | 5 | 5.00/5.0 |
| Isabella | 1 | $12,530 | 110 | 4.83/5.0 |
| Lorena | 1 | $7,688 | 12 | 4.83/5.0 |
Analyzing the strategies of top hosts, such as their property selection, pricing, and guest communication, can offer valuable lessons for optimizing your own Airbnb operations in Susa.
Dive Deeper: Advanced Susa STR Market Data (2025)
Ready to unlock more insights? AirROI provides access to advanced metrics and comprehensive Airbnb data for Susa. Explore detailed analytics beyond this report to refine your investment strategy, optimize pricing, and maximize your vacation rental profits.
Explore Advanced MetricsSusa Short-Term Rental Market Composition (2025): Property & Room Types
Room Type Distribution
Property Type Distribution
Market Composition Insights for Susa
- The Susa Airbnb market composition is heavily skewed towards Entire Home/Apt listings, which make up 72.2% of the 18 active rentals. This indicates strong guest preference for privacy and space.
- Looking at the property type distribution in Susa, Apartment/Condo properties are the most common (83.3%), reflecting the local real estate landscape.
- The presence of 5.6% Hotel/Boutique listings indicates integration with traditional hospitality.
Susa Airbnb Room Capacity Analysis (2025): Bedroom Distribution
Distribution of Listings by Number of Bedrooms
Room Capacity Insights for Susa
- The dominant room capacity in Susa is 1 bedroom listings, making up 44.4% of the market. This suggests a strong demand for properties suitable for couples or solo travelers.
- Together, 1 bedroom and 2 bedrooms properties represent 66.6% of the active Airbnb listings in Susa, indicating a high concentration in these sizes.
Susa Vacation Rental Guest Capacity Trends (2025)
Distribution of Listings by Guest Capacity
Guest Capacity Insights for Susa
- The most common guest capacity trend in Susa vacation rentals is listings accommodating 2 guests (22.2%). This suggests the primary traveler segment is likely couples or solo travelers.
- Properties designed for 2 guests and 4 guests dominate the Susa STR market, accounting for 44.4% of listings.
- 27.8% of properties accommodate 6+ guests, serving the market segment for larger families or group travel in Susa.
- On average, properties in Susa are equipped to host 3.4 guests.
Susa Airbnb Booking Patterns (2025): Available vs. Booked Days
Available Days Distribution
Booked Days Distribution
Booking Pattern Insights for Susa
- The most common availability pattern in Susa falls within the 271-366 days range, representing 61.1% of listings. This suggests many properties have significant open periods on their calendars.
- Approximately 88.9% of listings show high availability (181+ days open annually), indicating potential for increased bookings or specific owner usage patterns.
- For booked days, the 31-90 days range is most frequent in Susa (33.3%), reflecting common guest stay durations or potential owner blocking patterns.
- A notable 11.1% of properties secure long booking periods (181+ days booked per year), highlighting successful long-term rental strategies or significant owner usage.
Susa Airbnb Minimum Stay Requirements Analysis
Distribution of Listings by Minimum Night Requirement
1 Night
8 listings
44.4% of total
2 Nights
1 listings
5.6% of total
3 Nights
1 listings
5.6% of total
4-6 Nights
2 listings
11.1% of total
7-29 Nights
1 listings
5.6% of total
30+ Nights
5 listings
27.8% of total
Key Insights
- The most prevalent minimum stay requirement in Susa is 1 Night, adopted by 44.4% of listings. This highlights the market's preference for shorter, flexible bookings.
- A significant segment (27.8%) caters to monthly stays (30+ nights) in Susa, pointing to opportunities in the extended-stay market.
Recommendations
- Align with the market by considering a 1 Night minimum stay, as 44.4% of Susa hosts use this setting.
- Explore offering discounts for stays of 30+ nights to attract the 27.8% of the market seeking extended stays.
- Adjust minimum nights based on seasonality – potentially shorter during low season and longer during peak demand periods in Susa.
Susa Airbnb Cancellation Policy Trends Analysis (2025)
Flexible
6 listings
33.3% of total
Moderate
5 listings
27.8% of total
Firm
1 listings
5.6% of total
Strict
6 listings
33.3% of total
Cancellation Policy Insights for Susa
- The prevailing Airbnb cancellation policy trend in Susa is Flexible, used by 33.3% of listings.
- There's a relatively balanced mix between guest-friendly (61.1%) and stricter (38.9%) policies, offering choices for different guest needs.
Recommendations for Hosts
- Consider adopting a Flexible policy to align with the 33.3% market standard in Susa.
- With 33.3% using Strict terms, this is a viable option in Susa, particularly for high-value properties or during peak demand periods.
- Regularly review your cancellation policy against competitors and market demand shifts in Susa.
Susa STR Booking Lead Time Analysis (2025)
Average Booking Lead Time by Month
Booking Lead Time Insights for Susa
- The overall average booking lead time for vacation rentals in Susa is 45 days.
- Guests book furthest in advance for stays during November (average 91 days), likely coinciding with peak travel demand or local events.
- The shortest booking windows occur for stays in February (average 17 days), indicating more last-minute travel plans during this time.
- Seasonally, Summer (57 days avg.) sees the longest lead times, while Winter (34 days avg.) has the shortest, reflecting typical travel planning cycles.
Recommendations for Hosts
- Use the overall average lead time (45 days) as a baseline for your pricing and availability strategy in Susa.
- For November stays, consider implementing length-of-stay discounts or slightly higher rates for bookings made less than 91 days out to capitalize on advance planning.
- Target marketing efforts for the Summer season well in advance (at least 57 days) to capture early planners.
- Monitor your own booking lead times against these Susa averages to identify opportunities for dynamic pricing adjustments.
Popular & Essential Airbnb Amenities in Susa (2025)
Amenity Prevalence
Amenity Insights for Susa
- Essential amenities in Susa that guests expect include: Heating, TV, Hair dryer, Hot water, Refrigerator, Bed linens. Lacking these (any) could significantly impact bookings.
- Popular amenities like Extra pillows and blankets, Body soap, Hangers are common but not universal. Offering these can provide a competitive edge.
Recommendations for Hosts
- Ensure your listing includes all essential amenities for Susa: Heating, TV, Hair dryer, Hot water, Refrigerator, Bed linens.
- Consider adding popular differentiators like Extra pillows and blankets or Body soap to increase appeal.
- Highlight unique or less common amenities you offer (e.g., hot tub, dedicated workspace, EV charger) in your listing description and photos.
- Regularly check competitor amenities in Susa to stay competitive.
Susa Airbnb Guest Demographics & Profile Analysis (2025)
Guest Profile Summary for Susa
- The typical guest profile for Airbnb in Susa consists of predominantly international visitors (76%), with top international origins including Italy, typically belonging to the Post-2000s (Gen Z/Alpha) group (50%), primarily speaking English or French.
- Domestic travelers account for 24.3% of guests.
- Key international markets include France (28.4%) and Italy (24.3%).
- Top languages spoken are English (35.8%) followed by French (18.5%).
- A significant demographic segment is the Post-2000s (Gen Z/Alpha) group, representing 50% of guests.
Recommendations for Hosts
- Focus marketing internationally, particularly towards travelers from Italy.
- Tailor amenities and listing descriptions to appeal to the dominant Post-2000s (Gen Z/Alpha) demographic (e.g., highlight fast WiFi, smart home features, local guides).
- Highlight unique local experiences or amenities relevant to the primary guest profile.
- Consider seasonal promotions aligned with peak travel times for key origin markets.
Nearby Short-Term Rental Market Comparison
How does the Susa Airbnb market stack up against its neighbors? Compare key performance metrics like average monthly revenue, ADR, and occupancy rates in surrounding areas to understand the broader regional STR landscape.
| Market | Active Properties | Monthly Revenue | Daily Rate | Avg. Occupancy |
|---|---|---|---|---|
| Lauterbrunnen | 553 | $6,218 | $503.89 | 52% |
| Les Clefs | 34 | $5,901 | $324.30 | 49% |
| Ranco | 12 | $5,783 | $521.03 | 37% |
| Matten bei Interlaken | 63 | $5,772 | $343.53 | 61% |
| Brienzwiler | 11 | $5,715 | $547.95 | 61% |
| Grindelwald | 509 | $5,671 | $398.51 | 56% |
| La Rivière-Enverse | 17 | $5,549 | $692.69 | 38% |
| Monteu Roero | 12 | $5,441 | $416.40 | 42% |
| Niederried bei Interlaken | 18 | $5,377 | $515.47 | 41% |
| Zermatt | 780 | $5,345 | $498.13 | 48% |