Cannobio Airbnb Market Analysis 2026: Short Term Rental Data & Vacation Rental Statistics in Piedmont, Italy
Is Airbnb profitable in Cannobio in 2026? Explore comprehensive Airbnb analytics for Cannobio, Piedmont, Italy to uncover income potential. This 2026 STR market report for Cannobio, based on AirROI data from February 2025 to January 2026, reveals key trends in the niche market of 112 active listings.
Whether you're considering an Airbnb investment in Cannobio, optimizing your existing vacation rental, or exploring rental arbitrage opportunities, understanding the Cannobio Airbnb data is crucial. Navigating the high regulation landscape is key to maximizing your short term rental income potential. Let's dive into the specifics.
Key Cannobio Airbnb Performance Metrics Overview
Monthly Airbnb Revenue Variations & Income Potential in Cannobio (2026)
Understanding the monthly revenue variations for Airbnb listings in Cannobio is key to maximizing your short term rental income potential. Seasonality significantly impacts earnings. Our analysis, based on data from the past 12 months, shows that the peak revenue month for STRs in Cannobio is typically August, while January often presents the lowest earnings, highlighting opportunities for strategic pricing adjustments during shoulder and low seasons. Explore the typical Airbnb income in Cannobio across different performance tiers:
- Best-in-class properties (Top 10%) achieve $3,473+ monthly, often utilizing dynamic pricing and superior guest experiences.
- Strong performing properties (Top 25%) earn $2,457 or more, indicating effective management and desirable locations/amenities.
- Typical properties (Median) generate around $1,654 per month, representing the average market performance.
- Entry-level properties (Bottom 25%) see earnings around $1,068, often with potential for optimization.
Average Monthly Airbnb Earnings Trend in Cannobio
Cannobio Airbnb Occupancy Rate Trends (2026)
Maximize your bookings by understanding the Cannobio STR occupancy trends. Seasonal demand shifts significantly influence how often properties are booked. Typically, Augustsees the highest demand (peak season occupancy), while January experiences the lowest (low season). Effective strategies, like adjusting minimum stays or offering promotions, can boost occupancy during slower periods. Here's how different property tiers perform in Cannobio:
- Best-in-class properties (Top 10%) achieve 69%+ occupancy, indicating high desirability and potentially optimized availability.
- Strong performing properties (Top 25%) maintain 55% or higher occupancy, suggesting good market fit and guest satisfaction.
- Typical properties (Median) have an occupancy rate around 37%.
- Entry-level properties (Bottom 25%) average 24% occupancy, potentially facing higher vacancy.
Average Monthly Occupancy Rate Trend in Cannobio
Average Daily Rate (ADR) Airbnb Trends in Cannobio (2026)
Effective short term rental pricing strategy in Cannobio involves understanding monthly ADR fluctuations. The Average Daily Rate (ADR) for Airbnb in Cannobio typically peaks in August and dips lowest during February. Leveraging Airbnb dynamic pricing tools or strategies based on this seasonality can significantly boost revenue. Here's a look at the typical nightly rates achieved:
- Best-in-class properties (Top 10%) command rates of $207+ per night, often due to premium features or locations.
- Strong performing properties (Top 25%) achieve nightly rates of $169 or more.
- Typical properties (Median) charge around $137 per night.
- Entry-level properties (Bottom 25%) earn around $113 per night.
Average Daily Rate (ADR) Trend by Month in Cannobio
Get Live Cannobio Market Intelligence 👇

Explore Real-time Analytics
Airbnb Seasonality Analysis & Trends in Cannobio (2026)
Peak Season (August, July, June)
- Revenue averages $3,461 per month
- Occupancy rates average 66.3%
- Daily rates average $158
Shoulder Season
- Revenue averages $1,799 per month
- Occupancy maintains around 37.9%
- Daily rates hold near $147
Low Season (January, February, December)
- Revenue drops to average $922 per month
- Occupancy decreases to average 17.0%
- Daily rates adjust to average $150
Seasonality Insights for Cannobio
- The Airbnb seasonality in Cannobio shows highly seasonal trends requiring careful strategy. While the sections above show seasonal averages, it's also insightful to look at the extremes:
- During the high season, the absolute peak month showcases Cannobio's highest earning potential, with monthly revenues capable of climbing to $4,002, occupancy reaching a high of 74.8%, and ADRs peaking at $159.
- Conversely, the slowest single month of the year, typically falling within the low season, marks the market's lowest point. In this month, revenue might dip to $654, occupancy could drop to 12.6%, and ADRs may adjust down to $140.
- Understanding both the seasonal averages and these monthly peaks and troughs in revenue, occupancy, and ADR is crucial for maximizing your Airbnb profit potential in Cannobio.
Seasonal Strategies for Maximizing Profit
- Peak Season: Maximize revenue through premium pricing and potentially longer minimum stays. Ensure high availability.
- Low Season: Offer competitive pricing, special promotions (e.g., extended stay discounts), and flexible cancellation policies. Target off-season travelers like remote workers or budget-conscious guests.
- Shoulder Seasons: Implement dynamic pricing that balances peak and low rates. Target weekend travelers or specific events. Offer slightly more flexible terms than peak season.
- Regularly analyze your own performance against these Cannobio seasonality benchmarks and adjust your pricing and availability strategy accordingly.
Best Areas for Airbnb Investment in Cannobio (2026)
Exploring the top neighborhoods for short-term rentals in Cannobio? This section highlights key areas, outlining why they are attractive for hosts and guests, along with notable local attractions. Consider these locations based on your target guest profile and investment strategy.
| Neighborhood / Area | Why Host Here? (Target Guests & Appeal) | Key Attractions & Landmarks |
|---|---|---|
| Lungolago di Cannobio | The lakeshore area offers stunning views of Lake Maggiore, with a vibrant promenade featuring shops, cafes, and restaurants. It's a prime location for tourists seeking relaxation and water activities. | Lake Maggiore, Cannobio Beach, Historic Town Center, Piazza Vittorio Emanuele III, Walking Trails along the lake |
| Old Town Cannobio | Rich in history and charm, the old town features narrow streets, antique shops, and local eateries. A great choice for visitors interested in culture and local cuisine. | Church of St. Margaret, Cantina di Cannobio, Statue of Saint Charles, Local Art Galleries, Historic Architecture |
| Monte Carza | Renowned for hiking and outdoor activities, Monte Carza offers breathtaking views of the lake and surrounding mountains. Ideal for nature enthusiasts and those looking for adventure. | Hiking Trails, Panoramic Viewpoint, Biking Paths, Nature Parks, Wildlife |
| Piazza della Repubblica | A central hub in Cannobio surrounded by cafes and shops, this square is perfect for socializing and offers a lively atmosphere, especially during local events. | Local Markets, Cafes, Public Events, Art Exhibitions, Cultural Activities |
| Cannobio Market | This area becomes vibrant during market days, attracting both locals and tourists. It's a great spot for those interested in local produce and artisanal goods. | Local Farmers' Produce, Craft Stalls, Street Food, Traditional Handicrafts, Live Music |
| Cappella di San Fedelino | A unique chapel located on an island, accessible by boat. It offers a peaceful retreat and is a popular site for tourists seeking tranquility and spirituality. | Boat Tours, Quiet Nature, Cultural Significance, Photography Spots, Peaceful Atmosphere |
| Val Veddasca | A short drive from Cannobio, this valley offers excellent hiking opportunities and is less touristy, perfect for travelers looking to escape the crowds and enjoy nature. | Scenic Hikes, Natural Reserves, Local Flora and Fauna, Peaceful Villages, Outdoor Sports |
| Cannobio Waterfront Dining | This area features numerous restaurants with lakeside views, making it a culinary hotspot for tourists who enjoy exquisite dining experiences with beautiful scenery. | Fine Dining, Lake Views, Seafood Specialties, Wine Tastings, Outdoor Seating |
Understanding Airbnb License Requirements & STR Laws in Cannobio (2026)
Yes, Cannobio, Piedmont, Italy enforces high STR regulations. Obtaining a license and ensuring compliance is almost certainly required according to current 2026 STR laws. Always verify the latest short term rental regulations and Airbnb license requirements directly with local government authorities for Cannobio to ensure full compliance before hosting.
(Source: AirROI data, 2026, based on 94% licensed listings)
Top Performing Airbnb Properties in Cannobio (2026)
Benchmark your potential! Explore examples of top-performing Airbnb properties in Cannobiobased on Trailing Twelve Month (TTM) revenue. Analyze their characteristics, revenue, occupancy rate, and ADR to understand what drives success in this market.
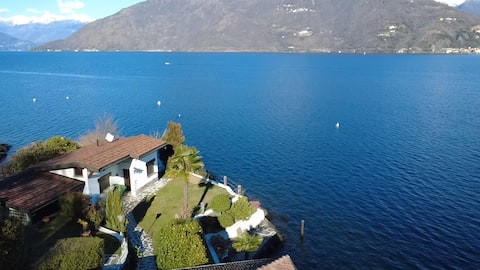
House directly on Lake Maggiore CIR10301700196
Entire Place • 1 bedroom

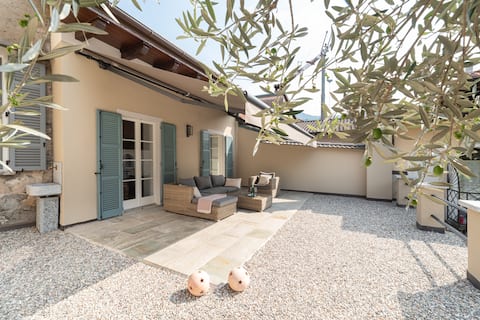
Villa "Casa Camelia" in a dream location
Entire Place • 3 bedrooms
Loft house in the Borgo of Cannobio
Entire Place • 3 bedrooms
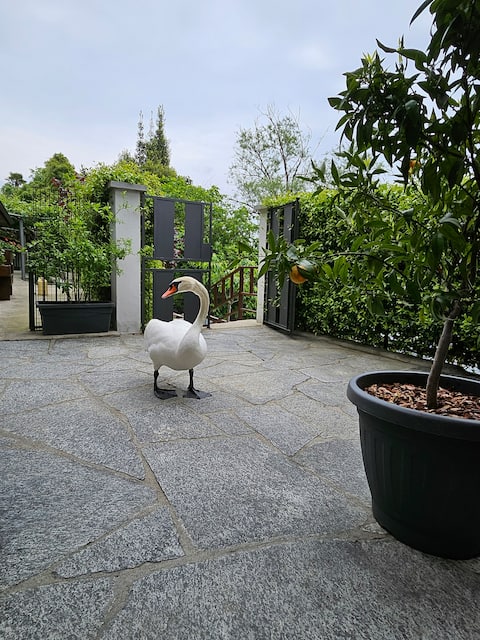
Casa dei Cigni
Entire Place • 2 bedrooms
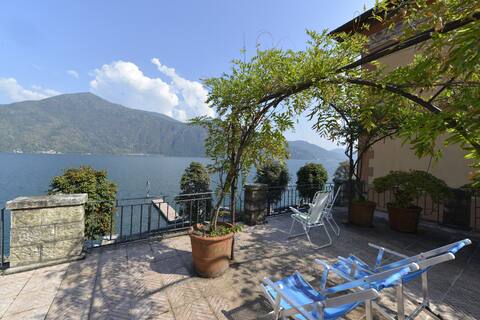
Casa la Terrazza sul Lago-WelcHome
Entire Place • 3 bedrooms
Villa Michelangelo - WelcHome
Entire Place • 3 bedrooms
Note: Performance varies based on location, size, amenities, seasonality, and management quality. Data reflects the past 12 months.
Top Performing Airbnb Hosts in Cannobio (2026)
Learn from the best! This table showcases top-performing Airbnb hosts in Cannobio based on the number of properties managed and estimated total revenue over the past year. Analyze their scale and performance metrics.
| Host Name | Properties | Grossing Revenue | Stay Reviews | Avg Rating |
|---|---|---|---|---|
| WelcHome | 24 | $445,492 | 558 | 4.57/5.0 |
| Giulia Di Maggiore Estate By G | 7 | $138,172 | 39 | 4.64/5.0 |
| Ilario | 3 | $96,692 | 116 | 4.83/5.0 |
| Laura | 4 | $82,567 | 109 | 4.79/5.0 |
| Kalle | 1 | $58,458 | 16 | 4.81/5.0 |
| Anna | 1 | $56,017 | 47 | 4.77/5.0 |
| Fabrizio | 1 | $55,641 | 125 | 4.99/5.0 |
| Sandra | 5 | $53,391 | 106 | 4.41/5.0 |
| Carla | 4 | $50,593 | 963 | 4.88/5.0 |
| Barbara | 2 | $48,891 | 316 | 4.89/5.0 |
Analyzing the strategies of top hosts, such as their property selection, pricing, and guest communication, can offer valuable lessons for optimizing your own Airbnb operations in Cannobio.
Dive Deeper: Advanced Cannobio STR Market Data (2026)
Ready to unlock more insights? AirROI provides access to advanced metrics and comprehensive Airbnb data for Cannobio. Explore detailed analytics beyond this report to refine your investment strategy, optimize pricing, and maximize your vacation rental profits.
Explore Advanced MetricsCannobio Short-Term Rental Market Composition (2026): Property & Room Types
Room Type Distribution
Property Type Distribution
Market Composition Insights for Cannobio
- The Cannobio Airbnb market composition is heavily skewed towards Entire Home/Apt listings, which make up 96.4% of the 112 active rentals. This indicates strong guest preference for privacy and space.
- Looking at the property type distribution in Cannobio, Apartment/Condo properties are the most common (72.3%), reflecting the local real estate landscape.
- Houses represent a significant 26.8% portion, catering likely to families or larger groups.
- Smaller segments like hotel/boutique (combined 0.9%) offer potential for unique stay experiences.
Cannobio Airbnb Room Capacity Analysis (2026): Bedroom Distribution
Distribution of Listings by Number of Bedrooms
Room Capacity Insights for Cannobio
- The dominant room capacity in Cannobio is 1 bedroom listings, making up 46.4% of the market. This suggests a strong demand for properties suitable for couples or solo travelers.
- Together, 1 bedroom and 2 bedrooms properties represent 86.6% of the active Airbnb listings in Cannobio, indicating a high concentration in these sizes.
- Listings with 3+ bedrooms (7.2%) represent a smaller niche, potentially indicating an underserved market for larger group accommodations in Cannobio.
Cannobio Vacation Rental Guest Capacity Trends (2026)
Distribution of Listings by Guest Capacity
Guest Capacity Insights for Cannobio
- The most common guest capacity trend in Cannobio vacation rentals is listings accommodating 4 guests (45.5%). This suggests the primary traveler segment is likely small families or groups.
- Properties designed for 4 guests and 2 guests dominate the Cannobio STR market, accounting for 74.1% of listings.
- 12.5% of properties accommodate 6+ guests, serving the market segment for larger families or group travel in Cannobio.
- On average, properties in Cannobio are equipped to host 3.7 guests.
Cannobio Airbnb Booking Patterns (2026): Available vs. Booked Days
Available Days Distribution
Booked Days Distribution
Booking Pattern Insights for Cannobio
- The most common availability pattern in Cannobio falls within the 181-270 days range, representing 47.3% of listings. This suggests many properties have significant open periods on their calendars.
- Approximately 91.1% of listings show high availability (181+ days open annually), indicating potential for increased bookings or specific owner usage patterns.
- For booked days, the 91-180 days range is most frequent in Cannobio (49.1%), reflecting common guest stay durations or potential owner blocking patterns.
- A notable 11.6% of properties secure long booking periods (181+ days booked per year), highlighting successful long-term rental strategies or significant owner usage.
Cannobio Airbnb Minimum Stay Requirements Analysis
Distribution of Listings by Minimum Night Requirement
1 Night
3 listings
2.7% of total
2 Nights
14 listings
12.5% of total
3 Nights
20 listings
17.9% of total
4-6 Nights
18 listings
16.1% of total
7-29 Nights
2 listings
1.8% of total
30+ Nights
55 listings
49.1% of total
Key Insights
- The most prevalent minimum stay requirement in Cannobio is 30+ Nights, adopted by 49.1% of listings. This highlights the market's preference for longer commitments.
- Very short stays (1-2 nights) are less common (15.2%), suggesting hosts prefer slightly longer bookings to optimize turnover.
- A significant segment (49.1%) caters to monthly stays (30+ nights) in Cannobio, pointing to opportunities in the extended-stay market.
Recommendations
- Align with the market by considering a 30+ Nights minimum stay, as 49.1% of Cannobio hosts use this setting.
- If feasible, allowing 1-night stays, especially midweek or during low season, could capture last-minute bookings, as only 2.7% currently do.
- Explore offering discounts for stays of 30+ nights to attract the 49.1% of the market seeking extended stays.
- Adjust minimum nights based on seasonality – potentially shorter during low season and longer during peak demand periods in Cannobio.
Cannobio Airbnb Cancellation Policy Trends Analysis (2026)
Super Strict 30 Days
3 listings
2.7% of total
Limited
3 listings
2.7% of total
Flexible
29 listings
25.9% of total
Moderate
38 listings
33.9% of total
Firm
34 listings
30.4% of total
Strict
5 listings
4.5% of total
Cancellation Policy Insights for Cannobio
- The prevailing Airbnb cancellation policy trend in Cannobio is Moderate, used by 33.9% of listings.
- There's a relatively balanced mix between guest-friendly (59.8%) and stricter (34.9%) policies, offering choices for different guest needs.
- Strict cancellation policies are quite rare (4.5%), potentially making listings with this policy less competitive unless justified by high demand or property type.
Recommendations for Hosts
- Consider adopting a Moderate policy to align with the 33.9% market standard in Cannobio.
- Using a Strict policy might deter some guests, as only 4.5% of listings use it. Evaluate if potential revenue protection outweighs possible lower booking rates.
- Regularly review your cancellation policy against competitors and market demand shifts in Cannobio.
Cannobio STR Booking Lead Time Analysis (2026)
Average Booking Lead Time by Month
Booking Lead Time Insights for Cannobio
- The overall average booking lead time for vacation rentals in Cannobio is 67 days.
- Guests book furthest in advance for stays during August (average 99 days), likely coinciding with peak travel demand or local events.
- The shortest booking windows occur for stays in January (average 22 days), indicating more last-minute travel plans during this time.
- Seasonally, Summer (89 days avg.) sees the longest lead times, while Winter (27 days avg.) has the shortest, reflecting typical travel planning cycles.
Recommendations for Hosts
- Use the overall average lead time (67 days) as a baseline for your pricing and availability strategy in Cannobio.
- For August stays, consider implementing length-of-stay discounts or slightly higher rates for bookings made less than 99 days out to capitalize on advance planning.
- Target marketing efforts for the Summer season well in advance (at least 89 days) to capture early planners.
- Monitor your own booking lead times against these Cannobio averages to identify opportunities for dynamic pricing adjustments.
Popular & Essential Airbnb Amenities in Cannobio (2026)
Amenity Prevalence
Amenity Insights for Cannobio
- Popular amenities like Kitchen, Wifi, TV are common but not universal. Offering these can provide a competitive edge.
- Warning: Wifi is not universally provided but is considered essential globally. Ensure reliable Wifi is offered.
Recommendations for Hosts
- Consider adding popular differentiators like Kitchen or Wifi to increase appeal.
- Highlight unique or less common amenities you offer (e.g., hot tub, dedicated workspace, EV charger) in your listing description and photos.
- Regularly check competitor amenities in Cannobio to stay competitive.
Cannobio Airbnb Guest Demographics & Profile Analysis (2026)
Guest Profile Summary for Cannobio
- The typical guest profile for Airbnb in Cannobio consists of predominantly international visitors (98%), with top international origins including Switzerland, typically belonging to the Post-2000s (Gen Z/Alpha) group (50%), primarily speaking English or German.
- Domestic travelers account for 1.7% of guests.
- Key international markets include Germany (48.7%) and Switzerland (20.3%).
- Top languages spoken are English (37.7%) followed by German (31.3%).
- A significant demographic segment is the Post-2000s (Gen Z/Alpha) group, representing 50% of guests.
Recommendations for Hosts
- Focus marketing internationally, particularly towards travelers from Switzerland.
- Tailor amenities and listing descriptions to appeal to the dominant Post-2000s (Gen Z/Alpha) demographic (e.g., highlight fast WiFi, smart home features, local guides).
- Highlight unique local experiences or amenities relevant to the primary guest profile.
- Consider seasonal promotions aligned with peak travel times for key origin markets.
Nearby Short-Term Rental Market Comparison
How does the Cannobio Airbnb market stack up against its neighbors? Compare key performance metrics like average monthly revenue, ADR, and occupancy rates in surrounding areas to understand the broader regional STR landscape.
| Market | Active Properties | Monthly Revenue | Daily Rate | Avg. Occupancy |
|---|---|---|---|---|
| Brienzwiler | 11 | $7,335 | $514.27 | 60% |
| Niederried bei Interlaken | 19 | $6,267 | $552.03 | 44% |
| Lauterbrunnen | 552 | $6,108 | $487.83 | 51% |
| Ranco | 12 | $5,691 | $536.46 | 42% |
| Matten bei Interlaken | 64 | $5,607 | $336.51 | 59% |
| Grindelwald | 513 | $5,587 | $396.62 | 56% |
| Bassersdorf | 16 | $5,337 | $431.59 | 46% |
| Wengen | 12 | $5,115 | $595.38 | 46% |
| Oberhofen am Thunersee | 25 | $5,051 | $329.28 | 51% |
| Zermatt | 792 | $5,017 | $504.14 | 46% |