Asti Airbnb Market Analysis 2026: Short Term Rental Data & Vacation Rental Statistics in Piedmont, Italy
Is Airbnb profitable in Asti in 2026? Explore comprehensive Airbnb analytics for Asti, Piedmont, Italy to uncover income potential. This 2026 STR market report for Asti, based on AirROI data from February 2025 to January 2026, reveals key trends in the market of 211 active listings.
Whether you're considering an Airbnb investment in Asti, optimizing your existing vacation rental, or exploring rental arbitrage opportunities, understanding the Asti Airbnb data is crucial. Navigating the high regulation landscape is key to maximizing your short term rental income potential. Let's dive into the specifics.
Key Asti Airbnb Performance Metrics Overview
Monthly Airbnb Revenue Variations & Income Potential in Asti (2026)
Understanding the monthly revenue variations for Airbnb listings in Asti is key to maximizing your short term rental income potential. Seasonality significantly impacts earnings. Our analysis, based on data from the past 12 months, shows that the peak revenue month for STRs in Asti is typically August, while February often presents the lowest earnings, highlighting opportunities for strategic pricing adjustments during shoulder and low seasons. Explore the typical Airbnb income in Asti across different performance tiers:
- Best-in-class properties (Top 10%) achieve $2,441+ monthly, often utilizing dynamic pricing and superior guest experiences.
- Strong performing properties (Top 25%) earn $1,603 or more, indicating effective management and desirable locations/amenities.
- Typical properties (Median) generate around $915 per month, representing the average market performance.
- Entry-level properties (Bottom 25%) see earnings around $433, often with potential for optimization.
Average Monthly Airbnb Earnings Trend in Asti
Asti Airbnb Occupancy Rate Trends (2026)
Maximize your bookings by understanding the Asti STR occupancy trends. Seasonal demand shifts significantly influence how often properties are booked. Typically, Augustsees the highest demand (peak season occupancy), while January experiences the lowest (low season). Effective strategies, like adjusting minimum stays or offering promotions, can boost occupancy during slower periods. Here's how different property tiers perform in Asti:
- Best-in-class properties (Top 10%) achieve 72%+ occupancy, indicating high desirability and potentially optimized availability.
- Strong performing properties (Top 25%) maintain 51% or higher occupancy, suggesting good market fit and guest satisfaction.
- Typical properties (Median) have an occupancy rate around 29%.
- Entry-level properties (Bottom 25%) average 14% occupancy, potentially facing higher vacancy.
Average Monthly Occupancy Rate Trend in Asti
Average Daily Rate (ADR) Airbnb Trends in Asti (2026)
Effective short term rental pricing strategy in Asti involves understanding monthly ADR fluctuations. The Average Daily Rate (ADR) for Airbnb in Asti typically peaks in September and dips lowest during February. Leveraging Airbnb dynamic pricing tools or strategies based on this seasonality can significantly boost revenue. Here's a look at the typical nightly rates achieved:
- Best-in-class properties (Top 10%) command rates of $186+ per night, often due to premium features or locations.
- Strong performing properties (Top 25%) achieve nightly rates of $125 or more.
- Typical properties (Median) charge around $95 per night.
- Entry-level properties (Bottom 25%) earn around $74 per night.
Average Daily Rate (ADR) Trend by Month in Asti
Get Live Asti Market Intelligence 👇

Explore Real-time Analytics
Airbnb Seasonality Analysis & Trends in Asti (2026)
Peak Season (August, July, September)
- Revenue averages $1,927 per month
- Occupancy rates average 39.4%
- Daily rates average $133
Shoulder Season
- Revenue averages $1,322 per month
- Occupancy maintains around 35.4%
- Daily rates hold near $126
Low Season (January, February, March)
- Revenue drops to average $835 per month
- Occupancy decreases to average 28.9%
- Daily rates adjust to average $117
Seasonality Insights for Asti
- The Airbnb seasonality in Asti shows highly seasonal trends requiring careful strategy. While the sections above show seasonal averages, it's also insightful to look at the extremes:
- During the high season, the absolute peak month showcases Asti's highest earning potential, with monthly revenues capable of climbing to $2,166, occupancy reaching a high of 43.3%, and ADRs peaking at $135.
- Conversely, the slowest single month of the year, typically falling within the low season, marks the market's lowest point. In this month, revenue might dip to $690, occupancy could drop to 22.7%, and ADRs may adjust down to $112.
- Understanding both the seasonal averages and these monthly peaks and troughs in revenue, occupancy, and ADR is crucial for maximizing your Airbnb profit potential in Asti.
Seasonal Strategies for Maximizing Profit
- Peak Season: Maximize revenue through premium pricing and potentially longer minimum stays. Ensure high availability.
- Low Season: Offer competitive pricing, special promotions (e.g., extended stay discounts), and flexible cancellation policies. Target off-season travelers like remote workers or budget-conscious guests.
- Shoulder Seasons: Implement dynamic pricing that balances peak and low rates. Target weekend travelers or specific events. Offer slightly more flexible terms than peak season.
- Regularly analyze your own performance against these Asti seasonality benchmarks and adjust your pricing and availability strategy accordingly.
Best Areas for Airbnb Investment in Asti (2026)
Exploring the top neighborhoods for short-term rentals in Asti? This section highlights key areas, outlining why they are attractive for hosts and guests, along with notable local attractions. Consider these locations based on your target guest profile and investment strategy.
| Neighborhood / Area | Why Host Here? (Target Guests & Appeal) | Key Attractions & Landmarks |
|---|---|---|
| Asti City Center | The heart of Asti, rich in history and culture, ideal for tourists who want to explore local attractions and enjoy traditional Italian cuisine. | Cathedral of Asti, Palazzo Alfieri, Piazza San Secondo, Museo Alfieriano, Teatro Sociale, Asti Wine Museum |
| Monferrato Region | A UNESCO World Heritage site known for its rolling hills, vineyards, and charming villages. Perfect for guests interested in wine tourism and scenic nature. | Vineyard tours, Truffle hunting, Castles of Monferrato, Local wineries, Agliano Terme, The hills of Monferrato |
| San Damiano d'Asti | A quaint and quiet town, ideal for visitors looking for a peaceful stay and to explore the countryside while being close to Asti. | Historic center, Wine tasting tours, Local gastronomic experiences, San Damiano Castle, Parco della Rimembranza |
| Asti's Wine Regions | Regions surrounding Asti known for producing some of Italy's finest wines, attracting wine lovers and connoisseurs all year round. | Barbera d'Asti wineries, Moscato d'Asti vineyards, Wine festivals, Vineyard cycling tours, Cascina Boccaccio |
| Castagnole delle Lanze | A picturesque village within wine country, known for its local festivals and vibrant culture, great for tourists seeking an authentic local experience. | Annual Lemon Festival, Traditional cuisine, Wine tasting, Panoramic views, Local market |
| Serralunga d'Alba | Located in the Langhe hills, offering stunning landscapes and access to high-quality wine tastings. Great for luxury stays and gourmet experiences. | Truffle fairs, Wine cellars, Scenic viewpoints, Historical castles, Local vineyards |
| Cortazzone | A small, serene town surrounded by nature, perfect for those wanting a relaxing stay while still being close to Asti's attractions. | Walking trails, Local farms, Tranquil parks, Familial activities |
| Vigliano d'Asti | A small suburban area with a community feel, ideal for families and travelers seeking a peaceful getaway while remaining close to city amenities. | Local restaurants, Community events, Parks and playgrounds, Family-friendly activities |
Understanding Airbnb License Requirements & STR Laws in Asti (2026)
Yes, Asti, Piedmont, Italy enforces high STR regulations. Obtaining a license and ensuring compliance is almost certainly required according to current 2026 STR laws. Always verify the latest short term rental regulations and Airbnb license requirements directly with local government authorities for Asti to ensure full compliance before hosting.
(Source: AirROI data, 2026, based on 89% licensed listings)
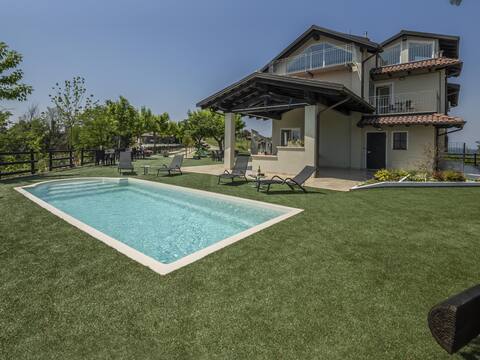
Top Performing Airbnb Properties in Asti (2026)
Benchmark your potential! Explore examples of top-performing Airbnb properties in Astibased on Trailing Twelve Month (TTM) revenue. Analyze their characteristics, revenue, occupancy rate, and ADR to understand what drives success in this market.

Villa Rosa | Estate
Entire Place • 7 bedrooms

Casa Rita, Charming House with pool, Asti
Entire Place • 6 bedrooms
Casa del Rosmarino, with pool
Entire Place • 4 bedrooms

Luxury Villa - UNESCO Monferrato Langhe pool
Entire Place • 6 bedrooms

Beppe Country House by Interhome
Entire Place • 4 bedrooms

Villa Omede'
Entire Place • 4 bedrooms
Note: Performance varies based on location, size, amenities, seasonality, and management quality. Data reflects the past 12 months.
Top Performing Airbnb Hosts in Asti (2026)
Learn from the best! This table showcases top-performing Airbnb hosts in Asti based on the number of properties managed and estimated total revenue over the past year. Analyze their scale and performance metrics.
| Host Name | Properties | Grossing Revenue | Stay Reviews | Avg Rating |
|---|---|---|---|---|
| Ilaria | 1 | $129,711 | 14 | 4.93/5.0 |
| Ilaria | 1 | $129,242 | 15 | 5.00/5.0 |
| Mattia | 3 | $121,294 | 207 | 4.91/5.0 |
| Marion- Interhome | 5 | $107,783 | 65 | 4.77/5.0 |
| Silvia | 4 | $99,769 | 107 | 4.93/5.0 |
| Alessandro | 6 | $83,034 | 141 | 4.95/5.0 |
| Fabrizio | 1 | $72,103 | 14 | 5.00/5.0 |
| Ilenia | 11 | $71,350 | 113 | 4.93/5.0 |
| Marcello | 3 | $69,032 | 127 | 4.86/5.0 |
| Maison Metropole | 5 | $67,467 | 52 | 4.54/5.0 |
Analyzing the strategies of top hosts, such as their property selection, pricing, and guest communication, can offer valuable lessons for optimizing your own Airbnb operations in Asti.
Dive Deeper: Advanced Asti STR Market Data (2026)
Ready to unlock more insights? AirROI provides access to advanced metrics and comprehensive Airbnb data for Asti. Explore detailed analytics beyond this report to refine your investment strategy, optimize pricing, and maximize your vacation rental profits.
Explore Advanced MetricsAsti Short-Term Rental Market Composition (2026): Property & Room Types
Room Type Distribution
Property Type Distribution
Market Composition Insights for Asti
- The Asti Airbnb market composition is heavily skewed towards Entire Home/Apt listings, which make up 91% of the 211 active rentals. This indicates strong guest preference for privacy and space.
- Looking at the property type distribution in Asti, Apartment/Condo properties are the most common (70.6%), reflecting the local real estate landscape.
- Houses represent a significant 23.7% portion, catering likely to families or larger groups.
- Smaller segments like hotel/boutique, outdoor/unique, unique stays (combined 5.7%) offer potential for unique stay experiences.
Asti Airbnb Room Capacity Analysis (2026): Bedroom Distribution
Distribution of Listings by Number of Bedrooms
Room Capacity Insights for Asti
- The dominant room capacity in Asti is 1 bedroom listings, making up 64.9% of the market. This suggests a strong demand for properties suitable for couples or solo travelers.
- Together, 1 bedroom and 2 bedrooms properties represent 81.5% of the active Airbnb listings in Asti, indicating a high concentration in these sizes.
- With over half the market (64.9%) consisting of studios or 1-bedroom units, Asti is particularly well-suited for individuals or couples.
Asti Vacation Rental Guest Capacity Trends (2026)
Distribution of Listings by Guest Capacity
Guest Capacity Insights for Asti
- The most common guest capacity trend in Asti vacation rentals is listings accommodating 4 guests (40.3%). This suggests the primary traveler segment is likely small families or groups.
- Properties designed for 4 guests and 2 guests dominate the Asti STR market, accounting for 62.1% of listings.
- 16.2% of properties accommodate 6+ guests, serving the market segment for larger families or group travel in Asti.
- On average, properties in Asti are equipped to host 3.7 guests.
Asti Airbnb Booking Patterns (2026): Available vs. Booked Days
Available Days Distribution
Booked Days Distribution
Booking Pattern Insights for Asti
- The most common availability pattern in Asti falls within the 271-366 days range, representing 63% of listings. This suggests many properties have significant open periods on their calendars.
- Approximately 86.7% of listings show high availability (181+ days open annually), indicating potential for increased bookings or specific owner usage patterns.
- For booked days, the 31-90 days range is most frequent in Asti (35.1%), reflecting common guest stay durations or potential owner blocking patterns.
- A notable 14.6% of properties secure long booking periods (181+ days booked per year), highlighting successful long-term rental strategies or significant owner usage.
Asti Airbnb Minimum Stay Requirements Analysis
Distribution of Listings by Minimum Night Requirement
1 Night
94 listings
44.5% of total
2 Nights
40 listings
19% of total
3 Nights
3 listings
1.4% of total
4-6 Nights
6 listings
2.8% of total
7-29 Nights
9 listings
4.3% of total
30+ Nights
59 listings
28% of total
Key Insights
- The most prevalent minimum stay requirement in Asti is 1 Night, adopted by 44.5% of listings. This highlights the market's preference for shorter, flexible bookings.
- A strong majority (63.5%) of the Asti Airbnb data shows acceptance of very short stays (1-2 nights), indicating a dynamic, high-turnover market.
- A significant segment (28%) caters to monthly stays (30+ nights) in Asti, pointing to opportunities in the extended-stay market.
Recommendations
- Align with the market by considering a 1 Night minimum stay, as 44.5% of Asti hosts use this setting.
- Explore offering discounts for stays of 30+ nights to attract the 28% of the market seeking extended stays.
- Adjust minimum nights based on seasonality – potentially shorter during low season and longer during peak demand periods in Asti.
Asti Airbnb Cancellation Policy Trends Analysis (2026)
Super Strict 60 Days
2 listings
0.9% of total
Limited
2 listings
0.9% of total
Super Strict 30 Days
1 listings
0.5% of total
Flexible
105 listings
49.8% of total
Moderate
80 listings
37.9% of total
Firm
16 listings
7.6% of total
Strict
5 listings
2.4% of total
Cancellation Policy Insights for Asti
- The prevailing Airbnb cancellation policy trend in Asti is Flexible, used by 49.8% of listings.
- The market strongly favors guest-friendly terms, with 87.7% of listings offering Flexible or Moderate policies. This suggests guests in Asti may expect booking flexibility.
- Strict cancellation policies are quite rare (2.4%), potentially making listings with this policy less competitive unless justified by high demand or property type.
Recommendations for Hosts
- Consider adopting a Flexible policy to align with the 49.8% market standard in Asti.
- Using a Strict policy might deter some guests, as only 2.4% of listings use it. Evaluate if potential revenue protection outweighs possible lower booking rates.
- Regularly review your cancellation policy against competitors and market demand shifts in Asti.
Asti STR Booking Lead Time Analysis (2026)
Average Booking Lead Time by Month
Booking Lead Time Insights for Asti
- The overall average booking lead time for vacation rentals in Asti is 45 days.
- Guests book furthest in advance for stays during September (average 67 days), likely coinciding with peak travel demand or local events.
- The shortest booking windows occur for stays in February (average 18 days), indicating more last-minute travel plans during this time.
- Seasonally, Fall (51 days avg.) sees the longest lead times, while Winter (28 days avg.) has the shortest, reflecting typical travel planning cycles.
Recommendations for Hosts
- Use the overall average lead time (45 days) as a baseline for your pricing and availability strategy in Asti.
- For September stays, consider implementing length-of-stay discounts or slightly higher rates for bookings made less than 67 days out to capitalize on advance planning.
- Target marketing efforts for the Fall season well in advance (at least 51 days) to capture early planners.
- Monitor your own booking lead times against these Asti averages to identify opportunities for dynamic pricing adjustments.
Popular & Essential Airbnb Amenities in Asti (2026)
Amenity Prevalence
Amenity Insights for Asti
- Essential amenities in Asti that guests expect include: Heating. Lacking these (this) could significantly impact bookings.
- Popular amenities like Wifi, TV, Kitchen are common but not universal. Offering these can provide a competitive edge.
- Warning: Wifi is not universally provided but is considered essential globally. Ensure reliable Wifi is offered.
Recommendations for Hosts
- Ensure your listing includes all essential amenities for Asti: Heating.
- Prioritize adding missing essentials: Heating.
- Consider adding popular differentiators like Wifi or TV to increase appeal.
- Highlight unique or less common amenities you offer (e.g., hot tub, dedicated workspace, EV charger) in your listing description and photos.
- Regularly check competitor amenities in Asti to stay competitive.
Asti Airbnb Guest Demographics & Profile Analysis (2026)
Guest Profile Summary for Asti
- The typical guest profile for Airbnb in Asti consists of predominantly international visitors (72%), with top international origins including France, typically belonging to the Post-2000s (Gen Z/Alpha) group (50%), primarily speaking English or French.
- Domestic travelers account for 27.6% of guests.
- Key international markets include Italy (27.6%) and France (25.5%).
- Top languages spoken are English (36.2%) followed by French (18.3%).
- A significant demographic segment is the Post-2000s (Gen Z/Alpha) group, representing 50% of guests.
Recommendations for Hosts
- Focus marketing internationally, particularly towards travelers from France.
- Tailor amenities and listing descriptions to appeal to the dominant Post-2000s (Gen Z/Alpha) demographic (e.g., highlight fast WiFi, smart home features, local guides).
- Highlight unique local experiences or amenities relevant to the primary guest profile.
- Consider seasonal promotions aligned with peak travel times for key origin markets.
Nearby Short-Term Rental Market Comparison
How does the Asti Airbnb market stack up against its neighbors? Compare key performance metrics like average monthly revenue, ADR, and occupancy rates in surrounding areas to understand the broader regional STR landscape.
| Market | Active Properties | Monthly Revenue | Daily Rate | Avg. Occupancy |
|---|---|---|---|---|
| Ranco | 12 | $5,691 | $536.46 | 42% |
| Monteu Roero | 12 | $5,184 | $403.07 | 41% |
| Laglio | 64 | $4,334 | $518.58 | 43% |
| Saint-Jean-Cap-Ferrat | 114 | $3,894 | $465.00 | 44% |
| Cassinasco | 19 | $3,887 | $718.39 | 40% |
| Cossano Belbo | 15 | $3,763 | $326.53 | 36% |
| Portofino | 77 | $3,585 | $509.42 | 38% |
| Bellagio | 461 | $3,466 | $325.87 | 49% |
| Vico Morcote | 12 | $3,347 | $317.07 | 46% |
| Sala Comacina | 73 | $3,332 | $451.20 | 46% |