Urbino Airbnb Market Analysis 2026: Short Term Rental Data & Vacation Rental Statistics in Marche, Italy
Is Airbnb profitable in Urbino in 2026? Explore comprehensive Airbnb analytics for Urbino, Marche, Italy to uncover income potential. This 2026 STR market report for Urbino, based on AirROI data from February 2025 to January 2026, reveals key trends in the niche market of 124 active listings.
Whether you're considering an Airbnb investment in Urbino, optimizing your existing vacation rental, or exploring rental arbitrage opportunities, understanding the Urbino Airbnb data is crucial. Navigating the high regulation landscape is key to maximizing your short term rental income potential. Let's dive into the specifics.
Key Urbino Airbnb Performance Metrics Overview
Monthly Airbnb Revenue Variations & Income Potential in Urbino (2026)
Understanding the monthly revenue variations for Airbnb listings in Urbino is key to maximizing your short term rental income potential. Seasonality significantly impacts earnings. Our analysis, based on data from the past 12 months, shows that the peak revenue month for STRs in Urbino is typically August, while January often presents the lowest earnings, highlighting opportunities for strategic pricing adjustments during shoulder and low seasons. Explore the typical Airbnb income in Urbino across different performance tiers:
- Best-in-class properties (Top 10%) achieve $2,449+ monthly, often utilizing dynamic pricing and superior guest experiences.
- Strong performing properties (Top 25%) earn $1,628 or more, indicating effective management and desirable locations/amenities.
- Typical properties (Median) generate around $997 per month, representing the average market performance.
- Entry-level properties (Bottom 25%) see earnings around $487, often with potential for optimization.
Average Monthly Airbnb Earnings Trend in Urbino
Urbino Airbnb Occupancy Rate Trends (2026)
Maximize your bookings by understanding the Urbino STR occupancy trends. Seasonal demand shifts significantly influence how often properties are booked. Typically, Augustsees the highest demand (peak season occupancy), while January experiences the lowest (low season). Effective strategies, like adjusting minimum stays or offering promotions, can boost occupancy during slower periods. Here's how different property tiers perform in Urbino:
- Best-in-class properties (Top 10%) achieve 67%+ occupancy, indicating high desirability and potentially optimized availability.
- Strong performing properties (Top 25%) maintain 49% or higher occupancy, suggesting good market fit and guest satisfaction.
- Typical properties (Median) have an occupancy rate around 30%.
- Entry-level properties (Bottom 25%) average 16% occupancy, potentially facing higher vacancy.
Average Monthly Occupancy Rate Trend in Urbino
Average Daily Rate (ADR) Airbnb Trends in Urbino (2026)
Effective short term rental pricing strategy in Urbino involves understanding monthly ADR fluctuations. The Average Daily Rate (ADR) for Airbnb in Urbino typically peaks in December and dips lowest during March. Leveraging Airbnb dynamic pricing tools or strategies based on this seasonality can significantly boost revenue. Here's a look at the typical nightly rates achieved:
- Best-in-class properties (Top 10%) command rates of $209+ per night, often due to premium features or locations.
- Strong performing properties (Top 25%) achieve nightly rates of $137 or more.
- Typical properties (Median) charge around $96 per night.
- Entry-level properties (Bottom 25%) earn around $73 per night.
Average Daily Rate (ADR) Trend by Month in Urbino
Get Live Urbino Market Intelligence 👇

Explore Real-time Analytics
Airbnb Seasonality Analysis & Trends in Urbino (2026)
Peak Season (August, July, September)
- Revenue averages $1,805 per month
- Occupancy rates average 45.3%
- Daily rates average $122
Shoulder Season
- Revenue averages $1,168 per month
- Occupancy maintains around 32.0%
- Daily rates hold near $124
Low Season (January, February, March)
- Revenue drops to average $854 per month
- Occupancy decreases to average 25.7%
- Daily rates adjust to average $118
Seasonality Insights for Urbino
- The Airbnb seasonality in Urbino shows highly seasonal trends requiring careful strategy. While the sections above show seasonal averages, it's also insightful to look at the extremes:
- During the high season, the absolute peak month showcases Urbino's highest earning potential, with monthly revenues capable of climbing to $2,036, occupancy reaching a high of 50.3%, and ADRs peaking at $140.
- Conversely, the slowest single month of the year, typically falling within the low season, marks the market's lowest point. In this month, revenue might dip to $731, occupancy could drop to 20.3%, and ADRs may adjust down to $110.
- Understanding both the seasonal averages and these monthly peaks and troughs in revenue, occupancy, and ADR is crucial for maximizing your Airbnb profit potential in Urbino.
Seasonal Strategies for Maximizing Profit
- Peak Season: Maximize revenue through premium pricing and potentially longer minimum stays. Ensure high availability.
- Low Season: Offer competitive pricing, special promotions (e.g., extended stay discounts), and flexible cancellation policies. Target off-season travelers like remote workers or budget-conscious guests.
- Shoulder Seasons: Implement dynamic pricing that balances peak and low rates. Target weekend travelers or specific events. Offer slightly more flexible terms than peak season.
- Regularly analyze your own performance against these Urbino seasonality benchmarks and adjust your pricing and availability strategy accordingly.
Best Areas for Airbnb Investment in Urbino (2026)
Exploring the top neighborhoods for short-term rentals in Urbino? This section highlights key areas, outlining why they are attractive for hosts and guests, along with notable local attractions. Consider these locations based on your target guest profile and investment strategy.
| Neighborhood / Area | Why Host Here? (Target Guests & Appeal) | Key Attractions & Landmarks |
|---|---|---|
| Centro Storico | The historic center of Urbino, a UNESCO World Heritage site, filled with Renaissance architecture and rich history. Ideal for tourists seeking cultural experiences and local cuisine. | Duke's Palace, Urbino Cathedral, National Gallery of Marche, Raffaello's House, Orto Botanico, University of Urbino |
| Via Raffaello | A vibrant street named after the famous painter Raffaello, lined with shops, cafés, and restaurants. Popular with both tourists and locals looking for a lively atmosphere. | Street Art, Shops and Boutiques, Cafés, Local Restaurants, Historical buildings |
| Piazza della Repubblica | The main square of Urbino, offering a central location for visitors and a beautiful setting for social gatherings. It is a hub for local events and festivals. | Palazzo del Ducato, Cafés and Gelaterias, Market Events, Cultural Festivals |
| Colle San Bartolo | A scenic area just outside Urbino, perfect for nature lovers looking to explore the surrounding hills and countryside. Offers tranquility and beautiful landscapes. | Nature Trails, Panoramic Views, Cycling Paths, Wildlife Spotting |
| Penna San Giovanni | A charming village near Urbino with picturesque views and a quiet atmosphere. Ideal for travelers seeking a peaceful retreat with access to natural beauty. | Historical Village Center, Local Vineyards, Hiking Trails |
| Fermignano | A small town near Urbino known for its historic buildings and local culture. Attracts visitors interested in exploring smaller, authentic Italian towns. | Historic Streets, Roman Bridge, Local Market |
| Urbania | Another nearby town rich in history and local traditions, famous for its ceramics. Offers visitors a different but complementary experience to Urbino. | Ceramics Museum, Historical Buildings, Cultural Events |
| Montefeltro | A stunning region surrounding Urbino, known for its medieval castles and stunning views. Great for visitors interested in history and outdoor activities. | Fortresses, Nature Parks, Hiking Trails, Biking Routes |
Understanding Airbnb License Requirements & STR Laws in Urbino (2026)
Yes, Urbino, Marche, Italy enforces high STR regulations. Obtaining a license and ensuring compliance is almost certainly required according to current 2026 STR laws. Always verify the latest short term rental regulations and Airbnb license requirements directly with local government authorities for Urbino to ensure full compliance before hosting.
(Source: AirROI data, 2026, based on 82% licensed listings)
Top Performing Airbnb Properties in Urbino (2026)
Benchmark your potential! Explore examples of top-performing Airbnb properties in Urbinobased on Trailing Twelve Month (TTM) revenue. Analyze their characteristics, revenue, occupancy rate, and ADR to understand what drives success in this market.
Calbertone family and bike holidays Urbino
Entire Place • 4 bedrooms
Boutique Apartment Urbino near Ducal Palace
Entire Place • 2 bedrooms
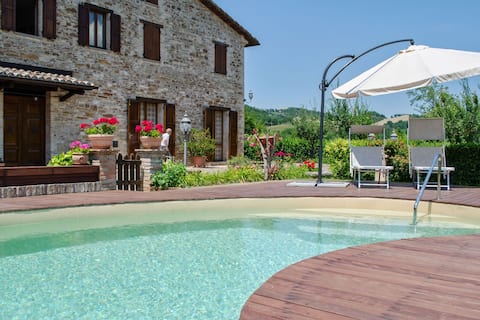
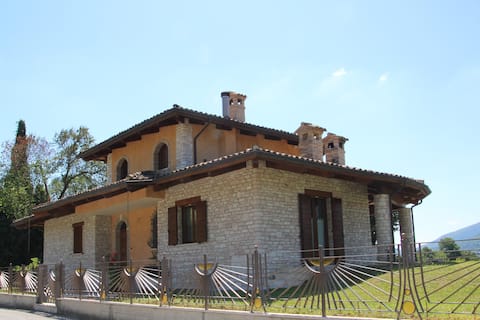
Pet-Friendly Villa with Pool
Entire Place • 5 bedrooms

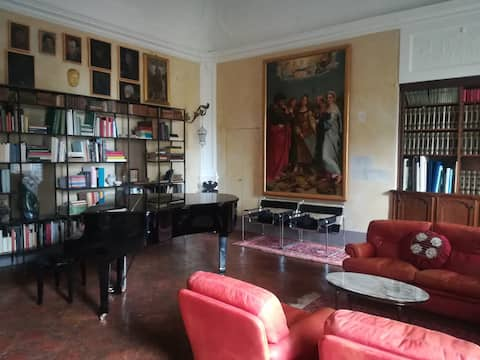
Renovated and detached historic home
Entire Place • 2 bedrooms
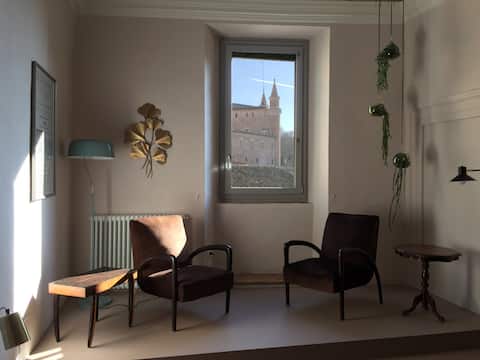
Apartment Comandino with view
Entire Place • 2 bedrooms

Urbino Apartments - Torricini View
Entire Place • 1 bedroom
Note: Performance varies based on location, size, amenities, seasonality, and management quality. Data reflects the past 12 months.
Top Performing Airbnb Hosts in Urbino (2026)
Learn from the best! This table showcases top-performing Airbnb hosts in Urbino based on the number of properties managed and estimated total revenue over the past year. Analyze their scale and performance metrics.
| Host Name | Properties | Grossing Revenue | Stay Reviews | Avg Rating |
|---|---|---|---|---|
| Adalberto | 18 | $234,899 | 1254 | 4.81/5.0 |
| Marianna | 4 | $73,579 | 175 | 4.92/5.0 |
| Federico | 5 | $69,337 | 104 | 4.85/5.0 |
| Country House Il Biiroccio | 5 | $62,414 | 46 | 4.68/5.0 |
| Maria | 3 | $62,013 | 49 | 4.97/5.0 |
| Maria | 3 | $48,685 | 224 | 4.97/5.0 |
| Angelo | 1 | $43,678 | 82 | 4.93/5.0 |
| Iris - BELVILLA | 1 | $39,377 | 28 | 4.86/5.0 |
| Michele | 3 | $36,391 | 10 | 4.67/5.0 |
| Francesca | 2 | $35,257 | 25 | 4.79/5.0 |
Analyzing the strategies of top hosts, such as their property selection, pricing, and guest communication, can offer valuable lessons for optimizing your own Airbnb operations in Urbino.
Dive Deeper: Advanced Urbino STR Market Data (2026)
Ready to unlock more insights? AirROI provides access to advanced metrics and comprehensive Airbnb data for Urbino. Explore detailed analytics beyond this report to refine your investment strategy, optimize pricing, and maximize your vacation rental profits.
Explore Advanced MetricsUrbino Short-Term Rental Market Composition (2026): Property & Room Types
Room Type Distribution
Property Type Distribution
Market Composition Insights for Urbino
- The Urbino Airbnb market composition is heavily skewed towards Entire Home/Apt listings, which make up 70.2% of the 124 active rentals. This indicates strong guest preference for privacy and space.
- Looking at the property type distribution in Urbino, Apartment/Condo properties are the most common (56.5%), reflecting the local real estate landscape.
- Houses represent a significant 24.2% portion, catering likely to families or larger groups.
- The presence of 18.5% Hotel/Boutique listings indicates integration with traditional hospitality.
- Smaller segments like outdoor/unique (combined 0.8%) offer potential for unique stay experiences.
Urbino Airbnb Room Capacity Analysis (2026): Bedroom Distribution
Distribution of Listings by Number of Bedrooms
Room Capacity Insights for Urbino
- The dominant room capacity in Urbino is 1 bedroom listings, making up 33.1% of the market. This suggests a strong demand for properties suitable for couples or solo travelers.
- Together, 1 bedroom and 2 bedrooms properties represent 58.1% of the active Airbnb listings in Urbino, indicating a high concentration in these sizes.
Urbino Vacation Rental Guest Capacity Trends (2026)
Distribution of Listings by Guest Capacity
Guest Capacity Insights for Urbino
- The most common guest capacity trend in Urbino vacation rentals is listings accommodating 4 guests (24.2%). This suggests the primary traveler segment is likely small families or groups.
- Properties designed for 4 guests and 2 guests dominate the Urbino STR market, accounting for 41.1% of listings.
- 12.1% of properties accommodate 6+ guests, serving the market segment for larger families or group travel in Urbino.
- On average, properties in Urbino are equipped to host 2.9 guests.
Urbino Airbnb Booking Patterns (2026): Available vs. Booked Days
Available Days Distribution
Booked Days Distribution
Booking Pattern Insights for Urbino
- The most common availability pattern in Urbino falls within the 271-366 days range, representing 59.7% of listings. This suggests many properties have significant open periods on their calendars.
- Approximately 93.6% of listings show high availability (181+ days open annually), indicating potential for increased bookings or specific owner usage patterns.
- For booked days, the 91-180 days range is most frequent in Urbino (37.1%), reflecting common guest stay durations or potential owner blocking patterns.
- A notable 7.3% of properties secure long booking periods (181+ days booked per year), highlighting successful long-term rental strategies or significant owner usage.
Urbino Airbnb Minimum Stay Requirements Analysis
Distribution of Listings by Minimum Night Requirement
1 Night
47 listings
37.9% of total
2 Nights
26 listings
21% of total
3 Nights
7 listings
5.6% of total
4-6 Nights
1 listings
0.8% of total
7-29 Nights
10 listings
8.1% of total
30+ Nights
33 listings
26.6% of total
Key Insights
- The most prevalent minimum stay requirement in Urbino is 1 Night, adopted by 37.9% of listings. This highlights the market's preference for shorter, flexible bookings.
- A significant segment (26.6%) caters to monthly stays (30+ nights) in Urbino, pointing to opportunities in the extended-stay market.
Recommendations
- Align with the market by considering a 1 Night minimum stay, as 37.9% of Urbino hosts use this setting.
- Explore offering discounts for stays of 30+ nights to attract the 26.6% of the market seeking extended stays.
- Adjust minimum nights based on seasonality – potentially shorter during low season and longer during peak demand periods in Urbino.
Urbino Airbnb Cancellation Policy Trends Analysis (2026)
Limited
2 listings
1.6% of total
Super Strict 60 Days
1 listings
0.8% of total
Super Strict 30 Days
1 listings
0.8% of total
Flexible
67 listings
54% of total
Moderate
39 listings
31.5% of total
Firm
9 listings
7.3% of total
Strict
5 listings
4% of total
Cancellation Policy Insights for Urbino
- The prevailing Airbnb cancellation policy trend in Urbino is Flexible, used by 54% of listings.
- The market strongly favors guest-friendly terms, with 85.5% of listings offering Flexible or Moderate policies. This suggests guests in Urbino may expect booking flexibility.
- Strict cancellation policies are quite rare (4%), potentially making listings with this policy less competitive unless justified by high demand or property type.
Recommendations for Hosts
- Consider adopting a Flexible policy to align with the 54% market standard in Urbino.
- Given the high prevalence of Flexible policies (54%), offering this can enhance booking appeal, especially during shoulder seasons.
- Using a Strict policy might deter some guests, as only 4% of listings use it. Evaluate if potential revenue protection outweighs possible lower booking rates.
- Regularly review your cancellation policy against competitors and market demand shifts in Urbino.
Urbino STR Booking Lead Time Analysis (2026)
Average Booking Lead Time by Month
Booking Lead Time Insights for Urbino
- The overall average booking lead time for vacation rentals in Urbino is 52 days.
- Guests book furthest in advance for stays during April (average 65 days), likely coinciding with peak travel demand or local events.
- The shortest booking windows occur for stays in January (average 27 days), indicating more last-minute travel plans during this time.
- Seasonally, Spring (54 days avg.) sees the longest lead times, while Winter (38 days avg.) has the shortest, reflecting typical travel planning cycles.
Recommendations for Hosts
- Use the overall average lead time (52 days) as a baseline for your pricing and availability strategy in Urbino.
- For April stays, consider implementing length-of-stay discounts or slightly higher rates for bookings made less than 65 days out to capitalize on advance planning.
- Target marketing efforts for the Spring season well in advance (at least 54 days) to capture early planners.
- Monitor your own booking lead times against these Urbino averages to identify opportunities for dynamic pricing adjustments.
Popular & Essential Airbnb Amenities in Urbino (2026)
Amenity Prevalence
Amenity Insights for Urbino
- Popular amenities like Heating, Wifi, Hair dryer are common but not universal. Offering these can provide a competitive edge.
- Warning: Wifi is not universally provided but is considered essential globally. Ensure reliable Wifi is offered.
Recommendations for Hosts
- Consider adding popular differentiators like Heating or Wifi to increase appeal.
- Highlight unique or less common amenities you offer (e.g., hot tub, dedicated workspace, EV charger) in your listing description and photos.
- Regularly check competitor amenities in Urbino to stay competitive.
Urbino Airbnb Guest Demographics & Profile Analysis (2026)
Guest Profile Summary for Urbino
- The typical guest profile for Airbnb in Urbino consists of a mix of domestic (46%) and international guests, with top international origins including Germany, typically belonging to the Post-2000s (Gen Z/Alpha) group (50%), primarily speaking English or Italian.
- Domestic travelers account for 45.8% of guests.
- Key international markets include Italy (45.8%) and Germany (10%).
- Top languages spoken are English (36.5%) followed by Italian (22.6%).
- A significant demographic segment is the Post-2000s (Gen Z/Alpha) group, representing 50% of guests.
Recommendations for Hosts
- Balance marketing efforts between domestic and international channels based on the guest mix.
- Tailor amenities and listing descriptions to appeal to the dominant Post-2000s (Gen Z/Alpha) demographic (e.g., highlight fast WiFi, smart home features, local guides).
- Highlight unique local experiences or amenities relevant to the primary guest profile.
- Consider seasonal promotions aligned with peak travel times for key origin markets.
Nearby Short-Term Rental Market Comparison
How does the Urbino Airbnb market stack up against its neighbors? Compare key performance metrics like average monthly revenue, ADR, and occupancy rates in surrounding areas to understand the broader regional STR landscape.
| Market | Active Properties | Monthly Revenue | Daily Rate | Avg. Occupancy |
|---|---|---|---|---|
| Tignano | 12 | $4,160 | $366.92 | 45% |
| Celleno | 13 | $4,041 | $594.80 | 28% |
| Marciano della Chiana | 17 | $3,823 | $545.25 | 35% |
| Buonconvento | 60 | $3,186 | $440.58 | 43% |
| Collevecchio | 14 | $3,140 | $334.97 | 40% |
| Radda in Chianti | 94 | $3,098 | $361.57 | 39% |
| Palombara Sabina | 15 | $2,914 | $309.11 | 38% |
| Impruneta | 146 | $2,887 | $297.45 | 40% |
| Lastra a Signa | 96 | $2,760 | $311.91 | 43% |
| Florence | 10,496 | $2,755 | $225.30 | 49% |