Montefelcino Airbnb Market Analysis 2025: Short Term Rental Data & Vacation Rental Statistics in Marche, Italy
Is Airbnb profitable in Montefelcino in 2025? Explore comprehensive Airbnb analytics for Montefelcino, Marche, Italy to uncover income potential. This 2025 STR market report for Montefelcino, based on AirROI data from September 2024 to August 2025, reveals key trends in the niche market of 18 active listings.
Whether you're considering an Airbnb investment in Montefelcino, optimizing your existing vacation rental, or exploring rental arbitrage opportunities, understanding the Montefelcino Airbnb data is crucial. Leveraging the low regulation environment is key to maximizing your short term rental income potential. Let's dive into the specifics.
Key Montefelcino Airbnb Performance Metrics Overview
Monthly Airbnb Revenue Variations & Income Potential in Montefelcino (2025)
Understanding the monthly revenue variations for Airbnb listings in Montefelcino is key to maximizing your short term rental income potential. Seasonality significantly impacts earnings. Our analysis, based on data from the past 12 months, shows that the peak revenue month for STRs in Montefelcino is typically September, while February often presents the lowest earnings, highlighting opportunities for strategic pricing adjustments during shoulder and low seasons. Explore the typical Airbnb income in Montefelcino across different performance tiers:
- Best-in-class properties (Top 10%) achieve $4,983+ monthly, often utilizing dynamic pricing and superior guest experiences.
- Strong performing properties (Top 25%) earn $2,168 or more, indicating effective management and desirable locations/amenities.
- Typical properties (Median) generate around $971 per month, representing the average market performance.
- Entry-level properties (Bottom 25%) see earnings around $394, often with potential for optimization.
Average Monthly Airbnb Earnings Trend in Montefelcino
Montefelcino Airbnb Occupancy Rate Trends (2025)
Maximize your bookings by understanding the Montefelcino STR occupancy trends. Seasonal demand shifts significantly influence how often properties are booked. Typically, Septembersees the highest demand (peak season occupancy), while January experiences the lowest (low season). Effective strategies, like adjusting minimum stays or offering promotions, can boost occupancy during slower periods. Here's how different property tiers perform in Montefelcino:
- Best-in-class properties (Top 10%) achieve 55%+ occupancy, indicating high desirability and potentially optimized availability.
- Strong performing properties (Top 25%) maintain 38% or higher occupancy, suggesting good market fit and guest satisfaction.
- Typical properties (Median) have an occupancy rate around 18%.
- Entry-level properties (Bottom 25%) average 9% occupancy, potentially facing higher vacancy.
Average Monthly Occupancy Rate Trend in Montefelcino
Average Daily Rate (ADR) Airbnb Trends in Montefelcino (2025)
Effective short term rental pricing strategy in Montefelcino involves understanding monthly ADR fluctuations. The Average Daily Rate (ADR) for Airbnb in Montefelcino typically peaks in August and dips lowest during October. Leveraging Airbnb dynamic pricing tools or strategies based on this seasonality can significantly boost revenue. Here's a look at the typical nightly rates achieved:
- Best-in-class properties (Top 10%) command rates of $581+ per night, often due to premium features or locations.
- Strong performing properties (Top 25%) achieve nightly rates of $236 or more.
- Typical properties (Median) charge around $144 per night.
- Entry-level properties (Bottom 25%) earn around $102 per night.
Average Daily Rate (ADR) Trend by Month in Montefelcino
Get Live Montefelcino Market Intelligence 👇
Explore Real-time Analytics
Airbnb Seasonality Analysis & Trends in Montefelcino (2025)
Peak Season (September, July, June)
- Revenue averages $3,793 per month
- Occupancy rates average 36.2%
- Daily rates average $305
Shoulder Season
- Revenue averages $1,739 per month
- Occupancy maintains around 24.1%
- Daily rates hold near $276
Low Season (February, March, December)
- Revenue drops to average $869 per month
- Occupancy decreases to average 24.1%
- Daily rates adjust to average $226
Seasonality Insights for Montefelcino
- The Airbnb seasonality in Montefelcino shows highly seasonal trends requiring careful strategy. While the sections above show seasonal averages, it's also insightful to look at the extremes:
- During the high season, the absolute peak month showcases Montefelcino's highest earning potential, with monthly revenues capable of climbing to $4,870, occupancy reaching a high of 54.0%, and ADRs peaking at $357.
- Conversely, the slowest single month of the year, typically falling within the low season, marks the market's lowest point. In this month, revenue might dip to $704, occupancy could drop to 14.5%, and ADRs may adjust down to $216.
- Understanding both the seasonal averages and these monthly peaks and troughs in revenue, occupancy, and ADR is crucial for maximizing your Airbnb profit potential in Montefelcino.
Seasonal Strategies for Maximizing Profit
- Peak Season: Maximize revenue through premium pricing and potentially longer minimum stays. Ensure high availability.
- Low Season: Offer competitive pricing, special promotions (e.g., extended stay discounts), and flexible cancellation policies. Target off-season travelers like remote workers or budget-conscious guests.
- Shoulder Seasons: Implement dynamic pricing that balances peak and low rates. Target weekend travelers or specific events. Offer slightly more flexible terms than peak season.
- Regularly analyze your own performance against these Montefelcino seasonality benchmarks and adjust your pricing and availability strategy accordingly.
Best Areas for Airbnb Investment in Montefelcino (2025)
Exploring the top neighborhoods for short-term rentals in Montefelcino? This section highlights key areas, outlining why they are attractive for hosts and guests, along with notable local attractions. Consider these locations based on your target guest profile and investment strategy.
| Neighborhood / Area | Why Host Here? (Target Guests & Appeal) | Key Attractions & Landmarks |
|---|---|---|
| Montefelcino Centro | The main historic center of Montefelcino with charming streets, local shops, and authentic Italian dining options. Ideal for tourists seeking a traditional Italian ambiance. | Palazzo Comunale, Church of San Giovanni Battista, Local trattorias, Historic architecture |
| Surrounding Countryside | Picturesque rural area surrounding Montefelcino, known for its stunning landscapes and tranquility. Attracts nature lovers and those seeking an escape from city life. | Vineyards, Olive groves, Cycling paths, Tranquil nature walks |
| Nearby Fano | A coastal town with beautiful beaches and vibrant culture. Offers an exciting day trip for guests looking to enjoy the Adriatic Sea and local festivals. | Fano Beach, Roman history sites, Local seafood restaurants, Summer festivals |
| Urbino | Renowned for its Renaissance architecture and historical significance, Urbino is a UNESCO World Heritage site that draws cultural tourists and art enthusiasts. | Ducal Palace, Raffaello's House, Historic city center, Università degli Studi |
| Frontone | A scenic village known for its medieval castle and stunning mountain views. Appeals to tourists seeking adventure and hiking opportunities. | Frontone Castle, Hiking trails, Local festivals, Panoramic views |
| Pesaro | A vibrant city on the Adriatic coast, famous for its beaches and as the birthplace of Gioachino Rossini. Great for guests looking to balance beach time with cultural activities. | Rossini Opera Festival, Pesaro Beach, Historic center, Rocca Costanza |
| Gradara | Famous for its well-preserved medieval castle and romantic history. Ideal for history buffs and those looking for a unique cultural experience. | Gradara Castle, Piazza Principi, Historical reenactments, Beautiful views |
| San Marino | Located nearby, this microstate is a popular tourist destination known for its medieval Guaita and rich history, ideal for day trippers from Montefelcino. | Guaita, Historic center, Museums, St. Marinus Basilica |
Understanding Airbnb License Requirements & STR Laws in Montefelcino (2025)
While Montefelcino, Marche, Italy currently shows low STR regulations, specific Airbnb license requirements might still exist or change. Always verify the latest short term rental regulations and Airbnb license requirements directly with local government authorities for Montefelcino to ensure full compliance before hosting.
(Source: AirROI data, 2025, finding no licensed listings among those analyzed)
Top Performing Airbnb Properties in Montefelcino (2025)
Benchmark your potential! Explore examples of top-performing Airbnb properties in Montefelcinobased on Trailing Twelve Month (TTM) revenue. Analyze their characteristics, revenue, occupancy rate, and ADR to understand what drives success in this market.

Casal del Sole
Entire Place • 7 bedrooms
Casa Melograno 11+2, Emma Villas.
Entire Place • 6 bedrooms

Amazing apartment in Montefelcino
Entire Place • 4 bedrooms

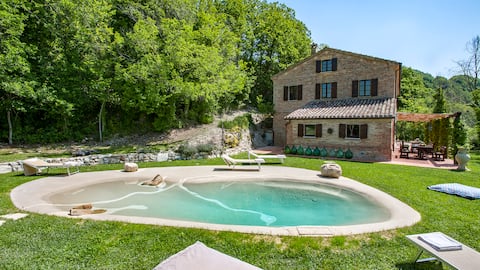
House with private pool and cabin, sleeps 8
Entire Place • 3 bedrooms

Casal del Sole - L'Ulivo apartment 1 of 4
Entire Place • 1 bedroom

Ca' le Campane
Entire Place • 2 bedrooms
Note: Performance varies based on location, size, amenities, seasonality, and management quality. Data reflects the past 12 months.
Top Performing Airbnb Hosts in Montefelcino (2025)
Learn from the best! This table showcases top-performing Airbnb hosts in Montefelcino based on the number of properties managed and estimated total revenue over the past year. Analyze their scale and performance metrics.
| Host Name | Properties | Grossing Revenue | Stay Reviews | Avg Rating |
|---|---|---|---|---|
| Stefano | 4 | $105,418 | 16 | 5.00/5.0 |
| Emma | 1 | $35,785 | 8 | 4.75/5.0 |
| Adriana | 3 | $23,346 | 41 | 4.96/5.0 |
| Novasol | 1 | $21,319 | 4 | 4.50/5.0 |
| Marco | 1 | $16,577 | 10 | 4.80/5.0 |
| Alessandra | 3 | $11,985 | 19 | 4.88/5.0 |
| Stefano | 1 | $7,792 | 9 | 4.89/5.0 |
| Giorgio | 1 | $4,348 | 13 | 4.92/5.0 |
| Daniela | 1 | $2,518 | 10 | 5.00/5.0 |
| Luciano | 1 | $2,332 | 16 | 4.50/5.0 |
Analyzing the strategies of top hosts, such as their property selection, pricing, and guest communication, can offer valuable lessons for optimizing your own Airbnb operations in Montefelcino.
Dive Deeper: Advanced Montefelcino STR Market Data (2025)
Ready to unlock more insights? AirROI provides access to advanced metrics and comprehensive Airbnb data for Montefelcino. Explore detailed analytics beyond this report to refine your investment strategy, optimize pricing, and maximize your vacation rental profits.
Explore Advanced MetricsMontefelcino Short-Term Rental Market Composition (2025): Property & Room Types
Room Type Distribution
Property Type Distribution
Market Composition Insights for Montefelcino
- The Montefelcino Airbnb market composition is heavily skewed towards Entire Home/Apt listings, which make up 100% of the 18 active rentals. This indicates strong guest preference for privacy and space.
- Looking at the property type distribution in Montefelcino, House properties are the most common (61.1%), reflecting the local real estate landscape.
- Houses represent a significant 61.1% portion, catering likely to families or larger groups.
- The presence of 5.6% Hotel/Boutique listings indicates integration with traditional hospitality.
Montefelcino Airbnb Room Capacity Analysis (2025): Bedroom Distribution
Distribution of Listings by Number of Bedrooms
Room Capacity Insights for Montefelcino
- The dominant room capacity in Montefelcino is 1 bedroom listings, making up 38.9% of the market. This suggests a strong demand for properties suitable for couples or solo travelers.
- Together, 1 bedroom and 3 bedrooms properties represent 61.1% of the active Airbnb listings in Montefelcino, indicating a high concentration in these sizes.
- A significant 44.4% of listings offer 3+ bedrooms, catering to larger groups and families seeking more space in Montefelcino.
Montefelcino Vacation Rental Guest Capacity Trends (2025)
Distribution of Listings by Guest Capacity
Guest Capacity Insights for Montefelcino
- The most common guest capacity trend in Montefelcino vacation rentals is listings accommodating 4 guests (22.2%). This suggests the primary traveler segment is likely small families or groups.
- Properties designed for 4 guests and 8+ guests dominate the Montefelcino STR market, accounting for 38.9% of listings.
- 44.5% of properties accommodate 6+ guests, serving the market segment for larger families or group travel in Montefelcino.
- On average, properties in Montefelcino are equipped to host 5.2 guests.
Montefelcino Airbnb Booking Patterns (2025): Available vs. Booked Days
Available Days Distribution
Booked Days Distribution
Booking Pattern Insights for Montefelcino
- The most common availability pattern in Montefelcino falls within the 271-366 days range, representing 88.9% of listings. This suggests many properties have significant open periods on their calendars.
- Approximately 100.0% of listings show high availability (181+ days open annually), indicating potential for increased bookings or specific owner usage patterns.
- For booked days, the 31-90 days range is most frequent in Montefelcino (44.4%), reflecting common guest stay durations or potential owner blocking patterns.
Montefelcino Airbnb Minimum Stay Requirements Analysis
Distribution of Listings by Minimum Night Requirement
2 Nights
3 listings
16.7% of total
3 Nights
1 listings
5.6% of total
4-6 Nights
5 listings
27.8% of total
7-29 Nights
3 listings
16.7% of total
30+ Nights
6 listings
33.3% of total
Key Insights
- The most prevalent minimum stay requirement in Montefelcino is 30+ Nights, adopted by 33.3% of listings. This highlights the market's preference for longer commitments.
- Very short stays (1-2 nights) are less common (16.7%), suggesting hosts prefer slightly longer bookings to optimize turnover.
- A significant segment (33.3%) caters to monthly stays (30+ nights) in Montefelcino, pointing to opportunities in the extended-stay market.
Recommendations
- Align with the market by considering a 30+ Nights minimum stay, as 33.3% of Montefelcino hosts use this setting.
- Explore offering discounts for stays of 30+ nights to attract the 33.3% of the market seeking extended stays.
- Adjust minimum nights based on seasonality – potentially shorter during low season and longer during peak demand periods in Montefelcino.
Montefelcino Airbnb Cancellation Policy Trends Analysis (2025)
Super Strict 60 Days
1 listings
5.9% of total
Super Strict 30 Days
1 listings
5.9% of total
Flexible
5 listings
29.4% of total
Moderate
6 listings
35.3% of total
Strict
4 listings
23.5% of total
Cancellation Policy Insights for Montefelcino
- The prevailing Airbnb cancellation policy trend in Montefelcino is Moderate, used by 35.3% of listings.
- There's a relatively balanced mix between guest-friendly (64.7%) and stricter (23.5%) policies, offering choices for different guest needs.
Recommendations for Hosts
- Consider adopting a Moderate policy to align with the 35.3% market standard in Montefelcino.
- Regularly review your cancellation policy against competitors and market demand shifts in Montefelcino.
Montefelcino STR Booking Lead Time Analysis (2025)
Average Booking Lead Time by Month
Booking Lead Time Insights for Montefelcino
- The overall average booking lead time for vacation rentals in Montefelcino is 63 days.
- Guests book furthest in advance for stays during June (average 112 days), likely coinciding with peak travel demand or local events.
- The shortest booking windows occur for stays in February (average 1 days), indicating more last-minute travel plans during this time.
- Seasonally, Summer (100 days avg.) sees the longest lead times, while Fall (25 days avg.) has the shortest, reflecting typical travel planning cycles.
Recommendations for Hosts
- Use the overall average lead time (63 days) as a baseline for your pricing and availability strategy in Montefelcino.
- For June stays, consider implementing length-of-stay discounts or slightly higher rates for bookings made less than 112 days out to capitalize on advance planning.
- During February, focus on last-minute booking availability and promotions, as guests book with very short notice (1 days avg.).
- Target marketing efforts for the Summer season well in advance (at least 100 days) to capture early planners.
- Monitor your own booking lead times against these Montefelcino averages to identify opportunities for dynamic pricing adjustments.
Popular & Essential Airbnb Amenities in Montefelcino (2025)
Amenity Prevalence
Amenity Insights for Montefelcino
- Popular amenities like Free parking on premises, Dishes and silverware, Kitchen are common but not universal. Offering these can provide a competitive edge.
Recommendations for Hosts
- Consider adding popular differentiators like Free parking on premises or Dishes and silverware to increase appeal.
- Highlight unique or less common amenities you offer (e.g., hot tub, dedicated workspace, EV charger) in your listing description and photos.
- Regularly check competitor amenities in Montefelcino to stay competitive.
Montefelcino Airbnb Guest Demographics & Profile Analysis (2025)
Guest Profile Summary for Montefelcino
- The typical guest profile for Airbnb in Montefelcino consists of predominantly international visitors (77%), with top international origins including Italy, typically belonging to the Post-2000s (Gen Z/Alpha) group (50%), primarily speaking English or German.
- Domestic travelers account for 22.7% of guests.
- Key international markets include Germany (31.8%) and Italy (22.7%).
- Top languages spoken are English (40%) followed by German (24%).
- A significant demographic segment is the Post-2000s (Gen Z/Alpha) group, representing 50% of guests.
Recommendations for Hosts
- Focus marketing internationally, particularly towards travelers from Italy.
- Tailor amenities and listing descriptions to appeal to the dominant Post-2000s (Gen Z/Alpha) demographic (e.g., highlight fast WiFi, smart home features, local guides).
- Highlight unique local experiences or amenities relevant to the primary guest profile.
- Consider seasonal promotions aligned with peak travel times for key origin markets.
Nearby Short-Term Rental Market Comparison
How does the Montefelcino Airbnb market stack up against its neighbors? Compare key performance metrics like average monthly revenue, ADR, and occupancy rates in surrounding areas to understand the broader regional STR landscape.
| Market | Active Properties | Monthly Revenue | Daily Rate | Avg. Occupancy |
|---|---|---|---|---|
| Marciano della Chiana | 17 | $3,650 | $501.78 | 35% |
| Tignano | 11 | $3,518 | $362.03 | 41% |
| Celleno | 15 | $2,913 | $546.77 | 24% |
| Allerona | 10 | $2,844 | $461.35 | 40% |
| Florence | 10,138 | $2,730 | $218.48 | 51% |
| Marcialla | 27 | $2,721 | $252.52 | 50% |
| Impruneta | 144 | $2,675 | $285.03 | 39% |
| Monte San Savino | 96 | $2,667 | $346.69 | 37% |
| Buonconvento | 58 | $2,650 | $396.17 | 41% |
| Cavriglia | 66 | $2,616 | $291.61 | 38% |