Amandola Airbnb Market Analysis 2025: Short Term Rental Data & Vacation Rental Statistics in Marche, Italy
Is Airbnb profitable in Amandola in 2025? Explore comprehensive Airbnb analytics for Amandola, Marche, Italy to uncover income potential. This 2025 STR market report for Amandola, based on AirROI data from September 2024 to August 2025, reveals key trends in the niche market of 18 active listings.
Whether you're considering an Airbnb investment in Amandola, optimizing your existing vacation rental, or exploring rental arbitrage opportunities, understanding the Amandola Airbnb data is crucial. Leveraging the low regulation environment is key to maximizing your short term rental income potential. Let's dive into the specifics.
Key Amandola Airbnb Performance Metrics Overview
Monthly Airbnb Revenue Variations & Income Potential in Amandola (2025)
Understanding the monthly revenue variations for Airbnb listings in Amandola is key to maximizing your short term rental income potential. Seasonality significantly impacts earnings. Our analysis, based on data from the past 12 months, shows that the peak revenue month for STRs in Amandola is typically July, while October often presents the lowest earnings, highlighting opportunities for strategic pricing adjustments during shoulder and low seasons. Explore the typical Airbnb income in Amandola across different performance tiers:
- Best-in-class properties (Top 10%) achieve $2,759+ monthly, often utilizing dynamic pricing and superior guest experiences.
- Strong performing properties (Top 25%) earn $1,905 or more, indicating effective management and desirable locations/amenities.
- Typical properties (Median) generate around $860 per month, representing the average market performance.
- Entry-level properties (Bottom 25%) see earnings around $504, often with potential for optimization.
Average Monthly Airbnb Earnings Trend in Amandola
Amandola Airbnb Occupancy Rate Trends (2025)
Maximize your bookings by understanding the Amandola STR occupancy trends. Seasonal demand shifts significantly influence how often properties are booked. Typically, Februarysees the highest demand (peak season occupancy), while January experiences the lowest (low season). Effective strategies, like adjusting minimum stays or offering promotions, can boost occupancy during slower periods. Here's how different property tiers perform in Amandola:
- Best-in-class properties (Top 10%) achieve 77%+ occupancy, indicating high desirability and potentially optimized availability.
- Strong performing properties (Top 25%) maintain 53% or higher occupancy, suggesting good market fit and guest satisfaction.
- Typical properties (Median) have an occupancy rate around 26%.
- Entry-level properties (Bottom 25%) average 14% occupancy, potentially facing higher vacancy.
Average Monthly Occupancy Rate Trend in Amandola
Average Daily Rate (ADR) Airbnb Trends in Amandola (2025)
Effective short term rental pricing strategy in Amandola involves understanding monthly ADR fluctuations. The Average Daily Rate (ADR) for Airbnb in Amandola typically peaks in August and dips lowest during March. Leveraging Airbnb dynamic pricing tools or strategies based on this seasonality can significantly boost revenue. Here's a look at the typical nightly rates achieved:
- Best-in-class properties (Top 10%) command rates of $417+ per night, often due to premium features or locations.
- Strong performing properties (Top 25%) achieve nightly rates of $299 or more.
- Typical properties (Median) charge around $152 per night.
- Entry-level properties (Bottom 25%) earn around $79 per night.
Average Daily Rate (ADR) Trend by Month in Amandola
Get Live Amandola Market Intelligence 👇

Explore Real-time Analytics
Airbnb Seasonality Analysis & Trends in Amandola (2025)
Peak Season (July, August, December)
- Revenue averages $1,828 per month
- Occupancy rates average 40.2%
- Daily rates average $198
Shoulder Season
- Revenue averages $1,179 per month
- Occupancy maintains around 36.8%
- Daily rates hold near $183
Low Season (April, May, October)
- Revenue drops to average $840 per month
- Occupancy decreases to average 26.4%
- Daily rates adjust to average $187
Seasonality Insights for Amandola
- The Airbnb seasonality in Amandola shows highly seasonal trends requiring careful strategy. While the sections above show seasonal averages, it's also insightful to look at the extremes:
- During the high season, the absolute peak month showcases Amandola's highest earning potential, with monthly revenues capable of climbing to $1,986, occupancy reaching a high of 53.6%, and ADRs peaking at $207.
- Conversely, the slowest single month of the year, typically falling within the low season, marks the market's lowest point. In this month, revenue might dip to $798, occupancy could drop to 23.9%, and ADRs may adjust down to $177.
- Understanding both the seasonal averages and these monthly peaks and troughs in revenue, occupancy, and ADR is crucial for maximizing your Airbnb profit potential in Amandola.
Seasonal Strategies for Maximizing Profit
- Peak Season: Maximize revenue through premium pricing and potentially longer minimum stays. Ensure high availability.
- Low Season: Offer competitive pricing, special promotions (e.g., extended stay discounts), and flexible cancellation policies. Target off-season travelers like remote workers or budget-conscious guests.
- Shoulder Seasons: Implement dynamic pricing that balances peak and low rates. Target weekend travelers or specific events. Offer slightly more flexible terms than peak season.
- Regularly analyze your own performance against these Amandola seasonality benchmarks and adjust your pricing and availability strategy accordingly.
Best Areas for Airbnb Investment in Amandola (2025)
Exploring the top neighborhoods for short-term rentals in Amandola? This section highlights key areas, outlining why they are attractive for hosts and guests, along with notable local attractions. Consider these locations based on your target guest profile and investment strategy.
| Neighborhood / Area | Why Host Here? (Target Guests & Appeal) | Key Attractions & Landmarks |
|---|---|---|
| Centro Storico | The historic center of Amandola, filled with charming medieval architecture and local culture. Ideal for visitors who want to experience authentic Italian life and history. | Piazza Risorgimento, Chiesa di San Francesco, Museo della Città, Palazzo Comunale, Castello di Amandola |
| Monte Sibillini National Park | Amandola's proximity to this stunning national park makes it a prime destination for nature lovers and outdoor activities. Great for hiking, cycling, and exploring natural beauty. | Sibillini mountains, Hiking trails, Lakes of Pilato, Wooded areas, Flora and fauna diversity |
| Local Vineyards | The surrounding area is known for its vineyards producing excellent wines. Cooking and wine tasting experiences attract tourists looking to indulge in local culinary delights. | Vineyard tours, Wine tasting events, Local gastronomy, Agriturismo experiences, Winery events |
| Sant'Angelo in Pontano | A nearby town with beautiful landscapes and historic sites, making it a quieter alternative for guests looking to explore the region. | Chiesa di San Domenico, Historic center, Natural views, Countryside walks, Cultural events |
| Ascoli Piceno (30 min drive) | A beautiful town nearby with stunning architecture and a vibrant cultural scene. A popular day trip location for Airbnb guests in Amandola. | Piazza del Popolo, Forte Malatesta, Palazzo dei Capitani, Cathedral of Ascoli, Piceno Museums |
| Montemonaco | A tranquil village close to Amandola, perfect for guests seeking solitude and nature, with excellent views and hiking paths. | Tranquil countryside, Local farms, Hiking routes, Scenic landscapes, Cultural heritage sites |
| Smerillo | Small village offering a peaceful rural retreat. Ideal for guests who enjoy quiet village life and the beauty of the Marche region. | Chiesa di San Gregorio, Local artisan shops, Scenic countryside, Quiet paths, Cultural festivals |
| Cingoli (Lago di Cingoli) | Known for its artificial lake, often referred to as the 'Balcony of Marche'. A great for water-related activities and nature visits. | Lago di Cingoli, Water sports, Views over the Marche, Hiking pathways, Local eateries |
Understanding Airbnb License Requirements & STR Laws in Amandola (2025)
While Amandola, Marche, Italy currently shows low STR regulations, specific Airbnb license requirements might still exist or change. Always verify the latest short term rental regulations and Airbnb license requirements directly with local government authorities for Amandola to ensure full compliance before hosting.
(Source: AirROI data, 2025, finding no licensed listings among those analyzed)
Top Performing Airbnb Properties in Amandola (2025)
Benchmark your potential! Explore examples of top-performing Airbnb properties in Amandolabased on Trailing Twelve Month (TTM) revenue. Analyze their characteristics, revenue, occupancy rate, and ADR to understand what drives success in this market.

The 400 year old Hay-barn, with sauna
Entire Place • 1 bedroom

Valley View Romantic Farmhouse Apartment
Entire Place • 2 bedrooms
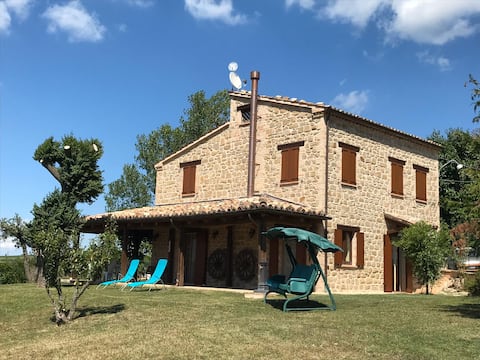
Villa Arzilla, fantastic view of the Sibillini Mountains
Entire Place • 3 bedrooms
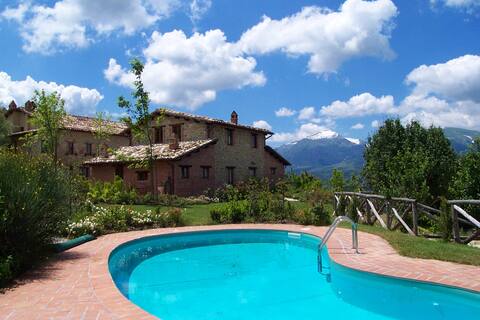
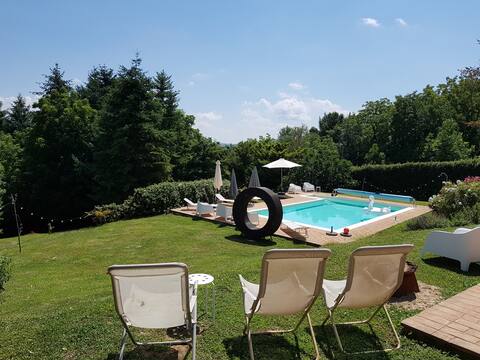
Farmhouse with a view of the Sibillini Mountains and a swimming pool
Entire Place • 4 bedrooms

House - Il Gioiello - with Jacuzzi and Sauna
Entire Place • 2 bedrooms
Villa Farrelli, Amandola
Entire Place • 5 bedrooms
Note: Performance varies based on location, size, amenities, seasonality, and management quality. Data reflects the past 12 months.
Top Performing Airbnb Hosts in Amandola (2025)
Learn from the best! This table showcases top-performing Airbnb hosts in Amandola based on the number of properties managed and estimated total revenue over the past year. Analyze their scale and performance metrics.
| Host Name | Properties | Grossing Revenue | Stay Reviews | Avg Rating |
|---|---|---|---|---|
| Tamara | 1 | $26,875 | 33 | 4.97/5.0 |
| Mcdue Homes | 2 | $21,127 | 19 | 4.71/5.0 |
| Sarah | 3 | $18,072 | 29 | 4.90/5.0 |
| Sandra | 1 | $12,462 | 26 | 4.85/5.0 |
| Simone | 1 | $11,488 | 35 | 4.94/5.0 |
| Sarah | 1 | $11,206 | 15 | 5.00/5.0 |
| Alberto | 1 | $8,125 | 89 | 4.89/5.0 |
| Marco | 1 | $5,644 | 47 | 4.94/5.0 |
| David | 1 | $4,692 | 18 | 4.83/5.0 |
| Caterina | 1 | $3,269 | 3 | 5.00/5.0 |
Analyzing the strategies of top hosts, such as their property selection, pricing, and guest communication, can offer valuable lessons for optimizing your own Airbnb operations in Amandola.
Dive Deeper: Advanced Amandola STR Market Data (2025)
Ready to unlock more insights? AirROI provides access to advanced metrics and comprehensive Airbnb data for Amandola. Explore detailed analytics beyond this report to refine your investment strategy, optimize pricing, and maximize your vacation rental profits.
Explore Advanced MetricsAmandola Short-Term Rental Market Composition (2025): Property & Room Types
Room Type Distribution
Property Type Distribution
Market Composition Insights for Amandola
- The Amandola Airbnb market composition is heavily skewed towards Entire Home/Apt listings, which make up 94.4% of the 18 active rentals. This indicates strong guest preference for privacy and space.
- Looking at the property type distribution in Amandola, House properties are the most common (66.7%), reflecting the local real estate landscape.
- Houses represent a significant 66.7% portion, catering likely to families or larger groups.
Amandola Airbnb Room Capacity Analysis (2025): Bedroom Distribution
Distribution of Listings by Number of Bedrooms
Room Capacity Insights for Amandola
- The dominant room capacity in Amandola is 2 bedrooms listings, making up 33.3% of the market. This suggests a strong demand for properties suitable for couples or solo travelers.
- Together, 2 bedrooms and 1 bedroom properties represent 55.5% of the active Airbnb listings in Amandola, indicating a high concentration in these sizes.
- A significant 38.9% of listings offer 3+ bedrooms, catering to larger groups and families seeking more space in Amandola.
Amandola Vacation Rental Guest Capacity Trends (2025)
Distribution of Listings by Guest Capacity
Guest Capacity Insights for Amandola
- The most common guest capacity trend in Amandola vacation rentals is listings accommodating 8+ guests (27.8%). This suggests the primary traveler segment is likely larger groups.
- Properties designed for 8+ guests and 6 guests dominate the Amandola STR market, accounting for 44.5% of listings.
- 44.5% of properties accommodate 6+ guests, serving the market segment for larger families or group travel in Amandola.
- On average, properties in Amandola are equipped to host 5.0 guests.
Amandola Airbnb Booking Patterns (2025): Available vs. Booked Days
Available Days Distribution
Booked Days Distribution
Booking Pattern Insights for Amandola
- The most common availability pattern in Amandola falls within the 271-366 days range, representing 83.3% of listings. This suggests many properties have significant open periods on their calendars.
- Approximately 94.4% of listings show high availability (181+ days open annually), indicating potential for increased bookings or specific owner usage patterns.
- For booked days, the 1-30 days range is most frequent in Amandola (55.6%), reflecting common guest stay durations or potential owner blocking patterns.
- A notable 5.6% of properties secure long booking periods (181+ days booked per year), highlighting successful long-term rental strategies or significant owner usage.
Amandola Airbnb Minimum Stay Requirements Analysis
Distribution of Listings by Minimum Night Requirement
1 Night
2 listings
11.8% of total
2 Nights
3 listings
17.6% of total
3 Nights
1 listings
5.9% of total
4-6 Nights
3 listings
17.6% of total
7-29 Nights
1 listings
5.9% of total
30+ Nights
7 listings
41.2% of total
Key Insights
- The most prevalent minimum stay requirement in Amandola is 30+ Nights, adopted by 41.2% of listings. This highlights the market's preference for longer commitments.
- A significant segment (41.2%) caters to monthly stays (30+ nights) in Amandola, pointing to opportunities in the extended-stay market.
Recommendations
- Align with the market by considering a 30+ Nights minimum stay, as 41.2% of Amandola hosts use this setting.
- If feasible, allowing 1-night stays, especially midweek or during low season, could capture last-minute bookings, as only 11.8% currently do.
- Explore offering discounts for stays of 30+ nights to attract the 41.2% of the market seeking extended stays.
- Adjust minimum nights based on seasonality – potentially shorter during low season and longer during peak demand periods in Amandola.
Amandola Airbnb Cancellation Policy Trends Analysis (2025)
Super Strict 30 Days
1 listings
5.6% of total
Flexible
2 listings
11.1% of total
Moderate
8 listings
44.4% of total
Strict
7 listings
38.9% of total
Cancellation Policy Insights for Amandola
- The prevailing Airbnb cancellation policy trend in Amandola is Moderate, used by 44.4% of listings.
- There's a relatively balanced mix between guest-friendly (55.5%) and stricter (38.9%) policies, offering choices for different guest needs.
Recommendations for Hosts
- Consider adopting a Moderate policy to align with the 44.4% market standard in Amandola.
- With 38.9% using Strict terms, this is a viable option in Amandola, particularly for high-value properties or during peak demand periods.
- Regularly review your cancellation policy against competitors and market demand shifts in Amandola.
Amandola STR Booking Lead Time Analysis (2025)
Average Booking Lead Time by Month
Booking Lead Time Insights for Amandola
- The overall average booking lead time for vacation rentals in Amandola is 47 days.
- Guests book furthest in advance for stays during August (average 73 days), likely coinciding with peak travel demand or local events.
- The shortest booking windows occur for stays in March (average 18 days), indicating more last-minute travel plans during this time.
- Seasonally, Summer (64 days avg.) sees the longest lead times, while Fall (30 days avg.) has the shortest, reflecting typical travel planning cycles.
Recommendations for Hosts
- Use the overall average lead time (47 days) as a baseline for your pricing and availability strategy in Amandola.
- For August stays, consider implementing length-of-stay discounts or slightly higher rates for bookings made less than 73 days out to capitalize on advance planning.
- Target marketing efforts for the Summer season well in advance (at least 64 days) to capture early planners.
- Monitor your own booking lead times against these Amandola averages to identify opportunities for dynamic pricing adjustments.
Popular & Essential Airbnb Amenities in Amandola (2025)
Amenity Prevalence
Amenity Insights for Amandola
- Essential amenities in Amandola that guests expect include: Wifi, Heating. Lacking these (any) could significantly impact bookings.
- Popular amenities like Kitchen, Essentials, Hair dryer are common but not universal. Offering these can provide a competitive edge.
Recommendations for Hosts
- Ensure your listing includes all essential amenities for Amandola: Wifi, Heating.
- Consider adding popular differentiators like Kitchen or Essentials to increase appeal.
- Highlight unique or less common amenities you offer (e.g., hot tub, dedicated workspace, EV charger) in your listing description and photos.
- Regularly check competitor amenities in Amandola to stay competitive.
Amandola Airbnb Guest Demographics & Profile Analysis (2025)
Guest Profile Summary for Amandola
- The typical guest profile for Airbnb in Amandola consists of predominantly international visitors (66%), with top international origins including Germany, typically belonging to the Post-2000s (Gen Z/Alpha) group (50%), primarily speaking English or Italian.
- Domestic travelers account for 34.0% of guests.
- Key international markets include Italy (34%) and Germany (17%).
- Top languages spoken are English (36.4%) followed by Italian (20%).
- A significant demographic segment is the Post-2000s (Gen Z/Alpha) group, representing 50% of guests.
Recommendations for Hosts
- Focus marketing internationally, particularly towards travelers from Germany.
- Tailor amenities and listing descriptions to appeal to the dominant Post-2000s (Gen Z/Alpha) demographic (e.g., highlight fast WiFi, smart home features, local guides).
- Highlight unique local experiences or amenities relevant to the primary guest profile.
- Consider seasonal promotions aligned with peak travel times for key origin markets.
Nearby Short-Term Rental Market Comparison
How does the Amandola Airbnb market stack up against its neighbors? Compare key performance metrics like average monthly revenue, ADR, and occupancy rates in surrounding areas to understand the broader regional STR landscape.
| Market | Active Properties | Monthly Revenue | Daily Rate | Avg. Occupancy |
|---|---|---|---|---|
| Celleno | 15 | $2,913 | $546.77 | 24% |
| Rome | 25,745 | $2,719 | $213.00 | 49% |
| Parrano | 17 | $2,486 | $333.76 | 29% |
| Guardea | 14 | $2,357 | $398.68 | 27% |
| Monteleone d'Orvieto | 35 | $2,332 | $326.37 | 31% |
| Collazzone | 30 | $2,325 | $341.67 | 31% |
| Palombara Sabina | 17 | $2,296 | $316.40 | 33% |
| Collevecchio | 15 | $2,289 | $301.47 | 33% |
| San Leo | 22 | $2,273 | $258.83 | 33% |
| Lugnano in Teverina | 19 | $2,167 | $300.64 | 34% |