Voghera Airbnb Market Analysis 2026: Short Term Rental Data & Vacation Rental Statistics in Lombardy, Italy
Is Airbnb profitable in Voghera in 2026? Explore comprehensive Airbnb analytics for Voghera, Lombardy, Italy to uncover income potential. This 2026 STR market report for Voghera, based on AirROI data from February 2025 to January 2026, reveals key trends in the niche market of 19 active listings.
Whether you're considering an Airbnb investment in Voghera, optimizing your existing vacation rental, or exploring rental arbitrage opportunities, understanding the Voghera Airbnb data is crucial. Navigating the high regulation landscape is key to maximizing your short term rental income potential. Let's dive into the specifics.
Key Voghera Airbnb Performance Metrics Overview
Monthly Airbnb Revenue Variations & Income Potential in Voghera (2026)
Understanding the monthly revenue variations for Airbnb listings in Voghera is key to maximizing your short term rental income potential. Seasonality significantly impacts earnings. Our analysis, based on data from the past 12 months, shows that the peak revenue month for STRs in Voghera is typically May, while November often presents the lowest earnings, highlighting opportunities for strategic pricing adjustments during shoulder and low seasons. Explore the typical Airbnb income in Voghera across different performance tiers:
- Best-in-class properties (Top 10%) achieve $1,867+ monthly, often utilizing dynamic pricing and superior guest experiences.
- Strong performing properties (Top 25%) earn $1,252 or more, indicating effective management and desirable locations/amenities.
- Typical properties (Median) generate around $780 per month, representing the average market performance.
- Entry-level properties (Bottom 25%) see earnings around $422, often with potential for optimization.
Average Monthly Airbnb Earnings Trend in Voghera
Voghera Airbnb Occupancy Rate Trends (2026)
Maximize your bookings by understanding the Voghera STR occupancy trends. Seasonal demand shifts significantly influence how often properties are booked. Typically, Maysees the highest demand (peak season occupancy), while January experiences the lowest (low season). Effective strategies, like adjusting minimum stays or offering promotions, can boost occupancy during slower periods. Here's how different property tiers perform in Voghera:
- Best-in-class properties (Top 10%) achieve 73%+ occupancy, indicating high desirability and potentially optimized availability.
- Strong performing properties (Top 25%) maintain 55% or higher occupancy, suggesting good market fit and guest satisfaction.
- Typical properties (Median) have an occupancy rate around 32%.
- Entry-level properties (Bottom 25%) average 18% occupancy, potentially facing higher vacancy.
Average Monthly Occupancy Rate Trend in Voghera
Average Daily Rate (ADR) Airbnb Trends in Voghera (2026)
Effective short term rental pricing strategy in Voghera involves understanding monthly ADR fluctuations. The Average Daily Rate (ADR) for Airbnb in Voghera typically peaks in January and dips lowest during April. Leveraging Airbnb dynamic pricing tools or strategies based on this seasonality can significantly boost revenue. Here's a look at the typical nightly rates achieved:
- Best-in-class properties (Top 10%) command rates of $132+ per night, often due to premium features or locations.
- Strong performing properties (Top 25%) achieve nightly rates of $90 or more.
- Typical properties (Median) charge around $75 per night.
- Entry-level properties (Bottom 25%) earn around $63 per night.
Average Daily Rate (ADR) Trend by Month in Voghera
Get Live Voghera Market Intelligence 👇

Explore Real-time Analytics
Airbnb Seasonality Analysis & Trends in Voghera (2026)
Peak Season (May, August, July)
- Revenue averages $1,082 per month
- Occupancy rates average 45.1%
- Daily rates average $82
Shoulder Season
- Revenue averages $929 per month
- Occupancy maintains around 36.4%
- Daily rates hold near $108
Low Season (January, June, November)
- Revenue drops to average $766 per month
- Occupancy decreases to average 32.6%
- Daily rates adjust to average $133
Seasonality Insights for Voghera
- The Airbnb seasonality in Voghera shows moderate seasonality with distinct peak and low periods. While the sections above show seasonal averages, it's also insightful to look at the extremes:
- During the high season, the absolute peak month showcases Voghera's highest earning potential, with monthly revenues capable of climbing to $1,206, occupancy reaching a high of 46.9%, and ADRs peaking at $164.
- Conversely, the slowest single month of the year, typically falling within the low season, marks the market's lowest point. In this month, revenue might dip to $737, occupancy could drop to 30.3%, and ADRs may adjust down to $81.
- Understanding both the seasonal averages and these monthly peaks and troughs in revenue, occupancy, and ADR is crucial for maximizing your Airbnb profit potential in Voghera.
Seasonal Strategies for Maximizing Profit
- Peak Season: Maximize revenue through premium pricing and potentially longer minimum stays. Ensure high availability.
- Low Season: Offer competitive pricing, special promotions (e.g., extended stay discounts), and flexible cancellation policies. Target off-season travelers like remote workers or budget-conscious guests.
- Shoulder Seasons: Implement dynamic pricing that balances peak and low rates. Target weekend travelers or specific events. Offer slightly more flexible terms than peak season.
- Regularly analyze your own performance against these Voghera seasonality benchmarks and adjust your pricing and availability strategy accordingly.
Best Areas for Airbnb Investment in Voghera (2026)
Exploring the top neighborhoods for short-term rentals in Voghera? This section highlights key areas, outlining why they are attractive for hosts and guests, along with notable local attractions. Consider these locations based on your target guest profile and investment strategy.
| Neighborhood / Area | Why Host Here? (Target Guests & Appeal) | Key Attractions & Landmarks |
|---|---|---|
| Centro Storico | The historic center of Voghera, with beautiful architecture and charming streets. It attracts tourists interested in culture, history, and local cuisine. | Castello Visconteo, Piazza Meardi, Museo di Storia Naturale, Church of San Lorenzo, Voghera Cathedral |
| Parco della Rimembranza | A green park providing a peaceful retreat in the city. Ideal for those looking to enjoy nature and local outdoor activities. | Walking paths, Children's playground, Picnic areas, Scenic views |
| Voghera Railway Station | Main transport hub for the city, making it convenient for travelers. Close proximity to shops, restaurants, and services. | Shopping centers, Cafés, Transport links to Milan and other cities |
| Local Wine Regions | Surrounding areas of Voghera feature vineyards and wine production. Attracts wine enthusiasts and tourists looking for culinary experiences. | Wine tastings, Vineyard tours, Local agriturismo experiences |
| Piazza del Duomo | Central square where locals gather, surrounded by cafés and shops. Great for people-watching and experiencing local life. | Cafés, Shops, Local events, Seasonal markets |
| Scuola Calcio Voghera | A local sports complex that attracts families and sports enthusiasts. Ideal for guests interested in community events and sports. | Football matches, Youth sports events, Community activities |
| Villaggio dei Fiori | Residential area known for tranquility and greenery, appealing to families and long-term stays. | Parks, Community centers, Local shops |
| Voghera Fairgrounds | Hosts various local events and fairs, making it a hotspot during event seasons. Good for short-term rentals during busy periods. | Local fairs, Concerts, Food festivals |
Understanding Airbnb License Requirements & STR Laws in Voghera (2026)
Yes, Voghera, Lombardy, Italy enforces high STR regulations. Obtaining a license and ensuring compliance is almost certainly required according to current 2026 STR laws. Always verify the latest short term rental regulations and Airbnb license requirements directly with local government authorities for Voghera to ensure full compliance before hosting.
(Source: AirROI data, 2026, based on 95% licensed listings)
Top Performing Airbnb Properties in Voghera (2026)
Benchmark your potential! Explore examples of top-performing Airbnb properties in Vogherabased on Trailing Twelve Month (TTM) revenue. Analyze their characteristics, revenue, occupancy rate, and ADR to understand what drives success in this market.

Camilla's B&B
Private Room • N/A
Garden view apartment, convenient station
Entire Place • 2 bedrooms

Granella Apartment
Entire Place • 2 bedrooms

Gaelle Voghera Apartment
Entire Place • 1 bedroom
Two-room house in the center near the station
Entire Place • 1 bedroom
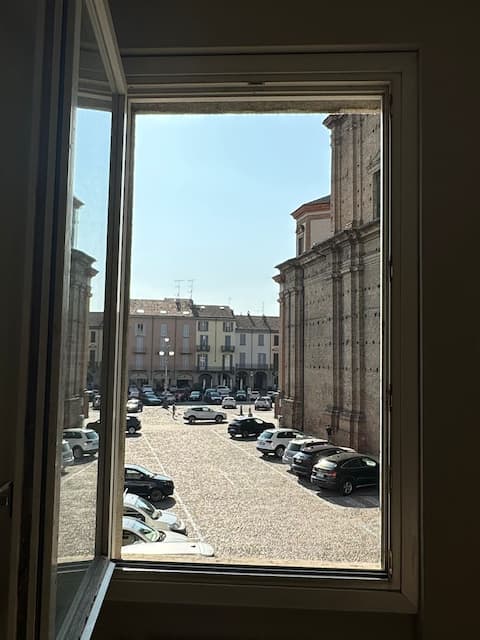
The house on Piazza del Duomo
Entire Place • 1 bedroom
Note: Performance varies based on location, size, amenities, seasonality, and management quality. Data reflects the past 12 months.
Top Performing Airbnb Hosts in Voghera (2026)
Learn from the best! This table showcases top-performing Airbnb hosts in Voghera based on the number of properties managed and estimated total revenue over the past year. Analyze their scale and performance metrics.
| Host Name | Properties | Grossing Revenue | Stay Reviews | Avg Rating |
|---|---|---|---|---|
| Massimo | 3 | $22,894 | 48 | 4.88/5.0 |
| Roberto | 3 | $21,897 | 273 | 4.58/5.0 |
| Camilla | 1 | $20,017 | 2 | Not Rated |
| Laura C | 1 | $16,346 | 59 | 4.63/5.0 |
| Cristina | 1 | $15,962 | 42 | 4.93/5.0 |
| Gaelle | 1 | $14,029 | 27 | 4.52/5.0 |
| Brice | 1 | $10,247 | 26 | 4.73/5.0 |
| Barbara | 1 | $9,876 | 94 | 4.82/5.0 |
| Elza | 1 | $9,831 | 10 | 4.80/5.0 |
| Angélica María | 1 | $8,326 | 23 | 5.00/5.0 |
Analyzing the strategies of top hosts, such as their property selection, pricing, and guest communication, can offer valuable lessons for optimizing your own Airbnb operations in Voghera.
Dive Deeper: Advanced Voghera STR Market Data (2026)
Ready to unlock more insights? AirROI provides access to advanced metrics and comprehensive Airbnb data for Voghera. Explore detailed analytics beyond this report to refine your investment strategy, optimize pricing, and maximize your vacation rental profits.
Explore Advanced MetricsVoghera Short-Term Rental Market Composition (2026): Property & Room Types
Room Type Distribution
Property Type Distribution
Market Composition Insights for Voghera
- The Voghera Airbnb market composition is heavily skewed towards Entire Home/Apt listings, which make up 78.9% of the 19 active rentals. This indicates strong guest preference for privacy and space.
- Looking at the property type distribution in Voghera, Apartment/Condo properties are the most common (73.7%), reflecting the local real estate landscape.
- Houses represent a significant 15.8% portion, catering likely to families or larger groups.
- The presence of 5.3% Hotel/Boutique listings indicates integration with traditional hospitality.
Voghera Airbnb Room Capacity Analysis (2026): Bedroom Distribution
Distribution of Listings by Number of Bedrooms
Room Capacity Insights for Voghera
- The dominant room capacity in Voghera is 1 bedroom listings, making up 57.9% of the market. This suggests a strong demand for properties suitable for couples or solo travelers.
- Together, 1 bedroom and 2 bedrooms properties represent 79.0% of the active Airbnb listings in Voghera, indicating a high concentration in these sizes.
- With over half the market (57.9%) consisting of studios or 1-bedroom units, Voghera is particularly well-suited for individuals or couples.
Voghera Vacation Rental Guest Capacity Trends (2026)
Distribution of Listings by Guest Capacity
Guest Capacity Insights for Voghera
- The most common guest capacity trend in Voghera vacation rentals is listings accommodating 3 guests (21.1%). This suggests the primary traveler segment is likely small families or groups.
- Properties designed for 3 guests and 2 guests dominate the Voghera STR market, accounting for 42.2% of listings.
- 10.5% of properties accommodate 6+ guests, serving the market segment for larger families or group travel in Voghera.
- On average, properties in Voghera are equipped to host 2.9 guests.
Voghera Airbnb Booking Patterns (2026): Available vs. Booked Days
Available Days Distribution
Booked Days Distribution
Booking Pattern Insights for Voghera
- The most common availability pattern in Voghera falls within the 271-366 days range, representing 42.1% of listings. This suggests many properties have significant open periods on their calendars.
- Approximately 84.2% of listings show high availability (181+ days open annually), indicating potential for increased bookings or specific owner usage patterns.
- For booked days, the 91-180 days range is most frequent in Voghera (42.1%), reflecting common guest stay durations or potential owner blocking patterns.
- A notable 21.1% of properties secure long booking periods (181+ days booked per year), highlighting successful long-term rental strategies or significant owner usage.
Voghera Airbnb Minimum Stay Requirements Analysis
Distribution of Listings by Minimum Night Requirement
1 Night
7 listings
36.8% of total
2 Nights
4 listings
21.1% of total
7-29 Nights
2 listings
10.5% of total
30+ Nights
6 listings
31.6% of total
Key Insights
- The most prevalent minimum stay requirement in Voghera is 1 Night, adopted by 36.8% of listings. This highlights the market's preference for shorter, flexible bookings.
- A significant segment (31.6%) caters to monthly stays (30+ nights) in Voghera, pointing to opportunities in the extended-stay market.
Recommendations
- Align with the market by considering a 1 Night minimum stay, as 36.8% of Voghera hosts use this setting.
- Explore offering discounts for stays of 30+ nights to attract the 31.6% of the market seeking extended stays.
- Adjust minimum nights based on seasonality – potentially shorter during low season and longer during peak demand periods in Voghera.
Voghera Airbnb Cancellation Policy Trends Analysis (2026)
Flexible
12 listings
63.2% of total
Moderate
6 listings
31.6% of total
Firm
1 listings
5.3% of total
Cancellation Policy Insights for Voghera
- The prevailing Airbnb cancellation policy trend in Voghera is Flexible, used by 63.2% of listings.
- The market strongly favors guest-friendly terms, with 94.8% of listings offering Flexible or Moderate policies. This suggests guests in Voghera may expect booking flexibility.
Recommendations for Hosts
- Consider adopting a Flexible policy to align with the 63.2% market standard in Voghera.
- Given the high prevalence of Flexible policies (63.2%), offering this can enhance booking appeal, especially during shoulder seasons.
- Regularly review your cancellation policy against competitors and market demand shifts in Voghera.
Voghera STR Booking Lead Time Analysis (2026)
Average Booking Lead Time by Month
Booking Lead Time Insights for Voghera
- The overall average booking lead time for vacation rentals in Voghera is 29 days.
- Guests book furthest in advance for stays during June (average 76 days), likely coinciding with peak travel demand or local events.
- The shortest booking windows occur for stays in February (average 9 days), indicating more last-minute travel plans during this time.
- Seasonally, Summer (48 days avg.) sees the longest lead times, while Fall (18 days avg.) has the shortest, reflecting typical travel planning cycles.
Recommendations for Hosts
- Use the overall average lead time (29 days) as a baseline for your pricing and availability strategy in Voghera.
- For June stays, consider implementing length-of-stay discounts or slightly higher rates for bookings made less than 76 days out to capitalize on advance planning.
- During February, focus on last-minute booking availability and promotions, as guests book with very short notice (9 days avg.).
- Target marketing efforts for the Summer season well in advance (at least 48 days) to capture early planners.
- Monitor your own booking lead times against these Voghera averages to identify opportunities for dynamic pricing adjustments.
Popular & Essential Airbnb Amenities in Voghera (2026)
Amenity Prevalence
Amenity Insights for Voghera
- Popular amenities like TV, Wifi, Kitchen are common but not universal. Offering these can provide a competitive edge.
- Warning: Wifi is not universally provided but is considered essential globally. Ensure reliable Wifi is offered.
Recommendations for Hosts
- Consider adding popular differentiators like TV or Wifi to increase appeal.
- Highlight unique or less common amenities you offer (e.g., hot tub, dedicated workspace, EV charger) in your listing description and photos.
- Regularly check competitor amenities in Voghera to stay competitive.
Voghera Airbnb Guest Demographics & Profile Analysis (2026)
Guest Profile Summary for Voghera
- The typical guest profile for Airbnb in Voghera consists of predominantly international visitors (68%), with top international origins including Germany, typically belonging to the Post-2000s (Gen Z/Alpha) group (50%), primarily speaking English or Italian.
- Domestic travelers account for 32.1% of guests.
- Key international markets include Italy (32.1%) and Germany (16.1%).
- Top languages spoken are English (40%) followed by Italian (15.8%).
- A significant demographic segment is the Post-2000s (Gen Z/Alpha) group, representing 50% of guests.
Recommendations for Hosts
- Focus marketing internationally, particularly towards travelers from Germany.
- Tailor amenities and listing descriptions to appeal to the dominant Post-2000s (Gen Z/Alpha) demographic (e.g., highlight fast WiFi, smart home features, local guides).
- Highlight unique local experiences or amenities relevant to the primary guest profile.
- Consider seasonal promotions aligned with peak travel times for key origin markets.
Nearby Short-Term Rental Market Comparison
How does the Voghera Airbnb market stack up against its neighbors? Compare key performance metrics like average monthly revenue, ADR, and occupancy rates in surrounding areas to understand the broader regional STR landscape.
| Market | Active Properties | Monthly Revenue | Daily Rate | Avg. Occupancy |
|---|---|---|---|---|
| Ranco | 12 | $5,691 | $536.46 | 42% |
| Laglio | 64 | $4,334 | $518.58 | 43% |
| Cassinasco | 19 | $3,887 | $718.39 | 40% |
| Castelfranco di Sotto | 47 | $3,777 | $377.39 | 39% |
| Cossano Belbo | 15 | $3,763 | $326.53 | 36% |
| Portofino | 77 | $3,585 | $509.42 | 38% |
| Bellagio | 461 | $3,466 | $325.87 | 49% |
| Vico Morcote | 12 | $3,347 | $317.07 | 46% |
| Sala Comacina | 73 | $3,332 | $451.20 | 46% |
| Carate Urio | 76 | $3,200 | $362.97 | 41% |