Varese Airbnb Market Analysis 2026: Short Term Rental Data & Vacation Rental Statistics in Lombardy, Italy
Is Airbnb profitable in Varese in 2026? Explore comprehensive Airbnb analytics for Varese, Lombardy, Italy to uncover income potential. This 2026 STR market report for Varese, based on AirROI data from February 2025 to January 2026, reveals key trends in the niche market of 171 active listings.
Whether you're considering an Airbnb investment in Varese, optimizing your existing vacation rental, or exploring rental arbitrage opportunities, understanding the Varese Airbnb data is crucial. Navigating the high regulation landscape is key to maximizing your short term rental income potential. Let's dive into the specifics.
Key Varese Airbnb Performance Metrics Overview
Monthly Airbnb Revenue Variations & Income Potential in Varese (2026)
Understanding the monthly revenue variations for Airbnb listings in Varese is key to maximizing your short term rental income potential. Seasonality significantly impacts earnings. Our analysis, based on data from the past 12 months, shows that the peak revenue month for STRs in Varese is typically August, while January often presents the lowest earnings, highlighting opportunities for strategic pricing adjustments during shoulder and low seasons. Explore the typical Airbnb income in Varese across different performance tiers:
- Best-in-class properties (Top 10%) achieve $2,876+ monthly, often utilizing dynamic pricing and superior guest experiences.
- Strong performing properties (Top 25%) earn $1,913 or more, indicating effective management and desirable locations/amenities.
- Typical properties (Median) generate around $1,203 per month, representing the average market performance.
- Entry-level properties (Bottom 25%) see earnings around $602, often with potential for optimization.
Average Monthly Airbnb Earnings Trend in Varese
Varese Airbnb Occupancy Rate Trends (2026)
Maximize your bookings by understanding the Varese STR occupancy trends. Seasonal demand shifts significantly influence how often properties are booked. Typically, Aprilsees the highest demand (peak season occupancy), while January experiences the lowest (low season). Effective strategies, like adjusting minimum stays or offering promotions, can boost occupancy during slower periods. Here's how different property tiers perform in Varese:
- Best-in-class properties (Top 10%) achieve 79%+ occupancy, indicating high desirability and potentially optimized availability.
- Strong performing properties (Top 25%) maintain 61% or higher occupancy, suggesting good market fit and guest satisfaction.
- Typical properties (Median) have an occupancy rate around 39%.
- Entry-level properties (Bottom 25%) average 20% occupancy, potentially facing higher vacancy.
Average Monthly Occupancy Rate Trend in Varese
Average Daily Rate (ADR) Airbnb Trends in Varese (2026)
Effective short term rental pricing strategy in Varese involves understanding monthly ADR fluctuations. The Average Daily Rate (ADR) for Airbnb in Varese typically peaks in January and dips lowest during February. Leveraging Airbnb dynamic pricing tools or strategies based on this seasonality can significantly boost revenue. Here's a look at the typical nightly rates achieved:
- Best-in-class properties (Top 10%) command rates of $182+ per night, often due to premium features or locations.
- Strong performing properties (Top 25%) achieve nightly rates of $131 or more.
- Typical properties (Median) charge around $94 per night.
- Entry-level properties (Bottom 25%) earn around $75 per night.
Average Daily Rate (ADR) Trend by Month in Varese
Get Live Varese Market Intelligence 👇

Explore Real-time Analytics
Airbnb Seasonality Analysis & Trends in Varese (2026)
Peak Season (August, July, April)
- Revenue averages $1,918 per month
- Occupancy rates average 49.8%
- Daily rates average $124
Shoulder Season
- Revenue averages $1,480 per month
- Occupancy maintains around 41.4%
- Daily rates hold near $128
Low Season (January, February, November)
- Revenue drops to average $1,073 per month
- Occupancy decreases to average 33.0%
- Daily rates adjust to average $130
Seasonality Insights for Varese
- The Airbnb seasonality in Varese shows moderate seasonality with distinct peak and low periods. While the sections above show seasonal averages, it's also insightful to look at the extremes:
- During the high season, the absolute peak month showcases Varese's highest earning potential, with monthly revenues capable of climbing to $1,939, occupancy reaching a high of 50.4%, and ADRs peaking at $142.
- Conversely, the slowest single month of the year, typically falling within the low season, marks the market's lowest point. In this month, revenue might dip to $962, occupancy could drop to 26.5%, and ADRs may adjust down to $118.
- Understanding both the seasonal averages and these monthly peaks and troughs in revenue, occupancy, and ADR is crucial for maximizing your Airbnb profit potential in Varese.
Seasonal Strategies for Maximizing Profit
- Peak Season: Maximize revenue through premium pricing and potentially longer minimum stays. Ensure high availability.
- Low Season: Offer competitive pricing, special promotions (e.g., extended stay discounts), and flexible cancellation policies. Target off-season travelers like remote workers or budget-conscious guests.
- Shoulder Seasons: Implement dynamic pricing that balances peak and low rates. Target weekend travelers or specific events. Offer slightly more flexible terms than peak season.
- Regularly analyze your own performance against these Varese seasonality benchmarks and adjust your pricing and availability strategy accordingly.
Best Areas for Airbnb Investment in Varese (2026)
Exploring the top neighborhoods for short-term rentals in Varese? This section highlights key areas, outlining why they are attractive for hosts and guests, along with notable local attractions. Consider these locations based on your target guest profile and investment strategy.
| Neighborhood / Area | Why Host Here? (Target Guests & Appeal) | Key Attractions & Landmarks |
|---|---|---|
| Centro Storico | The historic city center of Varese is filled with beautiful architecture and charming streets. It's a prime area for tourists looking to explore local culture, shops, and dining. | Palazzo Estense, Basilica di San Vittore, Piazza della Motta, Parco di Villa Panza, Museo della Tecnica Elettrica |
| Sacro Monte di Varese | A UNESCO World Heritage site, this area features stunning chapels and panoramic views. It's a spiritual and cultural destination attracting visitors interested in history and natural beauty. | Chiesa di Santa Maria del Monte, Parco Regionale Campo dei Fiori, Panoramic views of Lake Varese, Pilgrimage route, Hiking trails |
| Lago di Varese | The lake area offers scenic waterfront views and recreational activities like boating and cycling. It's a relaxing retreat for families and outdoor enthusiasts. | Lake Varese, Water sports, Cycle path around the lake, Picnic areas, Bird watching |
| Biumo | A residential neighborhood with easy access to the city center. Great for families visiting Varese as it offers quiet streets and local amenities. | Local parks, Family-friendly cafes, Proximity to schools and shops, Community feel, Quiet atmosphere |
| Masnago | Known for its historic castle and surrounding park. This area attracts visitors interested in art and history with a beautiful landscape. | Castello di Masnago, Museo d'Arte, Local parks, Walking trails, Art exhibitions |
| Casbeno | A picturesque neighborhood ideal for those looking for a quiet stay. Close to the city center yet removed from the hustle and bustle. | Charming streets, Local markets, Community parks, Proximity to attractions, Relaxed pace |
| Ghirla | A small town near the lake, perfect for those who enjoy nature and tranquility. It appeals to visitors looking for a peaceful retreat in the countryside. | Lake Ghirla, Nature walks, Scenic views, Small village charm, Hiking paths |
| Buguggiate | A charming town a short distance from Varese, known for its historic buildings and local lifestyle. Ideal for guests wanting a taste of local culture. | Historical architecture, Local festivals, Proximity to Varese, Quiet streets, Community events |
Understanding Airbnb License Requirements & STR Laws in Varese (2026)
Yes, Varese, Lombardy, Italy enforces high STR regulations. Obtaining a license and ensuring compliance is almost certainly required according to current 2026 STR laws. Always verify the latest short term rental regulations and Airbnb license requirements directly with local government authorities for Varese to ensure full compliance before hosting.
(Source: AirROI data, 2026, based on 88% licensed listings)
Top Performing Airbnb Properties in Varese (2026)
Benchmark your potential! Explore examples of top-performing Airbnb properties in Varesebased on Trailing Twelve Month (TTM) revenue. Analyze their characteristics, revenue, occupancy rate, and ADR to understand what drives success in this market.
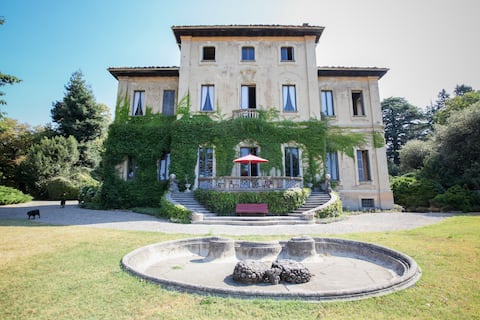
VILLA NONARO
Entire Place • 8 bedrooms

Varese Retreat: Your Home Away from Home
Entire Place • 3 bedrooms
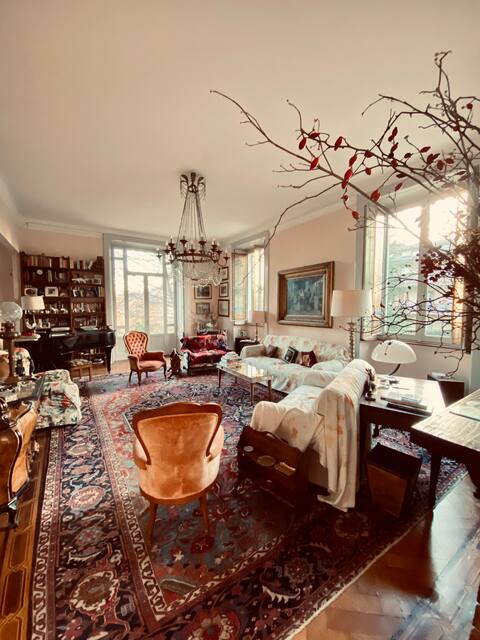
Private wing in Liberty villa with park
Private Room • 4 bedrooms

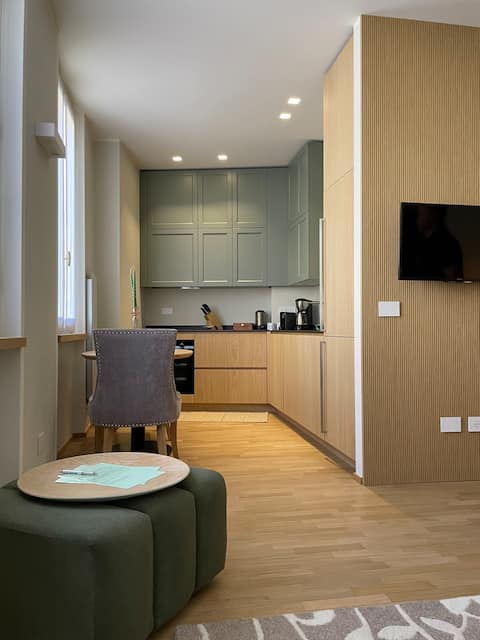
Varese Center - Elegant Apartment in the Center
Entire Place • 1 bedroom

Elegant apartment with private parking
Entire Place • 1 bedroom
Varese Cozy Stay
Entire Place • 1 bedroom
Note: Performance varies based on location, size, amenities, seasonality, and management quality. Data reflects the past 12 months.
Top Performing Airbnb Hosts in Varese (2026)
Learn from the best! This table showcases top-performing Airbnb hosts in Varese based on the number of properties managed and estimated total revenue over the past year. Analyze their scale and performance metrics.
| Host Name | Properties | Grossing Revenue | Stay Reviews | Avg Rating |
|---|---|---|---|---|
| Kibilù Agenzia Affitti Brevi | 17 | $187,507 | 82 | 4.28/5.0 |
| Gabriele | 17 | $147,119 | 677 | 4.78/5.0 |
| Valentina | 4 | $114,035 | 645 | 4.98/5.0 |
| David | 8 | $100,558 | 251 | 4.72/5.0 |
| Rita | 2 | $97,515 | 56 | 4.93/5.0 |
| Freehome | 4 | $63,322 | 40 | 4.83/5.0 |
| Denise | 1 | $60,762 | 42 | 4.95/5.0 |
| Alice&Alberto | 2 | $58,699 | 45 | 5.00/5.0 |
| Alessio | 2 | $56,003 | 58 | 4.91/5.0 |
| BelSorrisoVarese - Rooms & Apa | 8 | $53,987 | 52 | 4.81/5.0 |
Analyzing the strategies of top hosts, such as their property selection, pricing, and guest communication, can offer valuable lessons for optimizing your own Airbnb operations in Varese.
Dive Deeper: Advanced Varese STR Market Data (2026)
Ready to unlock more insights? AirROI provides access to advanced metrics and comprehensive Airbnb data for Varese. Explore detailed analytics beyond this report to refine your investment strategy, optimize pricing, and maximize your vacation rental profits.
Explore Advanced MetricsVarese Short-Term Rental Market Composition (2026): Property & Room Types
Room Type Distribution
Property Type Distribution
Market Composition Insights for Varese
- The Varese Airbnb market composition is heavily skewed towards Entire Home/Apt listings, which make up 80.1% of the 171 active rentals. This indicates strong guest preference for privacy and space.
- Looking at the property type distribution in Varese, Apartment/Condo properties are the most common (74.9%), reflecting the local real estate landscape.
- Houses represent a significant 17% portion, catering likely to families or larger groups.
- The presence of 5.8% Hotel/Boutique listings indicates integration with traditional hospitality.
- Smaller segments like outdoor/unique, others (combined 2.4%) offer potential for unique stay experiences.
Varese Airbnb Room Capacity Analysis (2026): Bedroom Distribution
Distribution of Listings by Number of Bedrooms
Room Capacity Insights for Varese
- The dominant room capacity in Varese is 1 bedroom listings, making up 55% of the market. This suggests a strong demand for properties suitable for couples or solo travelers.
- Together, 1 bedroom and 2 bedrooms properties represent 73.1% of the active Airbnb listings in Varese, indicating a high concentration in these sizes.
- With over half the market (55%) consisting of studios or 1-bedroom units, Varese is particularly well-suited for individuals or couples.
- Listings with 3+ bedrooms (8.8%) represent a smaller niche, potentially indicating an underserved market for larger group accommodations in Varese.
Varese Vacation Rental Guest Capacity Trends (2026)
Distribution of Listings by Guest Capacity
Guest Capacity Insights for Varese
- The most common guest capacity trend in Varese vacation rentals is listings accommodating 2 guests (26.9%). This suggests the primary traveler segment is likely couples or solo travelers.
- Properties designed for 2 guests and 4 guests dominate the Varese STR market, accounting for 52.6% of listings.
- 12.9% of properties accommodate 6+ guests, serving the market segment for larger families or group travel in Varese.
- On average, properties in Varese are equipped to host 3.2 guests.
Varese Airbnb Booking Patterns (2026): Available vs. Booked Days
Available Days Distribution
Booked Days Distribution
Booking Pattern Insights for Varese
- The most common availability pattern in Varese falls within the 271-366 days range, representing 50.3% of listings. This suggests many properties have significant open periods on their calendars.
- Approximately 80.1% of listings show high availability (181+ days open annually), indicating potential for increased bookings or specific owner usage patterns.
- For booked days, the 91-180 days range is most frequent in Varese (31%), reflecting common guest stay durations or potential owner blocking patterns.
- A notable 20.5% of properties secure long booking periods (181+ days booked per year), highlighting successful long-term rental strategies or significant owner usage.
Varese Airbnb Minimum Stay Requirements Analysis
Distribution of Listings by Minimum Night Requirement
1 Night
45 listings
26.3% of total
2 Nights
45 listings
26.3% of total
3 Nights
9 listings
5.3% of total
4-6 Nights
6 listings
3.5% of total
7-29 Nights
9 listings
5.3% of total
30+ Nights
57 listings
33.3% of total
Key Insights
- The most prevalent minimum stay requirement in Varese is 30+ Nights, adopted by 33.3% of listings. This highlights the market's preference for longer commitments.
- A significant segment (33.3%) caters to monthly stays (30+ nights) in Varese, pointing to opportunities in the extended-stay market.
Recommendations
- Align with the market by considering a 30+ Nights minimum stay, as 33.3% of Varese hosts use this setting.
- If feasible, allowing 1-night stays, especially midweek or during low season, could capture last-minute bookings, as only 26.3% currently do.
- Explore offering discounts for stays of 30+ nights to attract the 33.3% of the market seeking extended stays.
- Adjust minimum nights based on seasonality – potentially shorter during low season and longer during peak demand periods in Varese.
Varese Airbnb Cancellation Policy Trends Analysis (2026)
Limited
2 listings
1.2% of total
Super Strict 30 Days
1 listings
0.6% of total
Flexible
67 listings
39.4% of total
Moderate
92 listings
54.1% of total
Firm
5 listings
2.9% of total
Strict
3 listings
1.8% of total
Cancellation Policy Insights for Varese
- The prevailing Airbnb cancellation policy trend in Varese is Moderate, used by 54.1% of listings.
- The market strongly favors guest-friendly terms, with 93.5% of listings offering Flexible or Moderate policies. This suggests guests in Varese may expect booking flexibility.
- Strict cancellation policies are quite rare (1.8%), potentially making listings with this policy less competitive unless justified by high demand or property type.
Recommendations for Hosts
- Consider adopting a Moderate policy to align with the 54.1% market standard in Varese.
- Using a Strict policy might deter some guests, as only 1.8% of listings use it. Evaluate if potential revenue protection outweighs possible lower booking rates.
- Regularly review your cancellation policy against competitors and market demand shifts in Varese.
Varese STR Booking Lead Time Analysis (2026)
Average Booking Lead Time by Month
Booking Lead Time Insights for Varese
- The overall average booking lead time for vacation rentals in Varese is 43 days.
- Guests book furthest in advance for stays during August (average 63 days), likely coinciding with peak travel demand or local events.
- The shortest booking windows occur for stays in February (average 15 days), indicating more last-minute travel plans during this time.
- Seasonally, Summer (52 days avg.) sees the longest lead times, while Winter (29 days avg.) has the shortest, reflecting typical travel planning cycles.
Recommendations for Hosts
- Use the overall average lead time (43 days) as a baseline for your pricing and availability strategy in Varese.
- For August stays, consider implementing length-of-stay discounts or slightly higher rates for bookings made less than 63 days out to capitalize on advance planning.
- Target marketing efforts for the Summer season well in advance (at least 52 days) to capture early planners.
- Monitor your own booking lead times against these Varese averages to identify opportunities for dynamic pricing adjustments.
Popular & Essential Airbnb Amenities in Varese (2026)
Amenity Prevalence
Amenity Insights for Varese
- Essential amenities in Varese that guests expect include: Heating, Wifi. Lacking these (any) could significantly impact bookings.
- Popular amenities like Hot water, Hair dryer, Hangers are common but not universal. Offering these can provide a competitive edge.
Recommendations for Hosts
- Ensure your listing includes all essential amenities for Varese: Heating, Wifi.
- Prioritize adding missing essentials: Heating, Wifi.
- Consider adding popular differentiators like Hot water or Hair dryer to increase appeal.
- Highlight unique or less common amenities you offer (e.g., hot tub, dedicated workspace, EV charger) in your listing description and photos.
- Regularly check competitor amenities in Varese to stay competitive.
Varese Airbnb Guest Demographics & Profile Analysis (2026)
Guest Profile Summary for Varese
- The typical guest profile for Airbnb in Varese consists of predominantly international visitors (81%), with top international origins including Italy, typically belonging to the Post-2000s (Gen Z/Alpha) group (50%), primarily speaking English or French.
- Domestic travelers account for 19.3% of guests.
- Key international markets include France (20.9%) and Italy (19.3%).
- Top languages spoken are English (34.3%) followed by French (14.8%).
- A significant demographic segment is the Post-2000s (Gen Z/Alpha) group, representing 50% of guests.
Recommendations for Hosts
- Focus marketing internationally, particularly towards travelers from Italy.
- Tailor amenities and listing descriptions to appeal to the dominant Post-2000s (Gen Z/Alpha) demographic (e.g., highlight fast WiFi, smart home features, local guides).
- Highlight unique local experiences or amenities relevant to the primary guest profile.
- Consider seasonal promotions aligned with peak travel times for key origin markets.
Nearby Short-Term Rental Market Comparison
How does the Varese Airbnb market stack up against its neighbors? Compare key performance metrics like average monthly revenue, ADR, and occupancy rates in surrounding areas to understand the broader regional STR landscape.
| Market | Active Properties | Monthly Revenue | Daily Rate | Avg. Occupancy |
|---|---|---|---|---|
| Brienzwiler | 11 | $7,335 | $514.27 | 60% |
| Niederried bei Interlaken | 19 | $6,267 | $552.03 | 44% |
| Lauterbrunnen | 552 | $6,108 | $487.83 | 51% |
| Ranco | 12 | $5,691 | $536.46 | 42% |
| Matten bei Interlaken | 64 | $5,607 | $336.51 | 59% |
| Grindelwald | 513 | $5,587 | $396.62 | 56% |
| Monteu Roero | 12 | $5,184 | $403.07 | 41% |
| Wengen | 12 | $5,115 | $595.38 | 46% |
| Oberhofen am Thunersee | 25 | $5,051 | $329.28 | 51% |
| Zermatt | 792 | $5,017 | $504.14 | 46% |