San Bartolomeo al Mare Airbnb Market Analysis 2026: Short Term Rental Data & Vacation Rental Statistics in Liguria, Italy
Is Airbnb profitable in San Bartolomeo al Mare in 2026? Explore comprehensive Airbnb analytics for San Bartolomeo al Mare, Liguria, Italy to uncover income potential. This 2026 STR market report for San Bartolomeo al Mare, based on AirROI data from February 2025 to January 2026, reveals key trends in the niche market of 84 active listings.
Whether you're considering an Airbnb investment in San Bartolomeo al Mare, optimizing your existing vacation rental, or exploring rental arbitrage opportunities, understanding the San Bartolomeo al Mare Airbnb data is crucial. Navigating the high regulation landscape is key to maximizing your short term rental income potential. Let's dive into the specifics.
Key San Bartolomeo al Mare Airbnb Performance Metrics Overview
Monthly Airbnb Revenue Variations & Income Potential in San Bartolomeo al Mare (2026)
Understanding the monthly revenue variations for Airbnb listings in San Bartolomeo al Mare is key to maximizing your short term rental income potential. Seasonality significantly impacts earnings. Our analysis, based on data from the past 12 months, shows that the peak revenue month for STRs in San Bartolomeo al Mare is typically August, while January often presents the lowest earnings, highlighting opportunities for strategic pricing adjustments during shoulder and low seasons. Explore the typical Airbnb income in San Bartolomeo al Mare across different performance tiers:
- Best-in-class properties (Top 10%) achieve $2,536+ monthly, often utilizing dynamic pricing and superior guest experiences.
- Strong performing properties (Top 25%) earn $1,736 or more, indicating effective management and desirable locations/amenities.
- Typical properties (Median) generate around $1,037 per month, representing the average market performance.
- Entry-level properties (Bottom 25%) see earnings around $523, often with potential for optimization.
Average Monthly Airbnb Earnings Trend in San Bartolomeo al Mare
San Bartolomeo al Mare Airbnb Occupancy Rate Trends (2026)
Maximize your bookings by understanding the San Bartolomeo al Mare STR occupancy trends. Seasonal demand shifts significantly influence how often properties are booked. Typically, Augustsees the highest demand (peak season occupancy), while January experiences the lowest (low season). Effective strategies, like adjusting minimum stays or offering promotions, can boost occupancy during slower periods. Here's how different property tiers perform in San Bartolomeo al Mare:
- Best-in-class properties (Top 10%) achieve 58%+ occupancy, indicating high desirability and potentially optimized availability.
- Strong performing properties (Top 25%) maintain 40% or higher occupancy, suggesting good market fit and guest satisfaction.
- Typical properties (Median) have an occupancy rate around 26%.
- Entry-level properties (Bottom 25%) average 14% occupancy, potentially facing higher vacancy.
Average Monthly Occupancy Rate Trend in San Bartolomeo al Mare
Average Daily Rate (ADR) Airbnb Trends in San Bartolomeo al Mare (2026)
Effective short term rental pricing strategy in San Bartolomeo al Mare involves understanding monthly ADR fluctuations. The Average Daily Rate (ADR) for Airbnb in San Bartolomeo al Mare typically peaks in August and dips lowest during February. Leveraging Airbnb dynamic pricing tools or strategies based on this seasonality can significantly boost revenue. Here's a look at the typical nightly rates achieved:
- Best-in-class properties (Top 10%) command rates of $213+ per night, often due to premium features or locations.
- Strong performing properties (Top 25%) achieve nightly rates of $154 or more.
- Typical properties (Median) charge around $117 per night.
- Entry-level properties (Bottom 25%) earn around $94 per night.
Average Daily Rate (ADR) Trend by Month in San Bartolomeo al Mare
Get Live San Bartolomeo al Mare Market Intelligence 👇

Explore Real-time Analytics
Airbnb Seasonality Analysis & Trends in San Bartolomeo al Mare (2026)
Peak Season (August, July, September)
- Revenue averages $2,776 per month
- Occupancy rates average 51.2%
- Daily rates average $153
Shoulder Season
- Revenue averages $962 per month
- Occupancy maintains around 25.0%
- Daily rates hold near $139
Low Season (January, February, March)
- Revenue drops to average $574 per month
- Occupancy decreases to average 18.4%
- Daily rates adjust to average $133
Seasonality Insights for San Bartolomeo al Mare
- The Airbnb seasonality in San Bartolomeo al Mare shows highly seasonal trends requiring careful strategy. While the sections above show seasonal averages, it's also insightful to look at the extremes:
- During the high season, the absolute peak month showcases San Bartolomeo al Mare's highest earning potential, with monthly revenues capable of climbing to $3,760, occupancy reaching a high of 61.6%, and ADRs peaking at $165.
- Conversely, the slowest single month of the year, typically falling within the low season, marks the market's lowest point. In this month, revenue might dip to $401, occupancy could drop to 10.8%, and ADRs may adjust down to $128.
- Understanding both the seasonal averages and these monthly peaks and troughs in revenue, occupancy, and ADR is crucial for maximizing your Airbnb profit potential in San Bartolomeo al Mare.
Seasonal Strategies for Maximizing Profit
- Peak Season: Maximize revenue through premium pricing and potentially longer minimum stays. Ensure high availability.
- Low Season: Offer competitive pricing, special promotions (e.g., extended stay discounts), and flexible cancellation policies. Target off-season travelers like remote workers or budget-conscious guests.
- Shoulder Seasons: Implement dynamic pricing that balances peak and low rates. Target weekend travelers or specific events. Offer slightly more flexible terms than peak season.
- Regularly analyze your own performance against these San Bartolomeo al Mare seasonality benchmarks and adjust your pricing and availability strategy accordingly.
Best Areas for Airbnb Investment in San Bartolomeo al Mare (2026)
Exploring the top neighborhoods for short-term rentals in San Bartolomeo al Mare? This section highlights key areas, outlining why they are attractive for hosts and guests, along with notable local attractions. Consider these locations based on your target guest profile and investment strategy.
| Neighborhood / Area | Why Host Here? (Target Guests & Appeal) | Key Attractions & Landmarks |
|---|---|---|
| Lungomare | The picturesque promenade along the sea, known for its stunning views, beach access, and vibrant atmosphere. Ideal for vacationers looking for a relaxing beach holiday. | San Bartolomeo al Mare beaches, Pista Ciclabile del Parco Costiero, Gelateria Leist, Chiesa di San Bartolomeo, local seafood restaurants |
| Historic Center | The charming old town area featuring narrow streets, local shops, and historical landmarks. Great for travelers interested in culture, history, and authentic Italian experiences. | Villa Grock, Chiesa di San Giovanni Battista, Piazza della Vittoria, Museo della Comunicazione, local artisan shops |
| Porto | The vibrant port area with waterfront dining and beautiful views of the marina. Attractive to tourists seeking both relaxation and activities on the water. | Porto di San Bartolomeo, yachting and boating activities, waterfront cafes, fishing spots, boat rentals |
| Ciclabile | A beautiful bike path that runs along the coast, perfect for outdoor enthusiasts and families. Offers a unique way to explore the area while enjoying the fresh sea air. | Ciclabile dei Fiori, beach access, park areas, stunning coastal views, biking and walking paths |
| Local Vineyards | The surrounding hills are home to wonderful vineyards producing local wines. Attracts wine lovers and those interested in agrotourism and tastings. | Wine tastings, vineyard tours, local winery events, culinary experiences, scenic views |
| Nearby Markets | Local markets full of fresh produce, crafts, and local delicacies. Great for visitors wanting to indulge in local culture and cuisine. | Mercato di Diano Marina, fresh produce stands, artisan craft stalls, local delicacies, cooking classes |
| Family-friendly Areas | Areas particularly suited for families with children, offering kid-friendly activities and attractions. Popular for vacationing families. | playgrounds, family-friendly beaches, water parks nearby, children's activities, family dining options |
| Cultural Festivals | The region hosts various cultural and culinary festivals throughout the year, attracting visitors interested in local traditions and festivities. | San Bartolomeo Festival, local food festivals, music events, art exhibitions, cultural workshops |
Understanding Airbnb License Requirements & STR Laws in San Bartolomeo al Mare (2026)
Yes, San Bartolomeo al Mare, Liguria, Italy enforces high STR regulations. Obtaining a license and ensuring compliance is almost certainly required according to current 2026 STR laws. Always verify the latest short term rental regulations and Airbnb license requirements directly with local government authorities for San Bartolomeo al Mare to ensure full compliance before hosting.
(Source: AirROI data, 2026, based on 82% licensed listings)
Top Performing Airbnb Properties in San Bartolomeo al Mare (2026)
Benchmark your potential! Explore examples of top-performing Airbnb properties in San Bartolomeo al Marebased on Trailing Twelve Month (TTM) revenue. Analyze their characteristics, revenue, occupancy rate, and ADR to understand what drives success in this market.
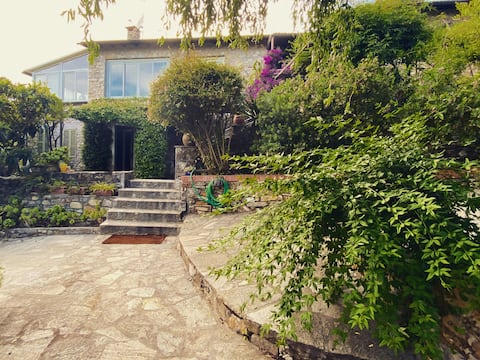
Garden villa in San Simone - Cervo
Entire Place • 3 bedrooms

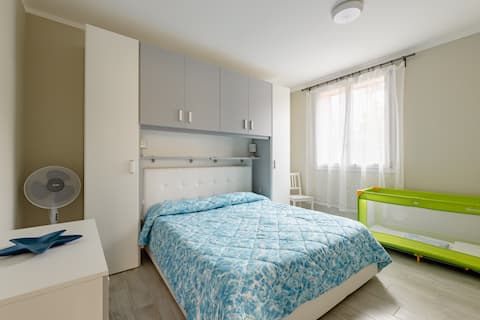
Casa Margherita di Morena Vacation Homes
Entire Place • 1 bedroom

Small residence by the sea
Entire Place • 1 bedroom
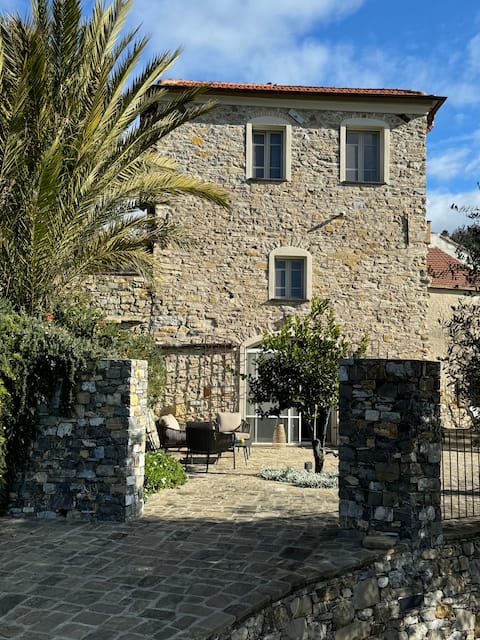
Beautiful oil mill with fantastic sea views
Entire Place • 4 bedrooms
Laura al mare
Entire Place • 1 bedroom

Beach front apartment
Entire Place • 1 bedroom
Note: Performance varies based on location, size, amenities, seasonality, and management quality. Data reflects the past 12 months.
Top Performing Airbnb Hosts in San Bartolomeo al Mare (2026)
Learn from the best! This table showcases top-performing Airbnb hosts in San Bartolomeo al Mare based on the number of properties managed and estimated total revenue over the past year. Analyze their scale and performance metrics.
| Host Name | Properties | Grossing Revenue | Stay Reviews | Avg Rating |
|---|---|---|---|---|
| Italianway | 3 | $39,582 | 18 | 3.84/5.0 |
| Nicola | 1 | $38,954 | 75 | 4.80/5.0 |
| Morena Casa Vacanza | 1 | $38,595 | 14 | 4.93/5.0 |
| Roxana | 2 | $36,789 | 30 | 4.88/5.0 |
| Monica | 2 | $31,751 | 40 | 4.97/5.0 |
| Sandra - Interhome | 6 | $28,998 | 15 | 4.63/5.0 |
| Mauro | 1 | $27,024 | 47 | 4.91/5.0 |
| Angela Maria | 2 | $26,058 | 44 | 4.84/5.0 |
| Simone | 1 | $25,934 | 3 | 5.00/5.0 |
| Novasol | 1 | $24,654 | 4 | 3.25/5.0 |
Analyzing the strategies of top hosts, such as their property selection, pricing, and guest communication, can offer valuable lessons for optimizing your own Airbnb operations in San Bartolomeo al Mare.
Dive Deeper: Advanced San Bartolomeo al Mare STR Market Data (2026)
Ready to unlock more insights? AirROI provides access to advanced metrics and comprehensive Airbnb data for San Bartolomeo al Mare. Explore detailed analytics beyond this report to refine your investment strategy, optimize pricing, and maximize your vacation rental profits.
Explore Advanced MetricsSan Bartolomeo al Mare Short-Term Rental Market Composition (2026): Property & Room Types
Room Type Distribution
Property Type Distribution
Market Composition Insights for San Bartolomeo al Mare
- The San Bartolomeo al Mare Airbnb market composition is heavily skewed towards Entire Home/Apt listings, which make up 98.8% of the 84 active rentals. This indicates strong guest preference for privacy and space.
- Looking at the property type distribution in San Bartolomeo al Mare, Apartment/Condo properties are the most common (90.5%), reflecting the local real estate landscape.
San Bartolomeo al Mare Airbnb Room Capacity Analysis (2026): Bedroom Distribution
Distribution of Listings by Number of Bedrooms
Room Capacity Insights for San Bartolomeo al Mare
- The dominant room capacity in San Bartolomeo al Mare is 1 bedroom listings, making up 51.2% of the market. This suggests a strong demand for properties suitable for couples or solo travelers.
- Together, 1 bedroom and 2 bedrooms properties represent 90.5% of the active Airbnb listings in San Bartolomeo al Mare, indicating a high concentration in these sizes.
- With over half the market (51.2%) consisting of studios or 1-bedroom units, San Bartolomeo al Mare is particularly well-suited for individuals or couples.
- Listings with 3+ bedrooms (3.6%) represent a smaller niche, potentially indicating an underserved market for larger group accommodations in San Bartolomeo al Mare.
San Bartolomeo al Mare Vacation Rental Guest Capacity Trends (2026)
Distribution of Listings by Guest Capacity
Guest Capacity Insights for San Bartolomeo al Mare
- The most common guest capacity trend in San Bartolomeo al Mare vacation rentals is listings accommodating 4 guests (53.6%). This suggests the primary traveler segment is likely small families or groups.
- Properties designed for 4 guests and 6 guests dominate the San Bartolomeo al Mare STR market, accounting for 73.8% of listings.
- 23.8% of properties accommodate 6+ guests, serving the market segment for larger families or group travel in San Bartolomeo al Mare.
- On average, properties in San Bartolomeo al Mare are equipped to host 4.4 guests.
San Bartolomeo al Mare Airbnb Booking Patterns (2026): Available vs. Booked Days
Available Days Distribution
Booked Days Distribution
Booking Pattern Insights for San Bartolomeo al Mare
- The most common availability pattern in San Bartolomeo al Mare falls within the 271-366 days range, representing 78.6% of listings. This suggests many properties have significant open periods on their calendars.
- Approximately 98.8% of listings show high availability (181+ days open annually), indicating potential for increased bookings or specific owner usage patterns.
- For booked days, the 31-90 days range is most frequent in San Bartolomeo al Mare (44%), reflecting common guest stay durations or potential owner blocking patterns.
- A notable 2.4% of properties secure long booking periods (181+ days booked per year), highlighting successful long-term rental strategies or significant owner usage.
San Bartolomeo al Mare Airbnb Minimum Stay Requirements Analysis
Distribution of Listings by Minimum Night Requirement
2 Nights
8 listings
9.5% of total
3 Nights
4 listings
4.8% of total
4-6 Nights
17 listings
20.2% of total
7-29 Nights
3 listings
3.6% of total
30+ Nights
52 listings
61.9% of total
Key Insights
- The most prevalent minimum stay requirement in San Bartolomeo al Mare is 30+ Nights, adopted by 61.9% of listings. This highlights the market's preference for longer commitments.
- Very short stays (1-2 nights) are less common (9.5%), suggesting hosts prefer slightly longer bookings to optimize turnover.
- A significant segment (61.9%) caters to monthly stays (30+ nights) in San Bartolomeo al Mare, pointing to opportunities in the extended-stay market.
Recommendations
- Align with the market by considering a 30+ Nights minimum stay, as 61.9% of San Bartolomeo al Mare hosts use this setting.
- Explore offering discounts for stays of 30+ nights to attract the 61.9% of the market seeking extended stays.
- Adjust minimum nights based on seasonality – potentially shorter during low season and longer during peak demand periods in San Bartolomeo al Mare.
San Bartolomeo al Mare Airbnb Cancellation Policy Trends Analysis (2026)
Super Strict 60 Days
3 listings
3.6% of total
Limited
1 listings
1.2% of total
Super Strict 30 Days
4 listings
4.8% of total
Flexible
13 listings
15.5% of total
Moderate
29 listings
34.5% of total
Firm
21 listings
25% of total
Strict
13 listings
15.5% of total
Cancellation Policy Insights for San Bartolomeo al Mare
- The prevailing Airbnb cancellation policy trend in San Bartolomeo al Mare is Moderate, used by 34.5% of listings.
- There's a relatively balanced mix between guest-friendly (50.0%) and stricter (40.5%) policies, offering choices for different guest needs.
Recommendations for Hosts
- Consider adopting a Moderate policy to align with the 34.5% market standard in San Bartolomeo al Mare.
- Regularly review your cancellation policy against competitors and market demand shifts in San Bartolomeo al Mare.
San Bartolomeo al Mare STR Booking Lead Time Analysis (2026)
Average Booking Lead Time by Month
Booking Lead Time Insights for San Bartolomeo al Mare
- The overall average booking lead time for vacation rentals in San Bartolomeo al Mare is 52 days.
- Guests book furthest in advance for stays during August (average 99 days), likely coinciding with peak travel demand or local events.
- The shortest booking windows occur for stays in March (average 11 days), indicating more last-minute travel plans during this time.
- Seasonally, Summer (74 days avg.) sees the longest lead times, while Winter (21 days avg.) has the shortest, reflecting typical travel planning cycles.
Recommendations for Hosts
- Use the overall average lead time (52 days) as a baseline for your pricing and availability strategy in San Bartolomeo al Mare.
- For August stays, consider implementing length-of-stay discounts or slightly higher rates for bookings made less than 99 days out to capitalize on advance planning.
- During March, focus on last-minute booking availability and promotions, as guests book with very short notice (11 days avg.).
- Target marketing efforts for the Summer season well in advance (at least 74 days) to capture early planners.
- Monitor your own booking lead times against these San Bartolomeo al Mare averages to identify opportunities for dynamic pricing adjustments.
Popular & Essential Airbnb Amenities in San Bartolomeo al Mare (2026)
Amenity Prevalence
Amenity Insights for San Bartolomeo al Mare
- Essential amenities in San Bartolomeo al Mare that guests expect include: Kitchen. Lacking these (this) could significantly impact bookings.
- Popular amenities like TV, Washer, Refrigerator are common but not universal. Offering these can provide a competitive edge.
Recommendations for Hosts
- Ensure your listing includes all essential amenities for San Bartolomeo al Mare: Kitchen.
- Prioritize adding missing essentials: Kitchen.
- Consider adding popular differentiators like TV or Washer to increase appeal.
- Highlight unique or less common amenities you offer (e.g., hot tub, dedicated workspace, EV charger) in your listing description and photos.
- Regularly check competitor amenities in San Bartolomeo al Mare to stay competitive.
San Bartolomeo al Mare Airbnb Guest Demographics & Profile Analysis (2026)
Guest Profile Summary for San Bartolomeo al Mare
- The typical guest profile for Airbnb in San Bartolomeo al Mare consists of a mix of domestic (47%) and international guests, with top international origins including Germany, typically belonging to the Post-2000s (Gen Z/Alpha) group (50%), primarily speaking English or Italian.
- Domestic travelers account for 46.6% of guests.
- Key international markets include Italy (46.6%) and Germany (13.6%).
- Top languages spoken are English (33.6%) followed by Italian (25.2%).
- A significant demographic segment is the Post-2000s (Gen Z/Alpha) group, representing 50% of guests.
Recommendations for Hosts
- Balance marketing efforts between domestic and international channels based on the guest mix.
- Tailor amenities and listing descriptions to appeal to the dominant Post-2000s (Gen Z/Alpha) demographic (e.g., highlight fast WiFi, smart home features, local guides).
- Highlight unique local experiences or amenities relevant to the primary guest profile.
- Consider seasonal promotions aligned with peak travel times for key origin markets.
Nearby Short-Term Rental Market Comparison
How does the San Bartolomeo al Mare Airbnb market stack up against its neighbors? Compare key performance metrics like average monthly revenue, ADR, and occupancy rates in surrounding areas to understand the broader regional STR landscape.
| Market | Active Properties | Monthly Revenue | Daily Rate | Avg. Occupancy |
|---|---|---|---|---|
| Monteu Roero | 12 | $5,184 | $403.07 | 41% |
| Saint-Jean-Cap-Ferrat | 114 | $3,894 | $465.00 | 44% |
| Cassinasco | 19 | $3,887 | $718.39 | 40% |
| Cossano Belbo | 15 | $3,763 | $326.53 | 36% |
| Portofino | 77 | $3,585 | $509.42 | 38% |
| Monaco | 193 | $3,208 | $490.13 | 36% |
| Villefranche-sur-Mer | 494 | $3,095 | $295.76 | 50% |
| Tourrettes-sur-Loup | 168 | $3,021 | $399.67 | 44% |
| Monterosso al Mare | 370 | $2,991 | $264.15 | 52% |
| Èze | 167 | $2,961 | $366.26 | 44% |