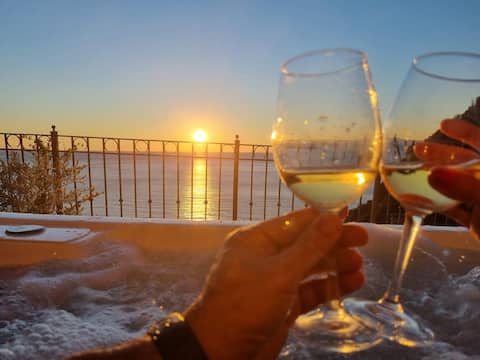
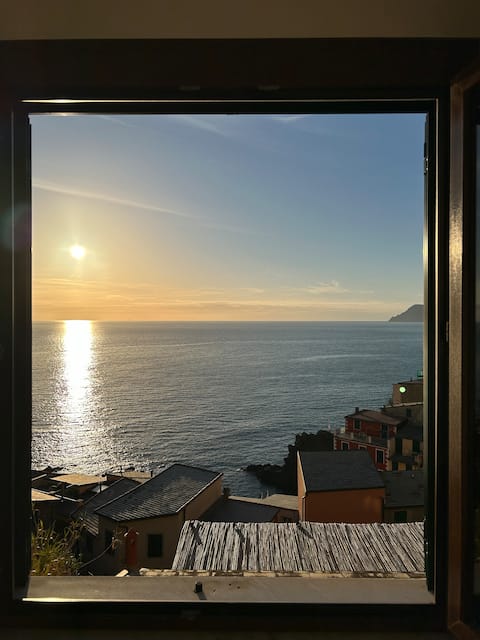
Riomaggiore Airbnb Market Analysis 2026: Short Term Rental Data & Vacation Rental Statistics in Liguria, Italy
Is Airbnb profitable in Riomaggiore in 2026? Explore comprehensive Airbnb analytics for Riomaggiore, Liguria, Italy to uncover income potential. This 2026 STR market report for Riomaggiore, based on AirROI data from February 2025 to January 2026, reveals key trends in the market of 685 active listings.
Whether you're considering an Airbnb investment in Riomaggiore, optimizing your existing vacation rental, or exploring rental arbitrage opportunities, understanding the Riomaggiore Airbnb data is crucial. Navigating the high regulation landscape is key to maximizing your short term rental income potential. Let's dive into the specifics.
Key Riomaggiore Airbnb Performance Metrics Overview
Monthly Airbnb Revenue Variations & Income Potential in Riomaggiore (2026)
Understanding the monthly revenue variations for Airbnb listings in Riomaggiore is key to maximizing your short term rental income potential. Seasonality significantly impacts earnings. Our analysis, based on data from the past 12 months, shows that the peak revenue month for STRs in Riomaggiore is typically September, while January often presents the lowest earnings, highlighting opportunities for strategic pricing adjustments during shoulder and low seasons. Explore the typical Airbnb income in Riomaggiore across different performance tiers:
- Best-in-class properties (Top 10%) achieve $5,992+ monthly, often utilizing dynamic pricing and superior guest experiences.
- Strong performing properties (Top 25%) earn $4,047 or more, indicating effective management and desirable locations/amenities.
- Typical properties (Median) generate around $2,557 per month, representing the average market performance.
- Entry-level properties (Bottom 25%) see earnings around $1,489, often with potential for optimization.
Average Monthly Airbnb Earnings Trend in Riomaggiore
Riomaggiore Airbnb Occupancy Rate Trends (2026)
Maximize your bookings by understanding the Riomaggiore STR occupancy trends. Seasonal demand shifts significantly influence how often properties are booked. Typically, Septembersees the highest demand (peak season occupancy), while January experiences the lowest (low season). Effective strategies, like adjusting minimum stays or offering promotions, can boost occupancy during slower periods. Here's how different property tiers perform in Riomaggiore:
- Best-in-class properties (Top 10%) achieve 79%+ occupancy, indicating high desirability and potentially optimized availability.
- Strong performing properties (Top 25%) maintain 65% or higher occupancy, suggesting good market fit and guest satisfaction.
- Typical properties (Median) have an occupancy rate around 47%.
- Entry-level properties (Bottom 25%) average 27% occupancy, potentially facing higher vacancy.
Average Monthly Occupancy Rate Trend in Riomaggiore
Average Daily Rate (ADR) Airbnb Trends in Riomaggiore (2026)
Effective short term rental pricing strategy in Riomaggiore involves understanding monthly ADR fluctuations. The Average Daily Rate (ADR) for Airbnb in Riomaggiore typically peaks in June and dips lowest during February. Leveraging Airbnb dynamic pricing tools or strategies based on this seasonality can significantly boost revenue. Here's a look at the typical nightly rates achieved:
- Best-in-class properties (Top 10%) command rates of $319+ per night, often due to premium features or locations.
- Strong performing properties (Top 25%) achieve nightly rates of $236 or more.
- Typical properties (Median) charge around $175 per night.
- Entry-level properties (Bottom 25%) earn around $139 per night.
Average Daily Rate (ADR) Trend by Month in Riomaggiore
Get Live Riomaggiore Market Intelligence 👇

Explore Real-time Analytics
Airbnb Seasonality Analysis & Trends in Riomaggiore (2026)
Peak Season (September, August, July)
- Revenue averages $4,487 per month
- Occupancy rates average 63.7%
- Daily rates average $226
Shoulder Season
- Revenue averages $3,152 per month
- Occupancy maintains around 48.9%
- Daily rates hold near $203
Low Season (January, February, December)
- Revenue drops to average $1,518 per month
- Occupancy decreases to average 25.0%
- Daily rates adjust to average $185
Seasonality Insights for Riomaggiore
- The Airbnb seasonality in Riomaggiore shows highly seasonal trends requiring careful strategy. While the sections above show seasonal averages, it's also insightful to look at the extremes:
- During the high season, the absolute peak month showcases Riomaggiore's highest earning potential, with monthly revenues capable of climbing to $4,619, occupancy reaching a high of 67.8%, and ADRs peaking at $230.
- Conversely, the slowest single month of the year, typically falling within the low season, marks the market's lowest point. In this month, revenue might dip to $1,126, occupancy could drop to 19.5%, and ADRs may adjust down to $178.
- Understanding both the seasonal averages and these monthly peaks and troughs in revenue, occupancy, and ADR is crucial for maximizing your Airbnb profit potential in Riomaggiore.
Seasonal Strategies for Maximizing Profit
- Peak Season: Maximize revenue through premium pricing and potentially longer minimum stays. Ensure high availability.
- Low Season: Offer competitive pricing, special promotions (e.g., extended stay discounts), and flexible cancellation policies. Target off-season travelers like remote workers or budget-conscious guests.
- Shoulder Seasons: Implement dynamic pricing that balances peak and low rates. Target weekend travelers or specific events. Offer slightly more flexible terms than peak season.
- Regularly analyze your own performance against these Riomaggiore seasonality benchmarks and adjust your pricing and availability strategy accordingly.
Best Areas for Airbnb Investment in Riomaggiore (2026)
Exploring the top neighborhoods for short-term rentals in Riomaggiore? This section highlights key areas, outlining why they are attractive for hosts and guests, along with notable local attractions. Consider these locations based on your target guest profile and investment strategy.
| Neighborhood / Area | Why Host Here? (Target Guests & Appeal) | Key Attractions & Landmarks |
|---|---|---|
| Marina di Riomaggiore | Beautiful beachfront area with stunning views and direct access to the coast. Perfect for travelers looking to enjoy the natural beauty of Cinque Terre while being steps from the water. | Riomaggiore Harbor, Via dell'Amore, Cinque Terre National Park, Riomaggiore Beach, Scenic Boat Tours |
| Historic Riomaggiore Village | Charming and picturesque village known for its colorful houses and steep streets. A prime spot for tourists wanting an authentic Italian experience with easy access to local shops and restaurants. | Church of San Giovanni Battista, Riomaggiore Castle, Local eateries, Shopping for local artisan products, Panoramic viewpoints |
| Via San Giovanni Battista | The main street in Riomaggiore, lined with shops and restaurants. Great for travelers who appreciate walking through vibrant local life while enjoying the incredible views. | Local cafes, Shops selling local products, Restaurants with terrace views, Street performances, Access to hiking trails |
| Cinque Terre National Park | Natural park surrounding Riomaggiore known for its hiking trails and breathtaking landscapes. A hotspot for adventure lovers and nature enthusiasts. | Hiking Trails, Panoramic viewpoints, Flora and Fauna, Wildlife watching, Photography opportunities |
| Lovers Lane (Via dell'Amore) | A romantic walkway connecting Riomaggiore to Manarola, popular with couples. A beautiful spot for those looking to capture stunning coastal views. | Stunning coastal views, Photo opportunities, Romantic ambiance, Cafes along the way, Access to both Riomaggiore and Manarola |
| Castle of Riomaggiore | An ancient castle offering historical significance and incredible views of the village and coastline. Perfect for history buffs and those interested in local culture. | Historic architecture, Cultural heritage, Educational tours, Scenic overlooks, Sunset views |
| Local Wine District | Riomaggiore is known for its high-quality wines, particularly Sciacchetrà. A great area for wine lovers and those wanting to experience local flavors. | Wine tastings, Vineyard tours, Local wineries, Wine festivals, Culinary experiences |
| Nearby Beaches | Various small beaches are accessible from Riomaggiore, ideal for sunbathing and swimming. Attracts visitors looking to relax and enjoy the coastal environment. | Fossola Beach, Cairola Beach, Private coves, Swimming spots, Beachfront cafes |
Understanding Airbnb License Requirements & STR Laws in Riomaggiore (2026)
Yes, Riomaggiore, Liguria, Italy enforces high STR regulations. Obtaining a license and ensuring compliance is almost certainly required according to current 2026 STR laws. Always verify the latest short term rental regulations and Airbnb license requirements directly with local government authorities for Riomaggiore to ensure full compliance before hosting.
(Source: AirROI data, 2026, based on 95% licensed listings)
Top Performing Airbnb Properties in Riomaggiore (2026)
Benchmark your potential! Explore examples of top-performing Airbnb properties in Riomaggiorebased on Trailing Twelve Month (TTM) revenue. Analyze their characteristics, revenue, occupancy rate, and ADR to understand what drives success in this market.

Belvedere226, stunning villa overlooking the sea
Entire Place • 2 bedrooms
Garden | The Sunset Line
Private Room • 1 bedroom
"Sunset Garden" apartment, value and comfort
Entire Place • 2 bedrooms

Alla Marina - Atlantis, large terrace on the sea.
Entire Place • 2 bedrooms

"Oltremare" apartment, value and comfort
Entire Place • 2 bedrooms

Marina's House
Entire Place • 2 bedrooms
Note: Performance varies based on location, size, amenities, seasonality, and management quality. Data reflects the past 12 months.
Top Performing Airbnb Hosts in Riomaggiore (2026)
Learn from the best! This table showcases top-performing Airbnb hosts in Riomaggiore based on the number of properties managed and estimated total revenue over the past year. Analyze their scale and performance metrics.
| Host Name | Properties | Grossing Revenue | Stay Reviews | Avg Rating |
|---|---|---|---|---|
| Terre | 44 | $1,156,549 | 1251 | 4.45/5.0 |
| Eugenio | 33 | $1,058,106 | 3151 | 4.70/5.0 |
| Roberta | 11 | $658,189 | 2787 | 4.92/5.0 |
| Horizon Srl | 15 | $400,933 | 787 | 4.65/5.0 |
| Giovanni | 6 | $358,088 | 682 | 4.79/5.0 |
| Ysy | 7 | $344,330 | 1249 | 4.93/5.0 |
| Martha And Francesco | 9 | $328,912 | 742 | 4.98/5.0 |
| Giorgio | 6 | $299,039 | 452 | 4.96/5.0 |
| Paolo Scorci Di Mare | 6 | $269,280 | 1207 | 4.92/5.0 |
| Sandro | 7 | $264,346 | 380 | 4.93/5.0 |
Analyzing the strategies of top hosts, such as their property selection, pricing, and guest communication, can offer valuable lessons for optimizing your own Airbnb operations in Riomaggiore.
Dive Deeper: Advanced Riomaggiore STR Market Data (2026)
Ready to unlock more insights? AirROI provides access to advanced metrics and comprehensive Airbnb data for Riomaggiore. Explore detailed analytics beyond this report to refine your investment strategy, optimize pricing, and maximize your vacation rental profits.
Explore Advanced MetricsRiomaggiore Short-Term Rental Market Composition (2026): Property & Room Types
Room Type Distribution
Property Type Distribution
Market Composition Insights for Riomaggiore
- The Riomaggiore Airbnb market composition is heavily skewed towards Entire Home/Apt listings, which make up 72.4% of the 685 active rentals. This indicates strong guest preference for privacy and space.
- Looking at the property type distribution in Riomaggiore, Apartment/Condo properties are the most common (73.9%), reflecting the local real estate landscape.
- Houses represent a significant 15.5% portion, catering likely to families or larger groups.
- The presence of 6.3% Hotel/Boutique listings indicates integration with traditional hospitality.
- Smaller segments like others, outdoor/unique (combined 4.3%) offer potential for unique stay experiences.
Riomaggiore Airbnb Room Capacity Analysis (2026): Bedroom Distribution
Distribution of Listings by Number of Bedrooms
Room Capacity Insights for Riomaggiore
- The dominant room capacity in Riomaggiore is 1 bedroom listings, making up 55.3% of the market. This suggests a strong demand for properties suitable for couples or solo travelers.
- Together, 1 bedroom and 2 bedrooms properties represent 75.7% of the active Airbnb listings in Riomaggiore, indicating a high concentration in these sizes.
- With over half the market (55.3%) consisting of studios or 1-bedroom units, Riomaggiore is particularly well-suited for individuals or couples.
- Listings with 3+ bedrooms (2.9%) represent a smaller niche, potentially indicating an underserved market for larger group accommodations in Riomaggiore.
Riomaggiore Vacation Rental Guest Capacity Trends (2026)
Distribution of Listings by Guest Capacity
Guest Capacity Insights for Riomaggiore
- The most common guest capacity trend in Riomaggiore vacation rentals is listings accommodating 2 guests (30.4%). This suggests the primary traveler segment is likely couples or solo travelers.
- Properties designed for 2 guests and 4 guests dominate the Riomaggiore STR market, accounting for 55.4% of listings.
- On average, properties in Riomaggiore are equipped to host 2.8 guests.
Riomaggiore Airbnb Booking Patterns (2026): Available vs. Booked Days
Available Days Distribution
Booked Days Distribution
Booking Pattern Insights for Riomaggiore
- The most common availability pattern in Riomaggiore falls within the 181-270 days range, representing 39.6% of listings. This suggests many properties have significant open periods on their calendars.
- Approximately 70.4% of listings show high availability (181+ days open annually), indicating potential for increased bookings or specific owner usage patterns.
- For booked days, the 91-180 days range is most frequent in Riomaggiore (38.8%), reflecting common guest stay durations or potential owner blocking patterns.
- A notable 31.4% of properties secure long booking periods (181+ days booked per year), highlighting successful long-term rental strategies or significant owner usage.
Riomaggiore Airbnb Minimum Stay Requirements Analysis
Distribution of Listings by Minimum Night Requirement
1 Night
118 listings
17.2% of total
2 Nights
123 listings
18% of total
3 Nights
20 listings
2.9% of total
4-6 Nights
11 listings
1.6% of total
7-29 Nights
8 listings
1.2% of total
30+ Nights
405 listings
59.1% of total
Key Insights
- The most prevalent minimum stay requirement in Riomaggiore is 30+ Nights, adopted by 59.1% of listings. This highlights the market's preference for longer commitments.
- A significant segment (59.1%) caters to monthly stays (30+ nights) in Riomaggiore, pointing to opportunities in the extended-stay market.
Recommendations
- Align with the market by considering a 30+ Nights minimum stay, as 59.1% of Riomaggiore hosts use this setting.
- If feasible, allowing 1-night stays, especially midweek or during low season, could capture last-minute bookings, as only 17.2% currently do.
- Explore offering discounts for stays of 30+ nights to attract the 59.1% of the market seeking extended stays.
- Adjust minimum nights based on seasonality – potentially shorter during low season and longer during peak demand periods in Riomaggiore.
Riomaggiore Airbnb Cancellation Policy Trends Analysis (2026)
Limited
8 listings
1.2% of total
Super Strict 30 Days
18 listings
2.6% of total
Flexible
185 listings
27% of total
Moderate
410 listings
59.9% of total
Firm
56 listings
8.2% of total
Strict
7 listings
1% of total
Cancellation Policy Insights for Riomaggiore
- The prevailing Airbnb cancellation policy trend in Riomaggiore is Moderate, used by 59.9% of listings.
- The market strongly favors guest-friendly terms, with 86.9% of listings offering Flexible or Moderate policies. This suggests guests in Riomaggiore may expect booking flexibility.
- Strict cancellation policies are quite rare (1%), potentially making listings with this policy less competitive unless justified by high demand or property type.
Recommendations for Hosts
- Consider adopting a Moderate policy to align with the 59.9% market standard in Riomaggiore.
- Using a Strict policy might deter some guests, as only 1% of listings use it. Evaluate if potential revenue protection outweighs possible lower booking rates.
- Regularly review your cancellation policy against competitors and market demand shifts in Riomaggiore.
Riomaggiore STR Booking Lead Time Analysis (2026)
Average Booking Lead Time by Month
Booking Lead Time Insights for Riomaggiore
- The overall average booking lead time for vacation rentals in Riomaggiore is 67 days.
- Guests book furthest in advance for stays during February (average 87 days), likely coinciding with peak travel demand or local events.
- The shortest booking windows occur for stays in January (average 42 days), indicating more last-minute travel plans during this time.
- Seasonally, Fall (75 days avg.) sees the longest lead times, while Winter (58 days avg.) has the shortest, reflecting typical travel planning cycles.
Recommendations for Hosts
- Use the overall average lead time (67 days) as a baseline for your pricing and availability strategy in Riomaggiore.
- For February stays, consider implementing length-of-stay discounts or slightly higher rates for bookings made less than 87 days out to capitalize on advance planning.
- Target marketing efforts for the Fall season well in advance (at least 75 days) to capture early planners.
- Monitor your own booking lead times against these Riomaggiore averages to identify opportunities for dynamic pricing adjustments.
Popular & Essential Airbnb Amenities in Riomaggiore (2026)
Amenity Prevalence
Amenity Insights for Riomaggiore
- Essential amenities in Riomaggiore that guests expect include: Wifi. Lacking these (this) could significantly impact bookings.
- Popular amenities like Hair dryer, Hot water, Heating are common but not universal. Offering these can provide a competitive edge.
Recommendations for Hosts
- Ensure your listing includes all essential amenities for Riomaggiore: Wifi.
- Prioritize adding missing essentials: Wifi.
- Consider adding popular differentiators like Hair dryer or Hot water to increase appeal.
- Highlight unique or less common amenities you offer (e.g., hot tub, dedicated workspace, EV charger) in your listing description and photos.
- Regularly check competitor amenities in Riomaggiore to stay competitive.
Riomaggiore Airbnb Guest Demographics & Profile Analysis (2026)
Guest Profile Summary for Riomaggiore
- The typical guest profile for Airbnb in Riomaggiore consists of predominantly international visitors (98%), with top international origins including Canada, typically belonging to the Post-2000s (Gen Z/Alpha) group (50%), primarily speaking English or Spanish.
- Domestic travelers account for 2.1% of guests.
- Key international markets include United States (49%) and Canada (10%).
- Top languages spoken are English (56.8%) followed by Spanish (11.1%).
- A significant demographic segment is the Post-2000s (Gen Z/Alpha) group, representing 50% of guests.
Recommendations for Hosts
- Focus marketing internationally, particularly towards travelers from Canada.
- Tailor amenities and listing descriptions to appeal to the dominant Post-2000s (Gen Z/Alpha) demographic (e.g., highlight fast WiFi, smart home features, local guides).
- Highlight unique local experiences or amenities relevant to the primary guest profile.
- Consider seasonal promotions aligned with peak travel times for key origin markets.
Nearby Short-Term Rental Market Comparison
How does the Riomaggiore Airbnb market stack up against its neighbors? Compare key performance metrics like average monthly revenue, ADR, and occupancy rates in surrounding areas to understand the broader regional STR landscape.
| Market | Active Properties | Monthly Revenue | Daily Rate | Avg. Occupancy |
|---|---|---|---|---|
| Ranco | 12 | $5,691 | $536.46 | 42% |
| Laglio | 64 | $4,334 | $518.58 | 43% |
| Cassinasco | 19 | $3,887 | $718.39 | 40% |
| Castelfranco di Sotto | 47 | $3,777 | $377.39 | 39% |
| Cossano Belbo | 15 | $3,763 | $326.53 | 36% |
| Portofino | 77 | $3,585 | $509.42 | 38% |
| Bellagio | 461 | $3,466 | $325.87 | 49% |
| Vico Morcote | 12 | $3,347 | $317.07 | 46% |
| Sala Comacina | 73 | $3,332 | $451.20 | 46% |
| Carate Urio | 76 | $3,200 | $362.97 | 41% |