Moneglia Airbnb Market Analysis 2026: Short Term Rental Data & Vacation Rental Statistics in Liguria, Italy
Is Airbnb profitable in Moneglia in 2026? Explore comprehensive Airbnb analytics for Moneglia, Liguria, Italy to uncover income potential. This 2026 STR market report for Moneglia, based on AirROI data from February 2025 to January 2026, reveals key trends in the market of 242 active listings.
Whether you're considering an Airbnb investment in Moneglia, optimizing your existing vacation rental, or exploring rental arbitrage opportunities, understanding the Moneglia Airbnb data is crucial. Navigating the high regulation landscape is key to maximizing your short term rental income potential. Let's dive into the specifics.
Key Moneglia Airbnb Performance Metrics Overview
Monthly Airbnb Revenue Variations & Income Potential in Moneglia (2026)
Understanding the monthly revenue variations for Airbnb listings in Moneglia is key to maximizing your short term rental income potential. Seasonality significantly impacts earnings. Our analysis, based on data from the past 12 months, shows that the peak revenue month for STRs in Moneglia is typically August, while January often presents the lowest earnings, highlighting opportunities for strategic pricing adjustments during shoulder and low seasons. Explore the typical Airbnb income in Moneglia across different performance tiers:
- Best-in-class properties (Top 10%) achieve $4,069+ monthly, often utilizing dynamic pricing and superior guest experiences.
- Strong performing properties (Top 25%) earn $2,767 or more, indicating effective management and desirable locations/amenities.
- Typical properties (Median) generate around $1,689 per month, representing the average market performance.
- Entry-level properties (Bottom 25%) see earnings around $879, often with potential for optimization.
Average Monthly Airbnb Earnings Trend in Moneglia
Moneglia Airbnb Occupancy Rate Trends (2026)
Maximize your bookings by understanding the Moneglia STR occupancy trends. Seasonal demand shifts significantly influence how often properties are booked. Typically, Augustsees the highest demand (peak season occupancy), while December experiences the lowest (low season). Effective strategies, like adjusting minimum stays or offering promotions, can boost occupancy during slower periods. Here's how different property tiers perform in Moneglia:
- Best-in-class properties (Top 10%) achieve 75%+ occupancy, indicating high desirability and potentially optimized availability.
- Strong performing properties (Top 25%) maintain 55% or higher occupancy, suggesting good market fit and guest satisfaction.
- Typical properties (Median) have an occupancy rate around 35%.
- Entry-level properties (Bottom 25%) average 17% occupancy, potentially facing higher vacancy.
Average Monthly Occupancy Rate Trend in Moneglia
Average Daily Rate (ADR) Airbnb Trends in Moneglia (2026)
Effective short term rental pricing strategy in Moneglia involves understanding monthly ADR fluctuations. The Average Daily Rate (ADR) for Airbnb in Moneglia typically peaks in July and dips lowest during February. Leveraging Airbnb dynamic pricing tools or strategies based on this seasonality can significantly boost revenue. Here's a look at the typical nightly rates achieved:
- Best-in-class properties (Top 10%) command rates of $259+ per night, often due to premium features or locations.
- Strong performing properties (Top 25%) achieve nightly rates of $196 or more.
- Typical properties (Median) charge around $150 per night.
- Entry-level properties (Bottom 25%) earn around $117 per night.
Average Daily Rate (ADR) Trend by Month in Moneglia
Get Live Moneglia Market Intelligence 👇

Explore Real-time Analytics
Airbnb Seasonality Analysis & Trends in Moneglia (2026)
Peak Season (August, July, September)
- Revenue averages $3,615 per month
- Occupancy rates average 59.3%
- Daily rates average $196
Shoulder Season
- Revenue averages $1,805 per month
- Occupancy maintains around 36.2%
- Daily rates hold near $168
Low Season (January, February, December)
- Revenue drops to average $905 per month
- Occupancy decreases to average 20.7%
- Daily rates adjust to average $169
Seasonality Insights for Moneglia
- The Airbnb seasonality in Moneglia shows highly seasonal trends requiring careful strategy. While the sections above show seasonal averages, it's also insightful to look at the extremes:
- During the high season, the absolute peak month showcases Moneglia's highest earning potential, with monthly revenues capable of climbing to $4,175, occupancy reaching a high of 65.4%, and ADRs peaking at $200.
- Conversely, the slowest single month of the year, typically falling within the low season, marks the market's lowest point. In this month, revenue might dip to $852, occupancy could drop to 17.8%, and ADRs may adjust down to $152.
- Understanding both the seasonal averages and these monthly peaks and troughs in revenue, occupancy, and ADR is crucial for maximizing your Airbnb profit potential in Moneglia.
Seasonal Strategies for Maximizing Profit
- Peak Season: Maximize revenue through premium pricing and potentially longer minimum stays. Ensure high availability.
- Low Season: Offer competitive pricing, special promotions (e.g., extended stay discounts), and flexible cancellation policies. Target off-season travelers like remote workers or budget-conscious guests.
- Shoulder Seasons: Implement dynamic pricing that balances peak and low rates. Target weekend travelers or specific events. Offer slightly more flexible terms than peak season.
- Regularly analyze your own performance against these Moneglia seasonality benchmarks and adjust your pricing and availability strategy accordingly.
Best Areas for Airbnb Investment in Moneglia (2026)
Exploring the top neighborhoods for short-term rentals in Moneglia? This section highlights key areas, outlining why they are attractive for hosts and guests, along with notable local attractions. Consider these locations based on your target guest profile and investment strategy.
| Neighborhood / Area | Why Host Here? (Target Guests & Appeal) | Key Attractions & Landmarks |
|---|---|---|
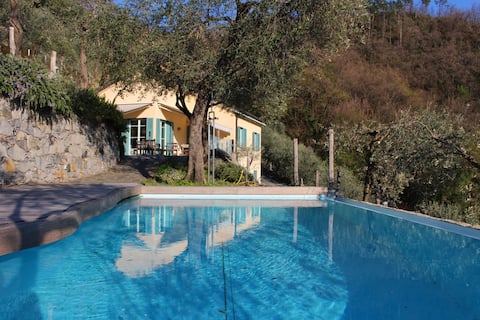
| Moneglia Beach | A picturesque beach area known for its stunning coastline and clear waters. Popular with families and beachgoers seeking a relaxing vacation spot close to amenities. | Moneglia Beach, Mediterranean Sea, Moneglia Waterfront Promenade, Beach Clubs, Charming coastal cafes |
| Historic Center | The charming historic center of Moneglia with its narrow streets and traditional Ligurian architecture. Great for travelers interested in culture and local cuisine. | San Giorgio Church, Historic houses, Local restaurants, Scenic viewpoints, Artisan shops |
| San Lorenzo | A peaceful residential area close to the beach that attracts visitors looking for tranquility and beautiful views of the surrounding hills. | San Lorenzo Beach, Nature trails, Hiking opportunities, Local vineyards, Scenic overlooks |
| Golf Club Rapallo | Just a short drive from Moneglia, this is a great area for golf enthusiasts and those seeking a more rural Italian retreat with luxurious accommodations. | Golf Club Rapallo, Natural parks, Countryside scenery, Wine tasting tours, Local festivals |
| Hiking Trails | Moneglia is surrounded by beautiful hiking trails, making it a perfect location for outdoor enthusiasts seeking adventure and stunning landscapes. | Cinque Terre National Park, Montallegro Sanctuary, Spectacular viewpoints, Nature reserves, Local flora and fauna |
| Cinqueterre Access | Moneglia serves as a convenient base to explore the famous Cinque Terre, attracting tourists eager to experience the stunning coastal villages. | Cinque Terre villages, Boat tours, Hiking routes to Cinque Terre, Local seafood restaurants, Cultural festivals |
| Local Markets | This area features local markets where visitors can experience authentic Italian culture and cuisine, great for those looking for a stay immersed in local life. | Weekly markets, Local produce, Traditional Ligurian food, Artisan crafts, Cooking classes |
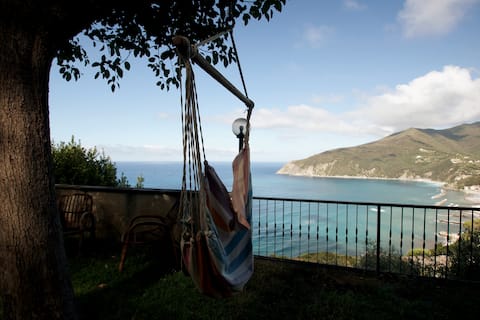
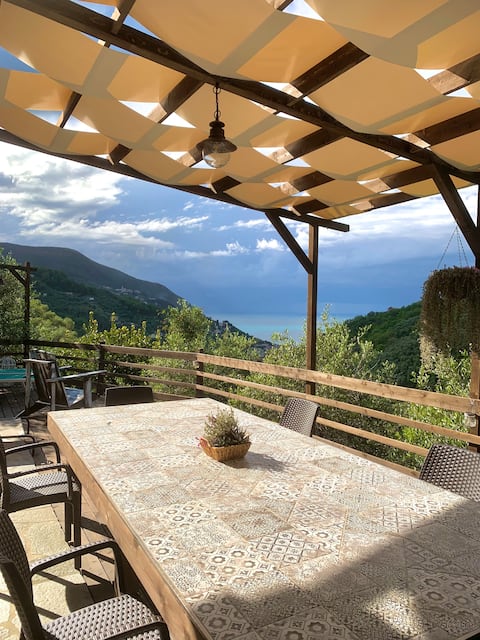
| Scenic Overlook | An area known for breathtaking views and picturesque scenery, great for those looking for a romantic getaway or scenic photography opportunities. | Sunset viewpoints, Adventure photography spots, Nature trails, Botanical gardens, Historic landmarks |
Understanding Airbnb License Requirements & STR Laws in Moneglia (2026)
Yes, Moneglia, Liguria, Italy enforces high STR regulations. Obtaining a license and ensuring compliance is almost certainly required according to current 2026 STR laws. Always verify the latest short term rental regulations and Airbnb license requirements directly with local government authorities for Moneglia to ensure full compliance before hosting.
(Source: AirROI data, 2026, based on 89% licensed listings)
Top Performing Airbnb Properties in Moneglia (2026)
Benchmark your potential! Explore examples of top-performing Airbnb properties in Monegliabased on Trailing Twelve Month (TTM) revenue. Analyze their characteristics, revenue, occupancy rate, and ADR to understand what drives success in this market.
Villa solarolo-Between portofino and cinque terre
Entire Place • 4 bedrooms
E Prïe - cod. Citra 010037 - LT - 0575
Entire Place • 5 bedrooms
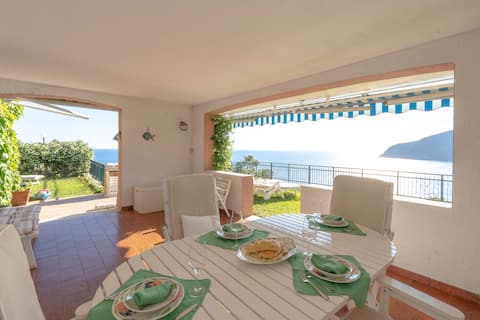
Amazing view with garden
Entire Place • 3 bedrooms

Awesome home in Moneglia with kitchen
Entire Place • 2 bedrooms
Villa Claudia, cin it010037c2xczsjpdl
Entire Place • 3 bedrooms
Very neat apartment with stunning views
Entire Place • 2 bedrooms
Note: Performance varies based on location, size, amenities, seasonality, and management quality. Data reflects the past 12 months.
Top Performing Airbnb Hosts in Moneglia (2026)
Learn from the best! This table showcases top-performing Airbnb hosts in Moneglia based on the number of properties managed and estimated total revenue over the past year. Analyze their scale and performance metrics.
| Host Name | Properties | Grossing Revenue | Stay Reviews | Avg Rating |
|---|---|---|---|---|
| Paola Botto | 6 | $166,405 | 203 | 4.56/5.0 |
| Pamela - Interhome | 14 | $158,693 | 99 | 4.36/5.0 |
| Novasol | 4 | $136,851 | 42 | 3.92/5.0 |
| Sonia | 9 | $136,707 | 149 | 4.74/5.0 |
| Fabio | 6 | $124,295 | 23 | 4.93/5.0 |
| Alessandro | 4 | $96,471 | 322 | 4.63/5.0 |
| Luca | 3 | $92,119 | 106 | 4.88/5.0 |
| Andrea | 1 | $85,985 | 90 | 4.93/5.0 |
| Nicola | 3 | $81,233 | 57 | 4.97/5.0 |
| Pmc | 10 | $73,925 | 40 | 4.48/5.0 |
Analyzing the strategies of top hosts, such as their property selection, pricing, and guest communication, can offer valuable lessons for optimizing your own Airbnb operations in Moneglia.
Dive Deeper: Advanced Moneglia STR Market Data (2026)
Ready to unlock more insights? AirROI provides access to advanced metrics and comprehensive Airbnb data for Moneglia. Explore detailed analytics beyond this report to refine your investment strategy, optimize pricing, and maximize your vacation rental profits.
Explore Advanced MetricsMoneglia Short-Term Rental Market Composition (2026): Property & Room Types
Room Type Distribution
Property Type Distribution
Market Composition Insights for Moneglia
- The Moneglia Airbnb market composition is heavily skewed towards Entire Home/Apt listings, which make up 95.5% of the 242 active rentals. This indicates strong guest preference for privacy and space.
- Looking at the property type distribution in Moneglia, Apartment/Condo properties are the most common (74.4%), reflecting the local real estate landscape.
- Houses represent a significant 19.8% portion, catering likely to families or larger groups.
- Smaller segments like hotel/boutique, outdoor/unique, others (combined 5.8%) offer potential for unique stay experiences.
Moneglia Airbnb Room Capacity Analysis (2026): Bedroom Distribution
Distribution of Listings by Number of Bedrooms
Room Capacity Insights for Moneglia
- The dominant room capacity in Moneglia is 2 bedrooms listings, making up 45.9% of the market. This suggests a strong demand for properties suitable for couples or solo travelers.
- Together, 2 bedrooms and 1 bedroom properties represent 78.1% of the active Airbnb listings in Moneglia, indicating a high concentration in these sizes.
Moneglia Vacation Rental Guest Capacity Trends (2026)
Distribution of Listings by Guest Capacity
Guest Capacity Insights for Moneglia
- The most common guest capacity trend in Moneglia vacation rentals is listings accommodating 4 guests (40.5%). This suggests the primary traveler segment is likely small families or groups.
- Properties designed for 4 guests and 6 guests dominate the Moneglia STR market, accounting for 60.3% of listings.
- 26.0% of properties accommodate 6+ guests, serving the market segment for larger families or group travel in Moneglia.
- On average, properties in Moneglia are equipped to host 4.4 guests.
Moneglia Airbnb Booking Patterns (2026): Available vs. Booked Days
Available Days Distribution
Booked Days Distribution
Booking Pattern Insights for Moneglia
- The most common availability pattern in Moneglia falls within the 271-366 days range, representing 53.3% of listings. This suggests many properties have significant open periods on their calendars.
- Approximately 89.3% of listings show high availability (181+ days open annually), indicating potential for increased bookings or specific owner usage patterns.
- For booked days, the 91-180 days range is most frequent in Moneglia (37.2%), reflecting common guest stay durations or potential owner blocking patterns.
- A notable 11.1% of properties secure long booking periods (181+ days booked per year), highlighting successful long-term rental strategies or significant owner usage.
Moneglia Airbnb Minimum Stay Requirements Analysis
Distribution of Listings by Minimum Night Requirement
1 Night
20 listings
8.3% of total
2 Nights
24 listings
9.9% of total
3 Nights
20 listings
8.3% of total
4-6 Nights
28 listings
11.6% of total
7-29 Nights
16 listings
6.6% of total
30+ Nights
134 listings
55.4% of total
Key Insights
- The most prevalent minimum stay requirement in Moneglia is 30+ Nights, adopted by 55.4% of listings. This highlights the market's preference for longer commitments.
- Very short stays (1-2 nights) are less common (18.2%), suggesting hosts prefer slightly longer bookings to optimize turnover.
- A significant segment (55.4%) caters to monthly stays (30+ nights) in Moneglia, pointing to opportunities in the extended-stay market.
Recommendations
- Align with the market by considering a 30+ Nights minimum stay, as 55.4% of Moneglia hosts use this setting.
- If feasible, allowing 1-night stays, especially midweek or during low season, could capture last-minute bookings, as only 8.3% currently do.
- Explore offering discounts for stays of 30+ nights to attract the 55.4% of the market seeking extended stays.
- Adjust minimum nights based on seasonality – potentially shorter during low season and longer during peak demand periods in Moneglia.
Moneglia Airbnb Cancellation Policy Trends Analysis (2026)
Super Strict 30 Days
6 listings
2.5% of total
Limited
2 listings
0.8% of total
Super Strict 60 Days
29 listings
12% of total
Flexible
42 listings
17.4% of total
Moderate
102 listings
42.1% of total
Firm
53 listings
21.9% of total
Strict
8 listings
3.3% of total
Cancellation Policy Insights for Moneglia
- The prevailing Airbnb cancellation policy trend in Moneglia is Moderate, used by 42.1% of listings.
- There's a relatively balanced mix between guest-friendly (59.5%) and stricter (25.2%) policies, offering choices for different guest needs.
- Strict cancellation policies are quite rare (3.3%), potentially making listings with this policy less competitive unless justified by high demand or property type.
Recommendations for Hosts
- Consider adopting a Moderate policy to align with the 42.1% market standard in Moneglia.
- Using a Strict policy might deter some guests, as only 3.3% of listings use it. Evaluate if potential revenue protection outweighs possible lower booking rates.
- Regularly review your cancellation policy against competitors and market demand shifts in Moneglia.
Moneglia STR Booking Lead Time Analysis (2026)
Average Booking Lead Time by Month
Booking Lead Time Insights for Moneglia
- The overall average booking lead time for vacation rentals in Moneglia is 66 days.
- Guests book furthest in advance for stays during August (average 103 days), likely coinciding with peak travel demand or local events.
- The shortest booking windows occur for stays in January (average 33 days), indicating more last-minute travel plans during this time.
- Seasonally, Summer (88 days avg.) sees the longest lead times, while Winter (34 days avg.) has the shortest, reflecting typical travel planning cycles.
Recommendations for Hosts
- Use the overall average lead time (66 days) as a baseline for your pricing and availability strategy in Moneglia.
- For August stays, consider implementing length-of-stay discounts or slightly higher rates for bookings made less than 103 days out to capitalize on advance planning.
- Target marketing efforts for the Summer season well in advance (at least 88 days) to capture early planners.
- Monitor your own booking lead times against these Moneglia averages to identify opportunities for dynamic pricing adjustments.
Popular & Essential Airbnb Amenities in Moneglia (2026)
Amenity Prevalence
Amenity Insights for Moneglia
- Popular amenities like Dishes and silverware, Kitchen, TV are common but not universal. Offering these can provide a competitive edge.
- Warning: Wifi is not universally provided but is considered essential globally. Ensure reliable Wifi is offered.
Recommendations for Hosts
- Consider adding popular differentiators like Dishes and silverware or Kitchen to increase appeal.
- Highlight unique or less common amenities you offer (e.g., hot tub, dedicated workspace, EV charger) in your listing description and photos.
- Regularly check competitor amenities in Moneglia to stay competitive.
Moneglia Airbnb Guest Demographics & Profile Analysis (2026)
Guest Profile Summary for Moneglia
- The typical guest profile for Airbnb in Moneglia consists of predominantly international visitors (87%), with top international origins including France, typically belonging to the Post-2000s (Gen Z/Alpha) group (50%), primarily speaking English or German.
- Domestic travelers account for 13.3% of guests.
- Key international markets include Germany (20.9%) and France (18.2%).
- Top languages spoken are English (36.3%) followed by German (18%).
- A significant demographic segment is the Post-2000s (Gen Z/Alpha) group, representing 50% of guests.
Recommendations for Hosts
- Focus marketing internationally, particularly towards travelers from France.
- Tailor amenities and listing descriptions to appeal to the dominant Post-2000s (Gen Z/Alpha) demographic (e.g., highlight fast WiFi, smart home features, local guides).
- Highlight unique local experiences or amenities relevant to the primary guest profile.
- Consider seasonal promotions aligned with peak travel times for key origin markets.
Nearby Short-Term Rental Market Comparison
How does the Moneglia Airbnb market stack up against its neighbors? Compare key performance metrics like average monthly revenue, ADR, and occupancy rates in surrounding areas to understand the broader regional STR landscape.
| Market | Active Properties | Monthly Revenue | Daily Rate | Avg. Occupancy |
|---|---|---|---|---|
| Ranco | 12 | $5,691 | $536.46 | 42% |
| Laglio | 64 | $4,334 | $518.58 | 43% |
| Cassinasco | 19 | $3,887 | $718.39 | 40% |
| Castelfranco di Sotto | 47 | $3,777 | $377.39 | 39% |
| Cossano Belbo | 15 | $3,763 | $326.53 | 36% |
| Portofino | 77 | $3,585 | $509.42 | 38% |
| Bellagio | 461 | $3,466 | $325.87 | 49% |
| Vico Morcote | 12 | $3,347 | $317.07 | 46% |
| Sala Comacina | 73 | $3,332 | $451.20 | 46% |
| Carate Urio | 76 | $3,200 | $362.97 | 41% |