Isolabona Airbnb Market Analysis 2026: Short Term Rental Data & Vacation Rental Statistics in Liguria, Italy
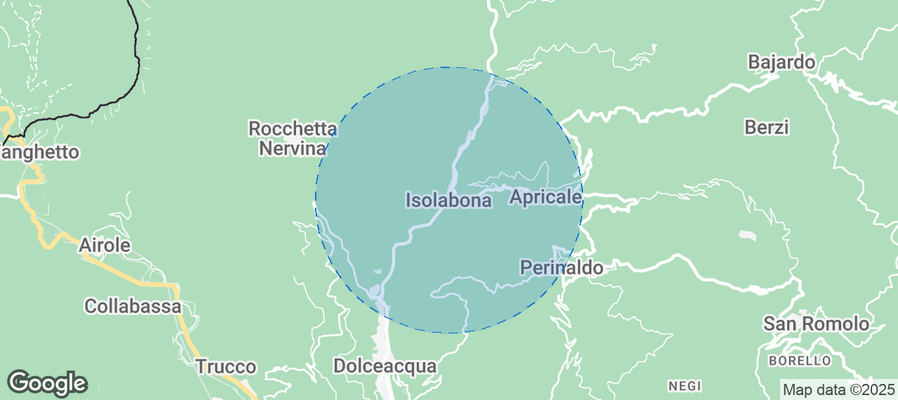
Is Airbnb profitable in Isolabona in 2026? Explore comprehensive Airbnb analytics for Isolabona, Liguria, Italy to uncover income potential. This 2026 STR market report for Isolabona, based on AirROI data from February 2025 to January 2026, reveals key trends in the niche market of 23 active listings.
Whether you're considering an Airbnb investment in Isolabona, optimizing your existing vacation rental, or exploring rental arbitrage opportunities, understanding the Isolabona Airbnb data is crucial. Navigating the high regulation landscape is key to maximizing your short term rental income potential. Let's dive into the specifics.
Key Isolabona Airbnb Performance Metrics Overview
Monthly Airbnb Revenue Variations & Income Potential in Isolabona (2026)
Understanding the monthly revenue variations for Airbnb listings in Isolabona is key to maximizing your short term rental income potential. Seasonality significantly impacts earnings. Our analysis, based on data from the past 12 months, shows that the peak revenue month for STRs in Isolabona is typically August, while December often presents the lowest earnings, highlighting opportunities for strategic pricing adjustments during shoulder and low seasons. Explore the typical Airbnb income in Isolabona across different performance tiers:
- Best-in-class properties (Top 10%) achieve $3,788+ monthly, often utilizing dynamic pricing and superior guest experiences.
- Strong performing properties (Top 25%) earn $2,281 or more, indicating effective management and desirable locations/amenities.
- Typical properties (Median) generate around $910 per month, representing the average market performance.
- Entry-level properties (Bottom 25%) see earnings around $571, often with potential for optimization.
Average Monthly Airbnb Earnings Trend in Isolabona
Isolabona Airbnb Occupancy Rate Trends (2026)
Maximize your bookings by understanding the Isolabona STR occupancy trends. Seasonal demand shifts significantly influence how often properties are booked. Typically, Marchsees the highest demand (peak season occupancy), while December experiences the lowest (low season). Effective strategies, like adjusting minimum stays or offering promotions, can boost occupancy during slower periods. Here's how different property tiers perform in Isolabona:
- Best-in-class properties (Top 10%) achieve 67%+ occupancy, indicating high desirability and potentially optimized availability.
- Strong performing properties (Top 25%) maintain 49% or higher occupancy, suggesting good market fit and guest satisfaction.
- Typical properties (Median) have an occupancy rate around 24%.
- Entry-level properties (Bottom 25%) average 14% occupancy, potentially facing higher vacancy.
Average Monthly Occupancy Rate Trend in Isolabona
Average Daily Rate (ADR) Airbnb Trends in Isolabona (2026)
Effective short term rental pricing strategy in Isolabona involves understanding monthly ADR fluctuations. The Average Daily Rate (ADR) for Airbnb in Isolabona typically peaks in August and dips lowest during January. Leveraging Airbnb dynamic pricing tools or strategies based on this seasonality can significantly boost revenue. Here's a look at the typical nightly rates achieved:
- Best-in-class properties (Top 10%) command rates of $203+ per night, often due to premium features or locations.
- Strong performing properties (Top 25%) achieve nightly rates of $151 or more.
- Typical properties (Median) charge around $112 per night.
- Entry-level properties (Bottom 25%) earn around $94 per night.
Average Daily Rate (ADR) Trend by Month in Isolabona
Get Live Isolabona Market Intelligence 👇
Explore Real-time Analytics
Airbnb Seasonality Analysis & Trends in Isolabona (2026)
Peak Season (August, July, March)
- Revenue averages $2,306 per month
- Occupancy rates average 47.0%
- Daily rates average $140
Shoulder Season
- Revenue averages $1,513 per month
- Occupancy maintains around 29.6%
- Daily rates hold near $128
Low Season (February, September, December)
- Revenue drops to average $879 per month
- Occupancy decreases to average 22.9%
- Daily rates adjust to average $129
Seasonality Insights for Isolabona
- The Airbnb seasonality in Isolabona shows highly seasonal trends requiring careful strategy. While the sections above show seasonal averages, it's also insightful to look at the extremes:
- During the high season, the absolute peak month showcases Isolabona's highest earning potential, with monthly revenues capable of climbing to $2,533, occupancy reaching a high of 54.2%, and ADRs peaking at $146.
- Conversely, the slowest single month of the year, typically falling within the low season, marks the market's lowest point. In this month, revenue might dip to $685, occupancy could drop to 15.7%, and ADRs may adjust down to $121.
- Understanding both the seasonal averages and these monthly peaks and troughs in revenue, occupancy, and ADR is crucial for maximizing your Airbnb profit potential in Isolabona.
Seasonal Strategies for Maximizing Profit
- Peak Season: Maximize revenue through premium pricing and potentially longer minimum stays. Ensure high availability.
- Low Season: Offer competitive pricing, special promotions (e.g., extended stay discounts), and flexible cancellation policies. Target off-season travelers like remote workers or budget-conscious guests.
- Shoulder Seasons: Implement dynamic pricing that balances peak and low rates. Target weekend travelers or specific events. Offer slightly more flexible terms than peak season.
- Regularly analyze your own performance against these Isolabona seasonality benchmarks and adjust your pricing and availability strategy accordingly.
Best Areas for Airbnb Investment in Isolabona (2026)
Exploring the top neighborhoods for short-term rentals in Isolabona? This section highlights key areas, outlining why they are attractive for hosts and guests, along with notable local attractions. Consider these locations based on your target guest profile and investment strategy.
| Neighborhood / Area | Why Host Here? (Target Guests & Appeal) | Key Attractions & Landmarks |
|---|---|---|
| Centro Storico | Isolabona's historic center features charming medieval architecture and quaint alleyways. Attracts visitors interested in local history and culture, making it ideal for Airbnb hosting. | Castello di Isolabona, Church of San Giovanni Battista, Local artisan shops, Scenic hillside views |
| Valle Argentina | Surrounded by stunning natural landscapes, Valle Argentina offers opportunities for hiking and outdoor activities. Perfect for nature lovers and adventure seekers looking for a retreat. | Trails for hiking, Natural waterfalls, Local wildlife, Breathtaking mountain views |
| Castellaro | Nearby Castellaro attracts golf enthusiasts with its scenic golf course and proximity to the coast. A great spot for those looking for a luxurious stay with recreational options. | Castellaro Golf Club, Spa facilities, Restaurants with local cuisine, Scenic coastal views |
| Apricale | The picturesque village of Apricale is just a short drive away and boasts a stunning medieval setting. It's perfect for guests looking for an authentic Italian village experience. | Castello di Apricale, Local art galleries, Rustic Italian restaurants, Traditional festivals |
| San Lorenzo al Mare | This coastal town offers beach access and proximity to the Riviera dei Fiori. Great for tourists wanting a seaside experience with easy access to coastal activities. | Beautiful beaches, Water sports, Promenade for walking and cycling, Local seafood restaurants |
| Bordighera | A nearby beach town known for its floral gardens and Mediterranean climate. Attracts tourists seeking both relaxation and cultural experiences along the coast. | Bordighera's beaches, Villa Regina Margherita, Floral exhibitions, Charming coastal promenade |
| Ventimiglia | Just a short ride away, Ventimiglia offers both cultural attractions and beach activities. An excellent choice for travelers wanting variety in their stay. | Old Town Ventimiglia, Market day on Fridays, Beaches, Roman theatre ruins |
| Dolcedo | This small village is charming and peaceful, known for its olive oil production. Ideal for guests interested in rural tourism and local culinary experiences. | Olive oil mills, Medieval architecture, Scenic hikes along the river, Local dining experiences |
Understanding Airbnb License Requirements & STR Laws in Isolabona (2026)
Yes, Isolabona, Liguria, Italy enforces high STR regulations. Obtaining a license and ensuring compliance is almost certainly required according to current 2026 STR laws. Always verify the latest short term rental regulations and Airbnb license requirements directly with local government authorities for Isolabona to ensure full compliance before hosting.
(Source: AirROI data, 2026, based on 91% licensed listings)
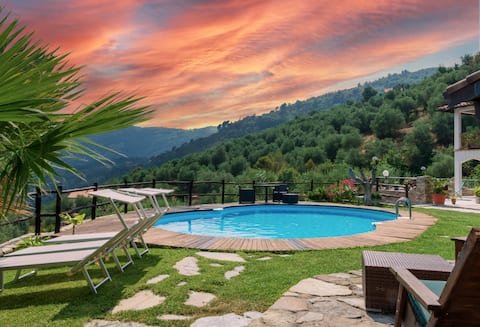
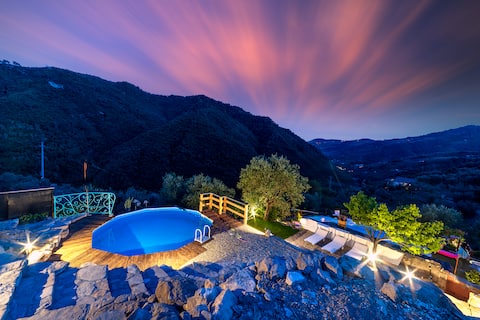
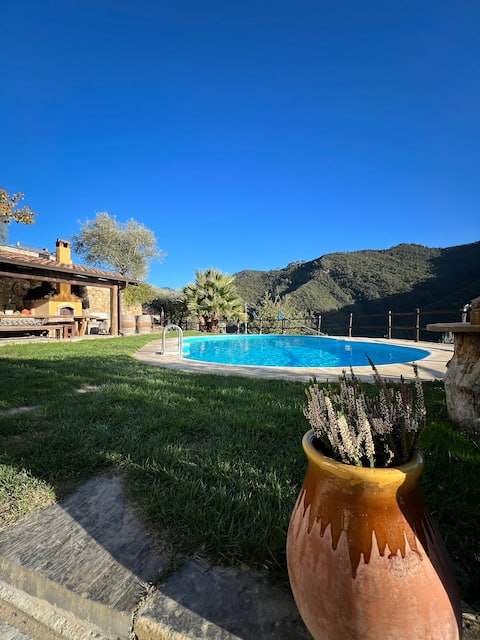
Top Performing Airbnb Properties in Isolabona (2026)
Benchmark your potential! Explore examples of top-performing Airbnb properties in Isolabonabased on Trailing Twelve Month (TTM) revenue. Analyze their characteristics, revenue, occupancy rate, and ADR to understand what drives success in this market.
Once upon a time.
Entire Place • 1 bedroom
Dillo alla luna apartment with exclusive pool
Entire Place • 2 bedrooms
Villa Morghetta
Entire Place • 2 bedrooms
Villa Apricale
Entire Place • 3 bedrooms

Glamping Safari Riviera Lodge
Entire Place • 2 bedrooms

Glamping Safari Airstream Lodge
Entire Place • 2 bedrooms
Note: Performance varies based on location, size, amenities, seasonality, and management quality. Data reflects the past 12 months.
Top Performing Airbnb Hosts in Isolabona (2026)
Learn from the best! This table showcases top-performing Airbnb hosts in Isolabona based on the number of properties managed and estimated total revenue over the past year. Analyze their scale and performance metrics.
| Host Name | Properties | Grossing Revenue | Stay Reviews | Avg Rating |
|---|---|---|---|---|
| Loris | 3 | $99,260 | 176 | 4.97/5.0 |
| Lorena | 6 | $47,020 | 154 | 4.64/5.0 |
| Andreas | 1 | $21,254 | 5 | 3.80/5.0 |
| Mark | 2 | $8,619 | 5 | 4.00/5.0 |
| Fabio | 1 | $8,039 | 4 | 4.50/5.0 |
| Cristian E Federica | 2 | $7,587 | 148 | 4.89/5.0 |
| Daniela | 1 | $3,589 | 7 | 4.57/5.0 |
| Gian Mario | 1 | $2,929 | 2 | Not Rated |
| Piermichele | 2 | $2,859 | 16 | 4.96/5.0 |
| Giovanni | 1 | $2,834 | 15 | 5.00/5.0 |
Analyzing the strategies of top hosts, such as their property selection, pricing, and guest communication, can offer valuable lessons for optimizing your own Airbnb operations in Isolabona.
Dive Deeper: Advanced Isolabona STR Market Data (2026)
Ready to unlock more insights? AirROI provides access to advanced metrics and comprehensive Airbnb data for Isolabona. Explore detailed analytics beyond this report to refine your investment strategy, optimize pricing, and maximize your vacation rental profits.
Explore Advanced MetricsIsolabona Short-Term Rental Market Composition (2026): Property & Room Types
Room Type Distribution
Property Type Distribution
Market Composition Insights for Isolabona
- The Isolabona Airbnb market composition is heavily skewed towards Entire Home/Apt listings, which make up 100% of the 23 active rentals. This indicates strong guest preference for privacy and space.
- Looking at the property type distribution in Isolabona, Apartment/Condo properties are the most common (47.8%), reflecting the local real estate landscape.
- Houses represent a significant 30.4% portion, catering likely to families or larger groups.
Isolabona Airbnb Room Capacity Analysis (2026): Bedroom Distribution
Distribution of Listings by Number of Bedrooms
Room Capacity Insights for Isolabona
- The dominant room capacity in Isolabona is 1 bedroom listings, making up 39.1% of the market. This suggests a strong demand for properties suitable for couples or solo travelers.
- Together, 1 bedroom and 2 bedrooms properties represent 78.2% of the active Airbnb listings in Isolabona, indicating a high concentration in these sizes.
Isolabona Vacation Rental Guest Capacity Trends (2026)
Distribution of Listings by Guest Capacity
Guest Capacity Insights for Isolabona
- The most common guest capacity trend in Isolabona vacation rentals is listings accommodating 4 guests (30.4%). This suggests the primary traveler segment is likely small families or groups.
- Properties designed for 4 guests and 2 guests dominate the Isolabona STR market, accounting for 56.5% of listings.
- 26.0% of properties accommodate 6+ guests, serving the market segment for larger families or group travel in Isolabona.
- On average, properties in Isolabona are equipped to host 4.2 guests.
Isolabona Airbnb Booking Patterns (2026): Available vs. Booked Days
Available Days Distribution
Booked Days Distribution
Booking Pattern Insights for Isolabona
- The most common availability pattern in Isolabona falls within the 271-366 days range, representing 82.6% of listings. This suggests many properties have significant open periods on their calendars.
- Approximately 95.6% of listings show high availability (181+ days open annually), indicating potential for increased bookings or specific owner usage patterns.
- For booked days, the 1-30 days range is most frequent in Isolabona (52.2%), reflecting common guest stay durations or potential owner blocking patterns.
- A notable 4.3% of properties secure long booking periods (181+ days booked per year), highlighting successful long-term rental strategies or significant owner usage.
Isolabona Airbnb Minimum Stay Requirements Analysis
Distribution of Listings by Minimum Night Requirement
1 Night
10 listings
43.5% of total
2 Nights
3 listings
13% of total
3 Nights
2 listings
8.7% of total
4-6 Nights
1 listings
4.3% of total
7-29 Nights
1 listings
4.3% of total
30+ Nights
6 listings
26.1% of total
Key Insights
- The most prevalent minimum stay requirement in Isolabona is 1 Night, adopted by 43.5% of listings. This highlights the market's preference for shorter, flexible bookings.
- A significant segment (26.1%) caters to monthly stays (30+ nights) in Isolabona, pointing to opportunities in the extended-stay market.
Recommendations
- Align with the market by considering a 1 Night minimum stay, as 43.5% of Isolabona hosts use this setting.
- Explore offering discounts for stays of 30+ nights to attract the 26.1% of the market seeking extended stays.
- Adjust minimum nights based on seasonality – potentially shorter during low season and longer during peak demand periods in Isolabona.
Isolabona Airbnb Cancellation Policy Trends Analysis (2026)
Flexible
6 listings
26.1% of total
Moderate
10 listings
43.5% of total
Firm
7 listings
30.4% of total
Cancellation Policy Insights for Isolabona
- The prevailing Airbnb cancellation policy trend in Isolabona is Moderate, used by 43.5% of listings.
- There's a relatively balanced mix between guest-friendly (69.6%) and stricter (30.4%) policies, offering choices for different guest needs.
Recommendations for Hosts
- Consider adopting a Moderate policy to align with the 43.5% market standard in Isolabona.
- Regularly review your cancellation policy against competitors and market demand shifts in Isolabona.
Isolabona STR Booking Lead Time Analysis (2026)
Average Booking Lead Time by Month
Booking Lead Time Insights for Isolabona
- The overall average booking lead time for vacation rentals in Isolabona is 51 days.
- Guests book furthest in advance for stays during July (average 83 days), likely coinciding with peak travel demand or local events.
- The shortest booking windows occur for stays in March (average 9 days), indicating more last-minute travel plans during this time.
- Seasonally, Summer (69 days avg.) sees the longest lead times, while Spring (27 days avg.) has the shortest, reflecting typical travel planning cycles.
Recommendations for Hosts
- Use the overall average lead time (51 days) as a baseline for your pricing and availability strategy in Isolabona.
- For July stays, consider implementing length-of-stay discounts or slightly higher rates for bookings made less than 83 days out to capitalize on advance planning.
- During March, focus on last-minute booking availability and promotions, as guests book with very short notice (9 days avg.).
- Target marketing efforts for the Summer season well in advance (at least 69 days) to capture early planners.
- Monitor your own booking lead times against these Isolabona averages to identify opportunities for dynamic pricing adjustments.
Popular & Essential Airbnb Amenities in Isolabona (2026)
Amenity Prevalence
Amenity Insights for Isolabona
- Essential amenities in Isolabona that guests expect include: Kitchen. Lacking these (this) could significantly impact bookings.
- Popular amenities like Cooking basics, Hot water, Stove are common but not universal. Offering these can provide a competitive edge.
Recommendations for Hosts
- Ensure your listing includes all essential amenities for Isolabona: Kitchen.
- Consider adding popular differentiators like Cooking basics or Hot water to increase appeal.
- Highlight unique or less common amenities you offer (e.g., hot tub, dedicated workspace, EV charger) in your listing description and photos.
- Regularly check competitor amenities in Isolabona to stay competitive.
Isolabona Airbnb Guest Demographics & Profile Analysis (2026)
Guest Profile Summary for Isolabona
- The typical guest profile for Airbnb in Isolabona consists of predominantly international visitors (88%), with top international origins including Italy, typically belonging to the Post-2000s (Gen Z/Alpha) group (50%), primarily speaking French or English.
- Domestic travelers account for 11.6% of guests.
- Key international markets include France (65.1%) and Italy (11.6%).
- Top languages spoken are French (34.5%) followed by English (32.8%).
- A significant demographic segment is the Post-2000s (Gen Z/Alpha) group, representing 50% of guests.
Recommendations for Hosts
- Focus marketing internationally, particularly towards travelers from Italy.
- Offer listing details and communication support in French.
- Tailor amenities and listing descriptions to appeal to the dominant Post-2000s (Gen Z/Alpha) demographic (e.g., highlight fast WiFi, smart home features, local guides).
- Highlight unique local experiences or amenities relevant to the primary guest profile.
- Consider seasonal promotions aligned with peak travel times for key origin markets.
Nearby Short-Term Rental Market Comparison
How does the Isolabona Airbnb market stack up against its neighbors? Compare key performance metrics like average monthly revenue, ADR, and occupancy rates in surrounding areas to understand the broader regional STR landscape.
| Market | Active Properties | Monthly Revenue | Daily Rate | Avg. Occupancy |
|---|---|---|---|---|
| Monteu Roero | 12 | $5,184 | $403.07 | 41% |
| Ramatuelle | 231 | $4,086 | $662.31 | 40% |
| Saint-Jean-Cap-Ferrat | 114 | $3,894 | $465.00 | 44% |
| Cassinasco | 19 | $3,887 | $718.39 | 40% |
| Cossano Belbo | 15 | $3,763 | $326.53 | 36% |
| Saint-Tropez | 847 | $3,591 | $514.76 | 39% |
| Monaco | 193 | $3,208 | $490.13 | 36% |
| Opio | 41 | $3,101 | $542.89 | 41% |
| Villefranche-sur-Mer | 494 | $3,095 | $295.76 | 50% |
| Tourrettes-sur-Loup | 168 | $3,021 | $399.67 | 44% |