Tivoli Airbnb Market Analysis 2026: Short Term Rental Data & Vacation Rental Statistics in Lazio, Italy
Is Airbnb profitable in Tivoli in 2026? Explore comprehensive Airbnb analytics for Tivoli, Lazio, Italy to uncover income potential. This 2026 STR market report for Tivoli, based on AirROI data from February 2025 to January 2026, reveals key trends in the niche market of 129 active listings.
Whether you're considering an Airbnb investment in Tivoli, optimizing your existing vacation rental, or exploring rental arbitrage opportunities, understanding the Tivoli Airbnb data is crucial. Navigating the high regulation landscape is key to maximizing your short term rental income potential. Let's dive into the specifics.
Key Tivoli Airbnb Performance Metrics Overview
Monthly Airbnb Revenue Variations & Income Potential in Tivoli (2026)
Understanding the monthly revenue variations for Airbnb listings in Tivoli is key to maximizing your short term rental income potential. Seasonality significantly impacts earnings. Our analysis, based on data from the past 12 months, shows that the peak revenue month for STRs in Tivoli is typically August, while January often presents the lowest earnings, highlighting opportunities for strategic pricing adjustments during shoulder and low seasons. Explore the typical Airbnb income in Tivoli across different performance tiers:
- Best-in-class properties (Top 10%) achieve $2,299+ monthly, often utilizing dynamic pricing and superior guest experiences.
- Strong performing properties (Top 25%) earn $1,548 or more, indicating effective management and desirable locations/amenities.
- Typical properties (Median) generate around $955 per month, representing the average market performance.
- Entry-level properties (Bottom 25%) see earnings around $486, often with potential for optimization.
Average Monthly Airbnb Earnings Trend in Tivoli
Tivoli Airbnb Occupancy Rate Trends (2026)
Maximize your bookings by understanding the Tivoli STR occupancy trends. Seasonal demand shifts significantly influence how often properties are booked. Typically, Augustsees the highest demand (peak season occupancy), while January experiences the lowest (low season). Effective strategies, like adjusting minimum stays or offering promotions, can boost occupancy during slower periods. Here's how different property tiers perform in Tivoli:
- Best-in-class properties (Top 10%) achieve 64%+ occupancy, indicating high desirability and potentially optimized availability.
- Strong performing properties (Top 25%) maintain 50% or higher occupancy, suggesting good market fit and guest satisfaction.
- Typical properties (Median) have an occupancy rate around 31%.
- Entry-level properties (Bottom 25%) average 16% occupancy, potentially facing higher vacancy.
Average Monthly Occupancy Rate Trend in Tivoli
Average Daily Rate (ADR) Airbnb Trends in Tivoli (2026)
Effective short term rental pricing strategy in Tivoli involves understanding monthly ADR fluctuations. The Average Daily Rate (ADR) for Airbnb in Tivoli typically peaks in August and dips lowest during February. Leveraging Airbnb dynamic pricing tools or strategies based on this seasonality can significantly boost revenue. Here's a look at the typical nightly rates achieved:
- Best-in-class properties (Top 10%) command rates of $170+ per night, often due to premium features or locations.
- Strong performing properties (Top 25%) achieve nightly rates of $127 or more.
- Typical properties (Median) charge around $97 per night.
- Entry-level properties (Bottom 25%) earn around $79 per night.
Average Daily Rate (ADR) Trend by Month in Tivoli
Get Live Tivoli Market Intelligence 👇

Explore Real-time Analytics
Airbnb Seasonality Analysis & Trends in Tivoli (2026)
Peak Season (August, October, September)
- Revenue averages $1,458 per month
- Occupancy rates average 40.6%
- Daily rates average $116
Shoulder Season
- Revenue averages $1,230 per month
- Occupancy maintains around 37.0%
- Daily rates hold near $112
Low Season (January, February, November)
- Revenue drops to average $712 per month
- Occupancy decreases to average 23.4%
- Daily rates adjust to average $109
Seasonality Insights for Tivoli
- The Airbnb seasonality in Tivoli shows highly seasonal trends requiring careful strategy. While the sections above show seasonal averages, it's also insightful to look at the extremes:
- During the high season, the absolute peak month showcases Tivoli's highest earning potential, with monthly revenues capable of climbing to $1,566, occupancy reaching a high of 42.2%, and ADRs peaking at $121.
- Conversely, the slowest single month of the year, typically falling within the low season, marks the market's lowest point. In this month, revenue might dip to $595, occupancy could drop to 18.6%, and ADRs may adjust down to $106.
- Understanding both the seasonal averages and these monthly peaks and troughs in revenue, occupancy, and ADR is crucial for maximizing your Airbnb profit potential in Tivoli.
Seasonal Strategies for Maximizing Profit
- Peak Season: Maximize revenue through premium pricing and potentially longer minimum stays. Ensure high availability.
- Low Season: Offer competitive pricing, special promotions (e.g., extended stay discounts), and flexible cancellation policies. Target off-season travelers like remote workers or budget-conscious guests.
- Shoulder Seasons: Implement dynamic pricing that balances peak and low rates. Target weekend travelers or specific events. Offer slightly more flexible terms than peak season.
- Regularly analyze your own performance against these Tivoli seasonality benchmarks and adjust your pricing and availability strategy accordingly.
Best Areas for Airbnb Investment in Tivoli (2026)
Exploring the top neighborhoods for short-term rentals in Tivoli? This section highlights key areas, outlining why they are attractive for hosts and guests, along with notable local attractions. Consider these locations based on your target guest profile and investment strategy.
| Neighborhood / Area | Why Host Here? (Target Guests & Appeal) | Key Attractions & Landmarks |
|---|---|---|
| Villa d'Este | Famous for its stunning gardens and Renaissance architecture, Villa d'Este attracts tourists from all over the world. An ideal location for travelers seeking a historical experience. | Villa d'Este Gardens, Parco Villa Gregoriana, Tivoli's Historic Town Center, Tempio di Vesta, Historic Waterfalls |
| Hadrian's Villa (Villa Adriana) | An ancient Roman archaeological complex, Hadrian's Villa is a UNESCO World Heritage site, making it a must-visit for history enthusiasts and tourists alike. | Hadrian's Villa, Museo della Città di Tivoli, Arch of the Emperor Hadrian, Ancient Roman Ruins, Scenic Views of the Tiburtini Mountains |
| Tivoli Terme | Known for its thermal baths and wellness centers, Tivoli Terme offers a relaxing getaway for guests seeking rejuvenation and pampering. | Terme di Roma, Acque Albule Thermal Springs, Spas and Wellness Centers, Restaurant and Leisure Facilities, Nature Walks in the Surrounding Hills |
| La Civita | A charming neighborhood with medieval origins and beautiful landscapes, offering a peaceful retreat for visitors who enjoy walking and exploring historic towns. | Civita di Bagnoregio, Scenic Trails, Local Artisan Shops, Panoramic Views, Historical Landmarks |
| Rocca Pia | This area is known for its medieval fortress offering breathtaking views of Tivoli and the surrounding countryside, ideal for tourists interested in history and stunning vistas. | Rocca Pia Fortress, Walking Trails, Local Cuisine Restaurants, Cultural Festivals, Historical Architecture |
| Centro Storico | Tivoli's historical center boasts narrow streets filled with shops, restaurants, and cafes, perfect for guests wanting to immerse themselves in local culture. | Piazza Garibaldi, Local Markets, Historical Churches, Cafes and Gelaterias, Artisan Shops |
| Parco Nazionale dei Castelli Romani | A nearby national park that offers hiking, picnicking, and nature exploration, appealing to outdoor enthusiasts and nature lovers. | Hiking Trails, Local Wildlife, Beautiful Scenery, Authentic Italian Restaurants, Lakes and Villages |
| Tivoli Fountain Squares | Renowned for its beautiful public squares with fountains and gardens, it's ideal for leisurely visits and outdoor gatherings for tourists. | Piazza Trento, Giardini della Villa Alegre, Local Street Performers, Beautiful Landscape, Event Venues |
Understanding Airbnb License Requirements & STR Laws in Tivoli (2026)
Yes, Tivoli, Lazio, Italy enforces high STR regulations. Obtaining a license and ensuring compliance is almost certainly required according to current 2026 STR laws. Always verify the latest short term rental regulations and Airbnb license requirements directly with local government authorities for Tivoli to ensure full compliance before hosting.
(Source: AirROI data, 2026, based on 91% licensed listings)
Top Performing Airbnb Properties in Tivoli (2026)
Benchmark your potential! Explore examples of top-performing Airbnb properties in Tivolibased on Trailing Twelve Month (TTM) revenue. Analyze their characteristics, revenue, occupancy rate, and ADR to understand what drives success in this market.
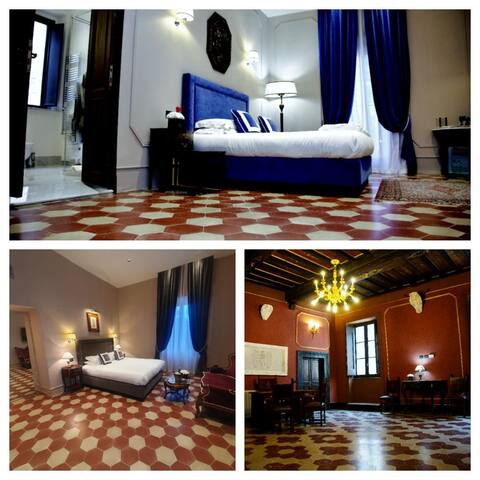
Historic Residence in a 17th-century Palazzo
Private Room • 3 bedrooms
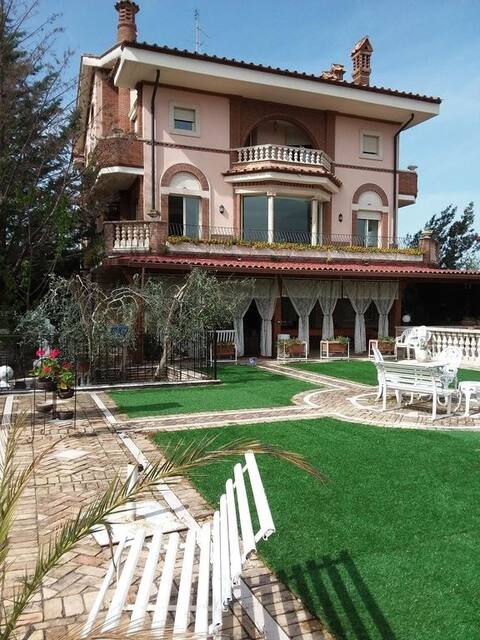
Elegant Art Nouveau-style villa.
Entire Place • 6 bedrooms

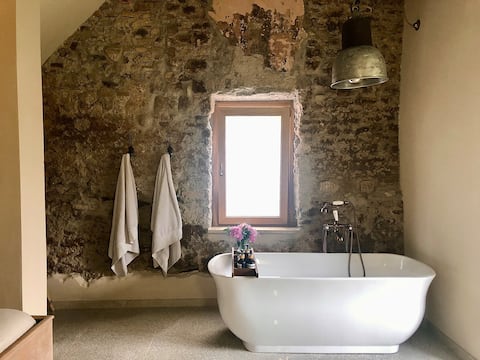
Apartment on Villa d 'Este!
Entire Place • 2 bedrooms
Amaretto
Entire Place • 1 bedroom

Sant' Andrea 7 - Fast WiFi
Entire Place • 1 bedroom

TCH-Domus Albula - Terrace and Fast WiFi
Entire Place • 2 bedrooms
Note: Performance varies based on location, size, amenities, seasonality, and management quality. Data reflects the past 12 months.
Top Performing Airbnb Hosts in Tivoli (2026)
Learn from the best! This table showcases top-performing Airbnb hosts in Tivoli based on the number of properties managed and estimated total revenue over the past year. Analyze their scale and performance metrics.
| Host Name | Properties | Grossing Revenue | Stay Reviews | Avg Rating |
|---|---|---|---|---|
| Giulio | 5 | $89,436 | 140 | 4.87/5.0 |
| Cecilia | 2 | $52,084 | 308 | 4.95/5.0 |
| Sara | 1 | $41,239 | 4 | 5.00/5.0 |
| Veronica | 2 | $36,396 | 92 | 5.00/5.0 |
| Lucia | 1 | $35,548 | 7 | 4.43/5.0 |
| Massimiliano | 1 | $34,202 | 43 | 5.00/5.0 |
| Stefano | 2 | $30,599 | 250 | 4.91/5.0 |
| Giovanni | 2 | $30,171 | 100 | 4.92/5.0 |
| Giulio | 1 | $28,802 | 26 | 4.92/5.0 |
| Tommaso | 2 | $27,099 | 237 | 4.67/5.0 |
Analyzing the strategies of top hosts, such as their property selection, pricing, and guest communication, can offer valuable lessons for optimizing your own Airbnb operations in Tivoli.
Dive Deeper: Advanced Tivoli STR Market Data (2026)
Ready to unlock more insights? AirROI provides access to advanced metrics and comprehensive Airbnb data for Tivoli. Explore detailed analytics beyond this report to refine your investment strategy, optimize pricing, and maximize your vacation rental profits.
Explore Advanced MetricsTivoli Short-Term Rental Market Composition (2026): Property & Room Types
Room Type Distribution
Property Type Distribution
Market Composition Insights for Tivoli
- The Tivoli Airbnb market composition is heavily skewed towards Entire Home/Apt listings, which make up 85.3% of the 129 active rentals. This indicates strong guest preference for privacy and space.
- Looking at the property type distribution in Tivoli, Apartment/Condo properties are the most common (68.2%), reflecting the local real estate landscape.
- Houses represent a significant 22.5% portion, catering likely to families or larger groups.
- The presence of 8.5% Hotel/Boutique listings indicates integration with traditional hospitality.
- Smaller segments like unique stays (combined 0.8%) offer potential for unique stay experiences.
Tivoli Airbnb Room Capacity Analysis (2026): Bedroom Distribution
Distribution of Listings by Number of Bedrooms
Room Capacity Insights for Tivoli
- The dominant room capacity in Tivoli is 1 bedroom listings, making up 53.5% of the market. This suggests a strong demand for properties suitable for couples or solo travelers.
- Together, 1 bedroom and 2 bedrooms properties represent 83.0% of the active Airbnb listings in Tivoli, indicating a high concentration in these sizes.
- With over half the market (53.5%) consisting of studios or 1-bedroom units, Tivoli is particularly well-suited for individuals or couples.
- Listings with 3+ bedrooms (7.0%) represent a smaller niche, potentially indicating an underserved market for larger group accommodations in Tivoli.
Tivoli Vacation Rental Guest Capacity Trends (2026)
Distribution of Listings by Guest Capacity
Guest Capacity Insights for Tivoli
- The most common guest capacity trend in Tivoli vacation rentals is listings accommodating 4 guests (32.6%). This suggests the primary traveler segment is likely small families or groups.
- Properties designed for 4 guests and 2 guests dominate the Tivoli STR market, accounting for 56.6% of listings.
- 10.9% of properties accommodate 6+ guests, serving the market segment for larger families or group travel in Tivoli.
- On average, properties in Tivoli are equipped to host 3.4 guests.
Tivoli Airbnb Booking Patterns (2026): Available vs. Booked Days
Available Days Distribution
Booked Days Distribution
Booking Pattern Insights for Tivoli
- The most common availability pattern in Tivoli falls within the 271-366 days range, representing 51.2% of listings. This suggests many properties have significant open periods on their calendars.
- Approximately 89.2% of listings show high availability (181+ days open annually), indicating potential for increased bookings or specific owner usage patterns.
- For booked days, the 91-180 days range is most frequent in Tivoli (34.9%), reflecting common guest stay durations or potential owner blocking patterns.
- A notable 14.8% of properties secure long booking periods (181+ days booked per year), highlighting successful long-term rental strategies or significant owner usage.
Tivoli Airbnb Minimum Stay Requirements Analysis
Distribution of Listings by Minimum Night Requirement
1 Night
67 listings
51.9% of total
2 Nights
31 listings
24% of total
3 Nights
1 listings
0.8% of total
7-29 Nights
5 listings
3.9% of total
30+ Nights
25 listings
19.4% of total
Key Insights
- The most prevalent minimum stay requirement in Tivoli is 1 Night, adopted by 51.9% of listings. This highlights the market's preference for shorter, flexible bookings.
- A strong majority (75.9%) of the Tivoli Airbnb data shows acceptance of very short stays (1-2 nights), indicating a dynamic, high-turnover market.
- A significant segment (19.4%) caters to monthly stays (30+ nights) in Tivoli, pointing to opportunities in the extended-stay market.
Recommendations
- Align with the market by considering a 1 Night minimum stay, as 51.9% of Tivoli hosts use this setting.
- Explore offering discounts for stays of 30+ nights to attract the 19.4% of the market seeking extended stays.
- Adjust minimum nights based on seasonality – potentially shorter during low season and longer during peak demand periods in Tivoli.
Tivoli Airbnb Cancellation Policy Trends Analysis (2026)
Flexible
64 listings
50% of total
Moderate
59 listings
46.1% of total
Firm
4 listings
3.1% of total
Strict
1 listings
0.8% of total
Cancellation Policy Insights for Tivoli
- The prevailing Airbnb cancellation policy trend in Tivoli is Flexible, used by 50% of listings.
- The market strongly favors guest-friendly terms, with 96.1% of listings offering Flexible or Moderate policies. This suggests guests in Tivoli may expect booking flexibility.
- Strict cancellation policies are quite rare (0.8%), potentially making listings with this policy less competitive unless justified by high demand or property type.
Recommendations for Hosts
- Consider adopting a Flexible policy to align with the 50% market standard in Tivoli.
- Using a Strict policy might deter some guests, as only 0.8% of listings use it. Evaluate if potential revenue protection outweighs possible lower booking rates.
- Regularly review your cancellation policy against competitors and market demand shifts in Tivoli.
Tivoli STR Booking Lead Time Analysis (2026)
Average Booking Lead Time by Month
Booking Lead Time Insights for Tivoli
- The overall average booking lead time for vacation rentals in Tivoli is 41 days.
- Guests book furthest in advance for stays during August (average 62 days), likely coinciding with peak travel demand or local events.
- The shortest booking windows occur for stays in February (average 19 days), indicating more last-minute travel plans during this time.
- Seasonally, Summer (53 days avg.) sees the longest lead times, while Winter (29 days avg.) has the shortest, reflecting typical travel planning cycles.
Recommendations for Hosts
- Use the overall average lead time (41 days) as a baseline for your pricing and availability strategy in Tivoli.
- For August stays, consider implementing length-of-stay discounts or slightly higher rates for bookings made less than 62 days out to capitalize on advance planning.
- Target marketing efforts for the Summer season well in advance (at least 53 days) to capture early planners.
- Monitor your own booking lead times against these Tivoli averages to identify opportunities for dynamic pricing adjustments.
Popular & Essential Airbnb Amenities in Tivoli (2026)
Amenity Prevalence
Amenity Insights for Tivoli
- Popular amenities like Wifi, Heating, Hair dryer are common but not universal. Offering these can provide a competitive edge.
- Warning: Wifi is not universally provided but is considered essential globally. Ensure reliable Wifi is offered.
Recommendations for Hosts
- Consider adding popular differentiators like Wifi or Heating to increase appeal.
- Highlight unique or less common amenities you offer (e.g., hot tub, dedicated workspace, EV charger) in your listing description and photos.
- Regularly check competitor amenities in Tivoli to stay competitive.
Tivoli Airbnb Guest Demographics & Profile Analysis (2026)
Guest Profile Summary for Tivoli
- The typical guest profile for Airbnb in Tivoli consists of predominantly international visitors (79%), with top international origins including Italy, typically belonging to the Post-2000s (Gen Z/Alpha) group (50%), primarily speaking English or Italian.
- Domestic travelers account for 20.8% of guests.
- Key international markets include United States (25.9%) and Italy (20.8%).
- Top languages spoken are English (44.1%) followed by Italian (14.4%).
- A significant demographic segment is the Post-2000s (Gen Z/Alpha) group, representing 50% of guests.
Recommendations for Hosts
- Focus marketing internationally, particularly towards travelers from Italy.
- Tailor amenities and listing descriptions to appeal to the dominant Post-2000s (Gen Z/Alpha) demographic (e.g., highlight fast WiFi, smart home features, local guides).
- Highlight unique local experiences or amenities relevant to the primary guest profile.
- Consider seasonal promotions aligned with peak travel times for key origin markets.
Nearby Short-Term Rental Market Comparison
How does the Tivoli Airbnb market stack up against its neighbors? Compare key performance metrics like average monthly revenue, ADR, and occupancy rates in surrounding areas to understand the broader regional STR landscape.
| Market | Active Properties | Monthly Revenue | Daily Rate | Avg. Occupancy |
|---|---|---|---|---|
| Celleno | 13 | $4,041 | $594.80 | 28% |
| Collevecchio | 14 | $3,140 | $334.97 | 40% |
| Palombara Sabina | 15 | $2,914 | $309.11 | 38% |
| Rome | 26,470 | $2,817 | $217.07 | 50% |
| Guardea | 14 | $2,703 | $415.58 | 33% |
| Allerona | 11 | $2,681 | $453.63 | 36% |
| Parrano | 18 | $2,610 | $326.63 | 34% |
| Monteleone d'Orvieto | 35 | $2,564 | $331.04 | 31% |
| Massa Martana | 26 | $2,448 | $330.96 | 36% |
| San Casciano dei Bagni | 52 | $2,354 | $399.89 | 35% |