Sabaudia Airbnb Market Analysis 2026: Short Term Rental Data & Vacation Rental Statistics in Lazio, Italy
Is Airbnb profitable in Sabaudia in 2026? Explore comprehensive Airbnb analytics for Sabaudia, Lazio, Italy to uncover income potential. This 2026 STR market report for Sabaudia, based on AirROI data from February 2025 to January 2026, reveals key trends in the niche market of 90 active listings.
Whether you're considering an Airbnb investment in Sabaudia, optimizing your existing vacation rental, or exploring rental arbitrage opportunities, understanding the Sabaudia Airbnb data is crucial. Navigating the high regulation landscape is key to maximizing your short term rental income potential. Let's dive into the specifics.
Key Sabaudia Airbnb Performance Metrics Overview
Monthly Airbnb Revenue Variations & Income Potential in Sabaudia (2026)
Understanding the monthly revenue variations for Airbnb listings in Sabaudia is key to maximizing your short term rental income potential. Seasonality significantly impacts earnings. Our analysis, based on data from the past 12 months, shows that the peak revenue month for STRs in Sabaudia is typically August, while January often presents the lowest earnings, highlighting opportunities for strategic pricing adjustments during shoulder and low seasons. Explore the typical Airbnb income in Sabaudia across different performance tiers:
- Best-in-class properties (Top 10%) achieve $3,165+ monthly, often utilizing dynamic pricing and superior guest experiences.
- Strong performing properties (Top 25%) earn $1,969 or more, indicating effective management and desirable locations/amenities.
- Typical properties (Median) generate around $1,090 per month, representing the average market performance.
- Entry-level properties (Bottom 25%) see earnings around $498, often with potential for optimization.
Average Monthly Airbnb Earnings Trend in Sabaudia
Sabaudia Airbnb Occupancy Rate Trends (2026)
Maximize your bookings by understanding the Sabaudia STR occupancy trends. Seasonal demand shifts significantly influence how often properties are booked. Typically, Augustsees the highest demand (peak season occupancy), while January experiences the lowest (low season). Effective strategies, like adjusting minimum stays or offering promotions, can boost occupancy during slower periods. Here's how different property tiers perform in Sabaudia:
- Best-in-class properties (Top 10%) achieve 57%+ occupancy, indicating high desirability and potentially optimized availability.
- Strong performing properties (Top 25%) maintain 39% or higher occupancy, suggesting good market fit and guest satisfaction.
- Typical properties (Median) have an occupancy rate around 23%.
- Entry-level properties (Bottom 25%) average 10% occupancy, potentially facing higher vacancy.
Average Monthly Occupancy Rate Trend in Sabaudia
Average Daily Rate (ADR) Airbnb Trends in Sabaudia (2026)
Effective short term rental pricing strategy in Sabaudia involves understanding monthly ADR fluctuations. The Average Daily Rate (ADR) for Airbnb in Sabaudia typically peaks in September and dips lowest during February. Leveraging Airbnb dynamic pricing tools or strategies based on this seasonality can significantly boost revenue. Here's a look at the typical nightly rates achieved:
- Best-in-class properties (Top 10%) command rates of $359+ per night, often due to premium features or locations.
- Strong performing properties (Top 25%) achieve nightly rates of $215 or more.
- Typical properties (Median) charge around $140 per night.
- Entry-level properties (Bottom 25%) earn around $107 per night.
Average Daily Rate (ADR) Trend by Month in Sabaudia
Get Live Sabaudia Market Intelligence 👇

Explore Real-time Analytics
Airbnb Seasonality Analysis & Trends in Sabaudia (2026)
Peak Season (August, July, June)
- Revenue averages $3,329 per month
- Occupancy rates average 45.7%
- Daily rates average $207
Shoulder Season
- Revenue averages $1,258 per month
- Occupancy maintains around 23.3%
- Daily rates hold near $203
Low Season (January, February, November)
- Revenue drops to average $584 per month
- Occupancy decreases to average 16.5%
- Daily rates adjust to average $204
Seasonality Insights for Sabaudia
- The Airbnb seasonality in Sabaudia shows highly seasonal trends requiring careful strategy. While the sections above show seasonal averages, it's also insightful to look at the extremes:
- During the high season, the absolute peak month showcases Sabaudia's highest earning potential, with monthly revenues capable of climbing to $3,967, occupancy reaching a high of 57.4%, and ADRs peaking at $220.
- Conversely, the slowest single month of the year, typically falling within the low season, marks the market's lowest point. In this month, revenue might dip to $519, occupancy could drop to 10.7%, and ADRs may adjust down to $189.
- Understanding both the seasonal averages and these monthly peaks and troughs in revenue, occupancy, and ADR is crucial for maximizing your Airbnb profit potential in Sabaudia.
Seasonal Strategies for Maximizing Profit
- Peak Season: Maximize revenue through premium pricing and potentially longer minimum stays. Ensure high availability.
- Low Season: Offer competitive pricing, special promotions (e.g., extended stay discounts), and flexible cancellation policies. Target off-season travelers like remote workers or budget-conscious guests.
- Shoulder Seasons: Implement dynamic pricing that balances peak and low rates. Target weekend travelers or specific events. Offer slightly more flexible terms than peak season.
- Regularly analyze your own performance against these Sabaudia seasonality benchmarks and adjust your pricing and availability strategy accordingly.
Best Areas for Airbnb Investment in Sabaudia (2026)
Exploring the top neighborhoods for short-term rentals in Sabaudia? This section highlights key areas, outlining why they are attractive for hosts and guests, along with notable local attractions. Consider these locations based on your target guest profile and investment strategy.
| Neighborhood / Area | Why Host Here? (Target Guests & Appeal) | Key Attractions & Landmarks |
|---|---|---|
| Centro Storico | The historic center of Sabaudia is charming and attracts visitors for its rich culture and history. It's a prime location for tourists who appreciate authentic Italian architecture and local cuisine. | Church of Sant'Antonio, Piazza del Comune, Castello di Sabaudia, Local artisan shops, Cafés and trattorias |
| Lago di Paola | This serene lake area is perfect for nature lovers and families, offering activities such as swimming, kayaking, and picnics. It attracts visitors looking for relaxation near nature. | Lago di Paola, Birdwatching opportunities, Cycling paths, Picnic areas, Nature trails |
| Duna di Sabaudia | Known for its stunning sand dunes and natural beauty, this area attracts beachgoers and hikers looking for an adventure in a picturesque environment. | Duna di Sabaudia National Park, Secret beach spots, Hiking trails, Birdwatching, Photos of unique landscapes |
| Beachfront Sabaudia | Directly adjacent to the beautiful beaches of Sabaudia, this area is ideal for vacationers looking for sun, sand, and sea, making it popular among summer tourists. | Sabaudia Beach, Water sports, Beach restaurants, Beach clubs, Sunset views |
| Giardini di Sabaudia | Renowned for its lush gardens and parks, this neighborhood appeals to families and those interested in leisurely walks in well-maintained green spaces. | Giardini Pubblici, Piazza della Libertà, Children's playgrounds, Outdoor cafes, Local events |
| St. Felice Circeo | Close to Sabaudia, this area offers historical sites and beautiful coastal views, appealing to travelers interested in history and stunning landscapes. | Circeo National Park, Ancient ruins, Beaches, Hiking trails, Wildlife observation |
| Monte Circeo | A perfect spot for adventurous travelers, this mountainous area offers hiking and breathtaking views of the coast and surrounding nature, ideal for outdoor enthusiasts. | Monte Circeo National Park, Hiking trails, Panoramic views, Flora and fauna, Historical monuments |
| Local Vineyards | Wine lovers will enjoy the local vineyards around Sabaudia, providing wine tours and tastings, drawing visitors interested in gastronomy and local culture. | Local wine tours, Vineyards, Wine tasting events, Gastronomic experiences, Scenic countryside |
Understanding Airbnb License Requirements & STR Laws in Sabaudia (2026)
Yes, Sabaudia, Lazio, Italy enforces high STR regulations. Obtaining a license and ensuring compliance is almost certainly required according to current 2026 STR laws. Always verify the latest short term rental regulations and Airbnb license requirements directly with local government authorities for Sabaudia to ensure full compliance before hosting.
(Source: AirROI data, 2026, based on 74% licensed listings)
Top Performing Airbnb Properties in Sabaudia (2026)
Benchmark your potential! Explore examples of top-performing Airbnb properties in Sabaudiabased on Trailing Twelve Month (TTM) revenue. Analyze their characteristics, revenue, occupancy rate, and ADR to understand what drives success in this market.
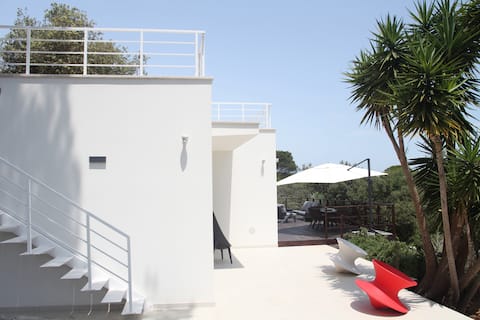
Modern villa 50 meters from the sea (3 bedrooms)
Entire Place • 3 bedrooms

Villa La Maestra at Circeo
Entire Place • 4 bedrooms

Unique Villa on the Sabaudia seafront
Entire Place • 6 bedrooms
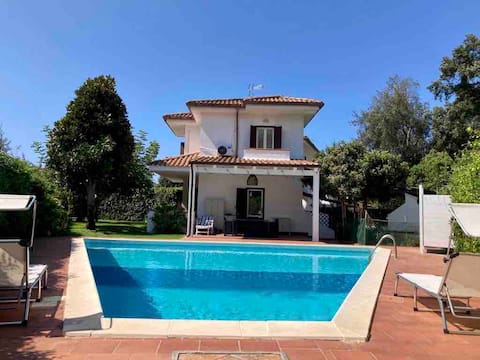
Villa with private pool in Sabaudia
Entire Place • 3 bedrooms
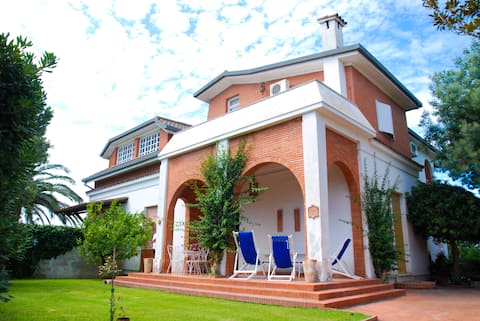
Sabaudia Home Circeo
Entire Place • 3 bedrooms

Luxury Villa Best Sea near Rome Sabaudia - Circeo
Entire Place • 3 bedrooms
Note: Performance varies based on location, size, amenities, seasonality, and management quality. Data reflects the past 12 months.
Top Performing Airbnb Hosts in Sabaudia (2026)
Learn from the best! This table showcases top-performing Airbnb hosts in Sabaudia based on the number of properties managed and estimated total revenue over the past year. Analyze their scale and performance metrics.
| Host Name | Properties | Grossing Revenue | Stay Reviews | Avg Rating |
|---|---|---|---|---|
| Alessandro | 1 | $78,924 | 3 | 5.00/5.0 |
| Sebastian | 5 | $50,507 | 49 | 4.48/5.0 |
| Aloisio | 2 | $38,897 | 19 | 4.53/5.0 |
| Manuela | 2 | $38,856 | 128 | 4.63/5.0 |
| Ginevra | 1 | $37,204 | 2 | Not Rated |
| Eleonora | 1 | $36,540 | 28 | 4.86/5.0 |
| Paolo | 1 | $30,055 | 28 | 4.79/5.0 |
| Giuseppe | 1 | $29,180 | 20 | 4.70/5.0 |
| Reginaldo | 1 | $28,833 | 34 | 4.88/5.0 |
| David | 1 | $28,722 | 21 | 5.00/5.0 |
Analyzing the strategies of top hosts, such as their property selection, pricing, and guest communication, can offer valuable lessons for optimizing your own Airbnb operations in Sabaudia.
Dive Deeper: Advanced Sabaudia STR Market Data (2026)
Ready to unlock more insights? AirROI provides access to advanced metrics and comprehensive Airbnb data for Sabaudia. Explore detailed analytics beyond this report to refine your investment strategy, optimize pricing, and maximize your vacation rental profits.
Explore Advanced MetricsSabaudia Short-Term Rental Market Composition (2026): Property & Room Types
Room Type Distribution
Property Type Distribution
Market Composition Insights for Sabaudia
- The Sabaudia Airbnb market composition is heavily skewed towards Entire Home/Apt listings, which make up 88.9% of the 90 active rentals. This indicates strong guest preference for privacy and space.
- Looking at the property type distribution in Sabaudia, House properties are the most common (66.7%), reflecting the local real estate landscape.
- Houses represent a significant 66.7% portion, catering likely to families or larger groups.
- Smaller segments like hotel/boutique, outdoor/unique, unique stays, others (combined 9.9%) offer potential for unique stay experiences.
Sabaudia Airbnb Room Capacity Analysis (2026): Bedroom Distribution
Distribution of Listings by Number of Bedrooms
Room Capacity Insights for Sabaudia
- The dominant room capacity in Sabaudia is 2 bedrooms listings, making up 37.8% of the market. This suggests a strong demand for properties suitable for couples or solo travelers.
- Together, 2 bedrooms and 3 bedrooms properties represent 56.7% of the active Airbnb listings in Sabaudia, indicating a high concentration in these sizes.
- A significant 32.3% of listings offer 3+ bedrooms, catering to larger groups and families seeking more space in Sabaudia.
Sabaudia Vacation Rental Guest Capacity Trends (2026)
Distribution of Listings by Guest Capacity
Guest Capacity Insights for Sabaudia
- The most common guest capacity trend in Sabaudia vacation rentals is listings accommodating 4 guests (31.1%). This suggests the primary traveler segment is likely small families or groups.
- Properties designed for 4 guests and 8+ guests dominate the Sabaudia STR market, accounting for 50.0% of listings.
- 38.9% of properties accommodate 6+ guests, serving the market segment for larger families or group travel in Sabaudia.
- On average, properties in Sabaudia are equipped to host 4.7 guests.
Sabaudia Airbnb Booking Patterns (2026): Available vs. Booked Days
Available Days Distribution
Booked Days Distribution
Booking Pattern Insights for Sabaudia
- The most common availability pattern in Sabaudia falls within the 271-366 days range, representing 82.2% of listings. This suggests many properties have significant open periods on their calendars.
- Approximately 98.9% of listings show high availability (181+ days open annually), indicating potential for increased bookings or specific owner usage patterns.
- For booked days, the 31-90 days range is most frequent in Sabaudia (43.3%), reflecting common guest stay durations or potential owner blocking patterns.
- A notable 1.1% of properties secure long booking periods (181+ days booked per year), highlighting successful long-term rental strategies or significant owner usage.
Sabaudia Airbnb Minimum Stay Requirements Analysis
Distribution of Listings by Minimum Night Requirement
1 Night
3 listings
3.3% of total
2 Nights
14 listings
15.6% of total
3 Nights
7 listings
7.8% of total
4-6 Nights
8 listings
8.9% of total
7-29 Nights
18 listings
20% of total
30+ Nights
40 listings
44.4% of total
Key Insights
- The most prevalent minimum stay requirement in Sabaudia is 30+ Nights, adopted by 44.4% of listings. This highlights the market's preference for longer commitments.
- Very short stays (1-2 nights) are less common (18.9%), suggesting hosts prefer slightly longer bookings to optimize turnover.
- A significant segment (44.4%) caters to monthly stays (30+ nights) in Sabaudia, pointing to opportunities in the extended-stay market.
Recommendations
- Align with the market by considering a 30+ Nights minimum stay, as 44.4% of Sabaudia hosts use this setting.
- If feasible, allowing 1-night stays, especially midweek or during low season, could capture last-minute bookings, as only 3.3% currently do.
- Explore offering discounts for stays of 30+ nights to attract the 44.4% of the market seeking extended stays.
- Adjust minimum nights based on seasonality – potentially shorter during low season and longer during peak demand periods in Sabaudia.
Sabaudia Airbnb Cancellation Policy Trends Analysis (2026)
Limited
1 listings
1.1% of total
Super Strict 60 Days
1 listings
1.1% of total
Super Strict 30 Days
1 listings
1.1% of total
Flexible
16 listings
17.8% of total
Moderate
38 listings
42.2% of total
Firm
23 listings
25.6% of total
Strict
10 listings
11.1% of total
Cancellation Policy Insights for Sabaudia
- The prevailing Airbnb cancellation policy trend in Sabaudia is Moderate, used by 42.2% of listings.
- There's a relatively balanced mix between guest-friendly (60.0%) and stricter (36.7%) policies, offering choices for different guest needs.
Recommendations for Hosts
- Consider adopting a Moderate policy to align with the 42.2% market standard in Sabaudia.
- Using a Strict policy might deter some guests, as only 11.1% of listings use it. Evaluate if potential revenue protection outweighs possible lower booking rates.
- Regularly review your cancellation policy against competitors and market demand shifts in Sabaudia.
Sabaudia STR Booking Lead Time Analysis (2026)
Average Booking Lead Time by Month
Booking Lead Time Insights for Sabaudia
- The overall average booking lead time for vacation rentals in Sabaudia is 39 days.
- Guests book furthest in advance for stays during August (average 71 days), likely coinciding with peak travel demand or local events.
- The shortest booking windows occur for stays in November (average 4 days), indicating more last-minute travel plans during this time.
- Seasonally, Summer (58 days avg.) sees the longest lead times, while Spring (17 days avg.) has the shortest, reflecting typical travel planning cycles.
Recommendations for Hosts
- Use the overall average lead time (39 days) as a baseline for your pricing and availability strategy in Sabaudia.
- For August stays, consider implementing length-of-stay discounts or slightly higher rates for bookings made less than 71 days out to capitalize on advance planning.
- During November, focus on last-minute booking availability and promotions, as guests book with very short notice (4 days avg.).
- Target marketing efforts for the Summer season well in advance (at least 58 days) to capture early planners.
- Monitor your own booking lead times against these Sabaudia averages to identify opportunities for dynamic pricing adjustments.
Popular & Essential Airbnb Amenities in Sabaudia (2026)
Amenity Prevalence
Amenity Insights for Sabaudia
- Essential amenities in Sabaudia that guests expect include: Kitchen, TV. Lacking these (any) could significantly impact bookings.
- Popular amenities like Free parking on premises, Dishes and silverware, Hot water are common but not universal. Offering these can provide a competitive edge.
Recommendations for Hosts
- Ensure your listing includes all essential amenities for Sabaudia: Kitchen, TV.
- Prioritize adding missing essentials: Kitchen, TV.
- Consider adding popular differentiators like Free parking on premises or Dishes and silverware to increase appeal.
- Highlight unique or less common amenities you offer (e.g., hot tub, dedicated workspace, EV charger) in your listing description and photos.
- Regularly check competitor amenities in Sabaudia to stay competitive.
Sabaudia Airbnb Guest Demographics & Profile Analysis (2026)
Guest Profile Summary for Sabaudia
- The typical guest profile for Airbnb in Sabaudia consists of a mix of domestic (58%) and international guests, often arriving from nearby Rome, typically belonging to the Post-2000s (Gen Z/Alpha) group (50%), primarily speaking English or Italian.
- Domestic travelers account for 58.3% of guests.
- Key international markets include Italy (58.3%) and United Kingdom (7%).
- Top languages spoken are English (37.1%) followed by Italian (25.3%).
- A significant demographic segment is the Post-2000s (Gen Z/Alpha) group, representing 50% of guests.
Recommendations for Hosts
- Balance marketing efforts between domestic and international channels based on the guest mix.
- Tailor amenities and listing descriptions to appeal to the dominant Post-2000s (Gen Z/Alpha) demographic (e.g., highlight fast WiFi, smart home features, local guides).
- Highlight unique local experiences or amenities relevant to the primary guest profile.
- Consider seasonal promotions aligned with peak travel times for key origin markets.
Nearby Short-Term Rental Market Comparison
How does the Sabaudia Airbnb market stack up against its neighbors? Compare key performance metrics like average monthly revenue, ADR, and occupancy rates in surrounding areas to understand the broader regional STR landscape.
| Market | Active Properties | Monthly Revenue | Daily Rate | Avg. Occupancy |
|---|---|---|---|---|
| Positano | 740 | $6,727 | $653.26 | 52% |
| Praiano | 365 | $4,340 | $447.02 | 50% |
| Celleno | 13 | $4,041 | $594.80 | 28% |
| Capri | 424 | $3,912 | $586.24 | 37% |
| Conca dei Marini | 132 | $3,899 | $417.87 | 45% |
| Sorrento | 1,606 | $3,821 | $344.29 | 48% |
| Massa Lubrense | 813 | $3,392 | $408.38 | 42% |
| Furore | 149 | $3,226 | $353.64 | 52% |
| Collevecchio | 14 | $3,140 | $334.97 | 40% |
| Amalfi | 506 | $3,135 | $319.20 | 45% |