Comeglians Airbnb Market Analysis 2026: Short Term Rental Data & Vacation Rental Statistics in Friuli – Venezia Giulia, Italy
Is Airbnb profitable in Comeglians in 2026? Explore comprehensive Airbnb analytics for Comeglians, Friuli – Venezia Giulia, Italy to uncover income potential. This 2026 STR market report for Comeglians, based on AirROI data from February 2025 to January 2026, reveals key trends in the niche market of 19 active listings.
Whether you're considering an Airbnb investment in Comeglians, optimizing your existing vacation rental, or exploring rental arbitrage opportunities, understanding the Comeglians Airbnb data is crucial. Navigating the high regulation landscape is key to maximizing your short term rental income potential. Let's dive into the specifics.
Key Comeglians Airbnb Performance Metrics Overview
Monthly Airbnb Revenue Variations & Income Potential in Comeglians (2026)
Understanding the monthly revenue variations for Airbnb listings in Comeglians is key to maximizing your short term rental income potential. Seasonality significantly impacts earnings. Our analysis, based on data from the past 12 months, shows that the peak revenue month for STRs in Comeglians is typically August, while October often presents the lowest earnings, highlighting opportunities for strategic pricing adjustments during shoulder and low seasons. Explore the typical Airbnb income in Comeglians across different performance tiers:
- Best-in-class properties (Top 10%) achieve $1,859+ monthly, often utilizing dynamic pricing and superior guest experiences.
- Strong performing properties (Top 25%) earn $1,256 or more, indicating effective management and desirable locations/amenities.
- Typical properties (Median) generate around $741 per month, representing the average market performance.
- Entry-level properties (Bottom 25%) see earnings around $372, often with potential for optimization.
Average Monthly Airbnb Earnings Trend in Comeglians
Comeglians Airbnb Occupancy Rate Trends (2026)
Maximize your bookings by understanding the Comeglians STR occupancy trends. Seasonal demand shifts significantly influence how often properties are booked. Typically, Augustsees the highest demand (peak season occupancy), while October experiences the lowest (low season). Effective strategies, like adjusting minimum stays or offering promotions, can boost occupancy during slower periods. Here's how different property tiers perform in Comeglians:
- Best-in-class properties (Top 10%) achieve 57%+ occupancy, indicating high desirability and potentially optimized availability.
- Strong performing properties (Top 25%) maintain 45% or higher occupancy, suggesting good market fit and guest satisfaction.
- Typical properties (Median) have an occupancy rate around 21%.
- Entry-level properties (Bottom 25%) average 10% occupancy, potentially facing higher vacancy.
Average Monthly Occupancy Rate Trend in Comeglians
Average Daily Rate (ADR) Airbnb Trends in Comeglians (2026)
Effective short term rental pricing strategy in Comeglians involves understanding monthly ADR fluctuations. The Average Daily Rate (ADR) for Airbnb in Comeglians typically peaks in January and dips lowest during April. Leveraging Airbnb dynamic pricing tools or strategies based on this seasonality can significantly boost revenue. Here's a look at the typical nightly rates achieved:
- Best-in-class properties (Top 10%) command rates of $240+ per night, often due to premium features or locations.
- Strong performing properties (Top 25%) achieve nightly rates of $173 or more.
- Typical properties (Median) charge around $129 per night.
- Entry-level properties (Bottom 25%) earn around $77 per night.
Average Daily Rate (ADR) Trend by Month in Comeglians
Get Live Comeglians Market Intelligence 👇
Explore Real-time Analytics
Airbnb Seasonality Analysis & Trends in Comeglians (2026)
Peak Season (August, February, July)
- Revenue averages $1,463 per month
- Occupancy rates average 45.3%
- Daily rates average $150
Shoulder Season
- Revenue averages $806 per month
- Occupancy maintains around 26.4%
- Daily rates hold near $147
Low Season (May, June, October)
- Revenue drops to average $583 per month
- Occupancy decreases to average 20.0%
- Daily rates adjust to average $144
Seasonality Insights for Comeglians
- The Airbnb seasonality in Comeglians shows highly seasonal trends requiring careful strategy. While the sections above show seasonal averages, it's also insightful to look at the extremes:
- During the high season, the absolute peak month showcases Comeglians's highest earning potential, with monthly revenues capable of climbing to $1,679, occupancy reaching a high of 50.0%, and ADRs peaking at $154.
- Conversely, the slowest single month of the year, typically falling within the low season, marks the market's lowest point. In this month, revenue might dip to $568, occupancy could drop to 15.7%, and ADRs may adjust down to $140.
- Understanding both the seasonal averages and these monthly peaks and troughs in revenue, occupancy, and ADR is crucial for maximizing your Airbnb profit potential in Comeglians.
Seasonal Strategies for Maximizing Profit
- Peak Season: Maximize revenue through premium pricing and potentially longer minimum stays. Ensure high availability.
- Low Season: Offer competitive pricing, special promotions (e.g., extended stay discounts), and flexible cancellation policies. Target off-season travelers like remote workers or budget-conscious guests.
- Shoulder Seasons: Implement dynamic pricing that balances peak and low rates. Target weekend travelers or specific events. Offer slightly more flexible terms than peak season.
- Regularly analyze your own performance against these Comeglians seasonality benchmarks and adjust your pricing and availability strategy accordingly.
Best Areas for Airbnb Investment in Comeglians (2026)
Exploring the top neighborhoods for short-term rentals in Comeglians? This section highlights key areas, outlining why they are attractive for hosts and guests, along with notable local attractions. Consider these locations based on your target guest profile and investment strategy.
| Neighborhood / Area | Why Host Here? (Target Guests & Appeal) | Key Attractions & Landmarks |
|---|---|---|
| Comeglians Center | The heart of Comeglians, offering local shops, cafes, and easy access to amenities. Ideal for visitors looking to experience authentic village life in a picturesque mountain setting. | Comeglians Church, Parco Naturale delle Prealpi Giulia, local markets, restaurants serving Friulano cuisine |
| Valle del But | Known for its stunning natural beauty and outdoor activities, this area attracts nature lovers and adventurers. Perfect for those looking to host guests seeking hiking, skiing, and tranquility. | Ski resort at Sauris, hiking trails, Lake Sauris, Grotte di Villanova |
| Frazione di Villa | A quaint and charming neighborhood with traditional architecture. Great for guests who want a peaceful retreat while still being close to nature and scenic views. | Local wineries, cultural festivals, beautiful villas, historic buildings |
| Forni di Sopra | A nearby ski resort town that offers winter sports and outdoor activities year-round, popular among those looking for a winter getaway or active summer holidays. | Forni di Sopra Ski Area, hiking paths, historical center, nature parks |
| Sauris | Famous for its unique culture and cuisine, especially the smoked prosciutto, drawing food lovers and culture enthusiasts. A picturesque village with stunning alpine surroundings. | Sauris Lake, Prosciutto di Sauris, Alpine villages, local gastronomy tours |
| Comeglians Valley | An area that provides beautiful landscapes and hiking opportunities, excellent for nature-oriented travelers looking for a peaceful escape in the mountains. | Scenic viewpoints, nature trails, cultural heritage sites, local wildlife |
| Torreano | A small hillside location offering panoramic views and rich local history, appealing to those interested in exploring less touristy spots. | Historic sites, breathtaking views, vineyards, local artisan shops |
| Ampezzano | A tranquil and scenic area known for its natural landscapes and adventure sports, great for outdoor enthusiasts looking to relax and explore nature. | Hiking and biking routes, natural parks, scenic views, outdoor adventure activities |
Understanding Airbnb License Requirements & STR Laws in Comeglians (2026)
Yes, Comeglians, Friuli – Venezia Giulia, Italy enforces high STR regulations. Obtaining a license and ensuring compliance is almost certainly required according to current 2026 STR laws. Always verify the latest short term rental regulations and Airbnb license requirements directly with local government authorities for Comeglians to ensure full compliance before hosting.
(Source: AirROI data, 2026, based on 95% licensed listings)
Top Performing Airbnb Properties in Comeglians (2026)
Benchmark your potential! Explore examples of top-performing Airbnb properties in Comegliansbased on Trailing Twelve Month (TTM) revenue. Analyze their characteristics, revenue, occupancy rate, and ADR to understand what drives success in this market.
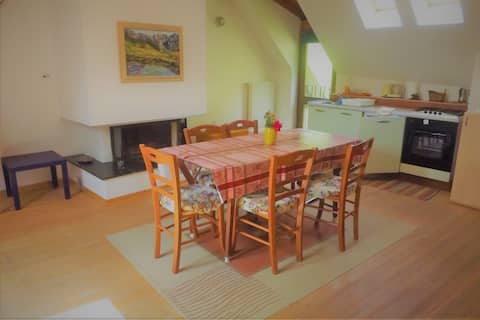
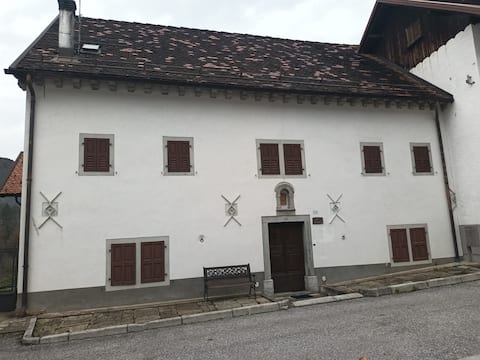
Mansarda Cjandus
Entire Place • 2 bedrooms
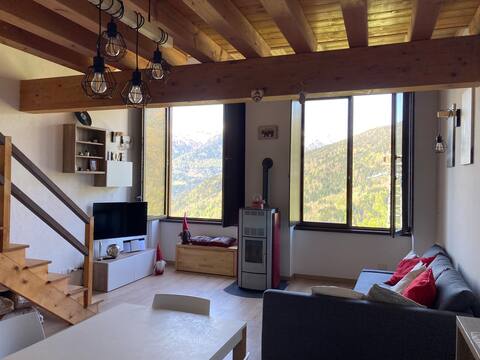
Tualis, Carnia
Entire Place • 1 bedroom
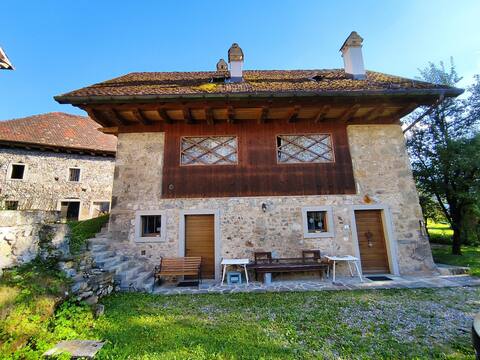
Povolaro 11
Entire Place • 1 bedroom
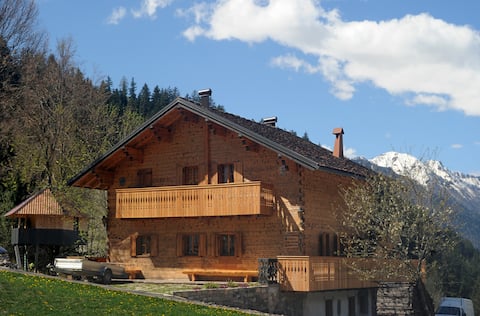
Nan's House, from the 1700s, Carnia-Friuli, Zoncolan
Entire Place • 3 bedrooms
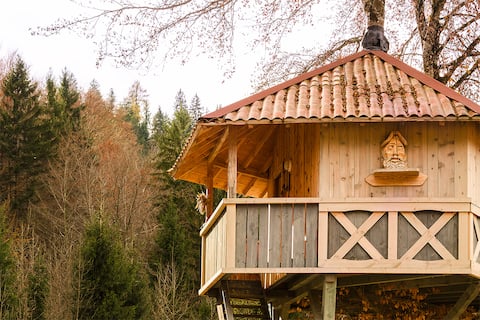
Tree house 21
Entire Place • 1 bedroom
Apartments with solarium and sauna - Zoncolan
Entire Place • 1 bedroom
Note: Performance varies based on location, size, amenities, seasonality, and management quality. Data reflects the past 12 months.
Top Performing Airbnb Hosts in Comeglians (2026)
Learn from the best! This table showcases top-performing Airbnb hosts in Comeglians based on the number of properties managed and estimated total revenue over the past year. Analyze their scale and performance metrics.
| Host Name | Properties | Grossing Revenue | Stay Reviews | Avg Rating |
|---|---|---|---|---|
| Albergo Diffuso Comeglians - C | 8 | $35,492 | 35 | 4.74/5.0 |
| Giovanni | 4 | $26,173 | 349 | 4.79/5.0 |
| Diana | 1 | $15,312 | 93 | 4.89/5.0 |
| Cristian | 1 | $13,862 | 7 | 5.00/5.0 |
| Elena | 1 | $13,828 | 41 | 4.85/5.0 |
| Ettore | 1 | $12,033 | 61 | 4.85/5.0 |
| Claudia | 1 | $8,465 | 10 | 4.80/5.0 |
| Novasol | 1 | $7,470 | 4 | 5.00/5.0 |
| Rinaldo | 1 | $3,884 | 7 | 4.29/5.0 |
Analyzing the strategies of top hosts, such as their property selection, pricing, and guest communication, can offer valuable lessons for optimizing your own Airbnb operations in Comeglians.
Dive Deeper: Advanced Comeglians STR Market Data (2026)
Ready to unlock more insights? AirROI provides access to advanced metrics and comprehensive Airbnb data for Comeglians. Explore detailed analytics beyond this report to refine your investment strategy, optimize pricing, and maximize your vacation rental profits.
Explore Advanced MetricsComeglians Short-Term Rental Market Composition (2026): Property & Room Types
Room Type Distribution
Property Type Distribution
Market Composition Insights for Comeglians
- The Comeglians Airbnb market composition is heavily skewed towards Entire Home/Apt listings, which make up 100% of the 19 active rentals. This indicates strong guest preference for privacy and space.
- Looking at the property type distribution in Comeglians, Apartment/Condo properties are the most common (68.4%), reflecting the local real estate landscape.
- Houses represent a significant 21.1% portion, catering likely to families or larger groups.
Comeglians Airbnb Room Capacity Analysis (2026): Bedroom Distribution
Distribution of Listings by Number of Bedrooms
Room Capacity Insights for Comeglians
- The dominant room capacity in Comeglians is 1 bedroom listings, making up 42.1% of the market. This suggests a strong demand for properties suitable for couples or solo travelers.
- Together, 1 bedroom and 3 bedrooms properties represent 68.4% of the active Airbnb listings in Comeglians, indicating a high concentration in these sizes.
- A significant 31.6% of listings offer 3+ bedrooms, catering to larger groups and families seeking more space in Comeglians.
Comeglians Vacation Rental Guest Capacity Trends (2026)
Distribution of Listings by Guest Capacity
Guest Capacity Insights for Comeglians
- The most common guest capacity trend in Comeglians vacation rentals is listings accommodating 4 guests (36.8%). This suggests the primary traveler segment is likely small families or groups.
- Properties designed for 4 guests and 5 guests dominate the Comeglians STR market, accounting for 52.6% of listings.
- 26.3% of properties accommodate 6+ guests, serving the market segment for larger families or group travel in Comeglians.
- On average, properties in Comeglians are equipped to host 4.6 guests.
Comeglians Airbnb Booking Patterns (2026): Available vs. Booked Days
Available Days Distribution
Booked Days Distribution
Booking Pattern Insights for Comeglians
- The most common availability pattern in Comeglians falls within the 271-366 days range, representing 63.2% of listings. This suggests many properties have significant open periods on their calendars.
- Approximately 94.8% of listings show high availability (181+ days open annually), indicating potential for increased bookings or specific owner usage patterns.
- For booked days, the 1-30 days range is most frequent in Comeglians (36.8%), reflecting common guest stay durations or potential owner blocking patterns.
- A notable 5.3% of properties secure long booking periods (181+ days booked per year), highlighting successful long-term rental strategies or significant owner usage.
Comeglians Airbnb Minimum Stay Requirements Analysis
Distribution of Listings by Minimum Night Requirement
2 Nights
5 listings
26.3% of total
7-29 Nights
1 listings
5.3% of total
30+ Nights
13 listings
68.4% of total
Key Insights
- The most prevalent minimum stay requirement in Comeglians is 30+ Nights, adopted by 68.4% of listings. This highlights the market's preference for longer commitments.
- A significant segment (68.4%) caters to monthly stays (30+ nights) in Comeglians, pointing to opportunities in the extended-stay market.
Recommendations
- Align with the market by considering a 30+ Nights minimum stay, as 68.4% of Comeglians hosts use this setting.
- Explore offering discounts for stays of 30+ nights to attract the 68.4% of the market seeking extended stays.
- Adjust minimum nights based on seasonality – potentially shorter during low season and longer during peak demand periods in Comeglians.
Comeglians Airbnb Cancellation Policy Trends Analysis (2026)
Super Strict 60 Days
1 listings
5.3% of total
Flexible
3 listings
15.8% of total
Moderate
10 listings
52.6% of total
Firm
5 listings
26.3% of total
Cancellation Policy Insights for Comeglians
- The prevailing Airbnb cancellation policy trend in Comeglians is Moderate, used by 52.6% of listings.
- There's a relatively balanced mix between guest-friendly (68.4%) and stricter (26.3%) policies, offering choices for different guest needs.
Recommendations for Hosts
- Consider adopting a Moderate policy to align with the 52.6% market standard in Comeglians.
- Regularly review your cancellation policy against competitors and market demand shifts in Comeglians.
Comeglians STR Booking Lead Time Analysis (2026)
Average Booking Lead Time by Month
Booking Lead Time Insights for Comeglians
- The overall average booking lead time for vacation rentals in Comeglians is 40 days.
- Guests book furthest in advance for stays during August (average 69 days), likely coinciding with peak travel demand or local events.
- The shortest booking windows occur for stays in May (average 4 days), indicating more last-minute travel plans during this time.
- Seasonally, Winter (59 days avg.) sees the longest lead times, while Fall (12 days avg.) has the shortest, reflecting typical travel planning cycles.
Recommendations for Hosts
- Use the overall average lead time (40 days) as a baseline for your pricing and availability strategy in Comeglians.
- For August stays, consider implementing length-of-stay discounts or slightly higher rates for bookings made less than 69 days out to capitalize on advance planning.
- During May, focus on last-minute booking availability and promotions, as guests book with very short notice (4 days avg.).
- Target marketing efforts for the Winter season well in advance (at least 59 days) to capture early planners.
- Monitor your own booking lead times against these Comeglians averages to identify opportunities for dynamic pricing adjustments.
Popular & Essential Airbnb Amenities in Comeglians (2026)
Amenity Prevalence
Amenity Insights for Comeglians
- Essential amenities in Comeglians that guests expect include: TV. Lacking these (this) could significantly impact bookings.
- Popular amenities like Kitchen, Heating, Dishes and silverware are common but not universal. Offering these can provide a competitive edge.
Recommendations for Hosts
- Ensure your listing includes all essential amenities for Comeglians: TV.
- Consider adding popular differentiators like Kitchen or Heating to increase appeal.
- Highlight unique or less common amenities you offer (e.g., hot tub, dedicated workspace, EV charger) in your listing description and photos.
- Regularly check competitor amenities in Comeglians to stay competitive.
Comeglians Airbnb Guest Demographics & Profile Analysis (2026)
Guest Profile Summary for Comeglians
- The typical guest profile for Airbnb in Comeglians consists of a mix of domestic (42%) and international guests, with top international origins including Czechia, typically belonging to the Post-2000s (Gen Z/Alpha) group (50%), primarily speaking English or Italian.
- Domestic travelers account for 42.1% of guests.
- Key international markets include Italy (42.1%) and Czechia (7.9%).
- Top languages spoken are English (38.2%) followed by Italian (20.6%).
- A significant demographic segment is the Post-2000s (Gen Z/Alpha) group, representing 50% of guests.
Recommendations for Hosts
- Balance marketing efforts between domestic and international channels based on the guest mix.
- Tailor amenities and listing descriptions to appeal to the dominant Post-2000s (Gen Z/Alpha) demographic (e.g., highlight fast WiFi, smart home features, local guides).
- Highlight unique local experiences or amenities relevant to the primary guest profile.
- Consider seasonal promotions aligned with peak travel times for key origin markets.
Nearby Short-Term Rental Market Comparison
How does the Comeglians Airbnb market stack up against its neighbors? Compare key performance metrics like average monthly revenue, ADR, and occupancy rates in surrounding areas to understand the broader regional STR landscape.
| Market | Active Properties | Monthly Revenue | Daily Rate | Avg. Occupancy |
|---|---|---|---|---|
| Scheffau am Wilden Kaiser | 12 | $6,669 | $906.83 | 30% |
| Sankt Pankraz - San Pancrazio | 12 | $6,528 | $633.65 | 29% |
| Urtijëi - St. Ulrich in Gröden - Ortisei | 172 | $5,054 | $718.33 | 41% |
| Hallstatt | 31 | $4,918 | $293.92 | 62% |
| Kiens - Chienes | 17 | $3,715 | $377.77 | 48% |
| Cortina d'Ampezzo | 309 | $3,646 | $474.12 | 40% |
| Going am Wilden Kaiser | 27 | $3,596 | $406.50 | 37% |
| Kramsach | 12 | $3,573 | $272.32 | 48% |
| Bayrischzell | 41 | $3,550 | $389.91 | 33% |
| Krimml | 53 | $3,544 | $359.14 | 41% |