Pievepelago Airbnb Market Analysis 2025: Short Term Rental Data & Vacation Rental Statistics in Emilia-Romagna, Italy
Is Airbnb profitable in Pievepelago in 2025? Explore comprehensive Airbnb analytics for Pievepelago, Emilia-Romagna, Italy to uncover income potential. This 2025 STR market report for Pievepelago, based on AirROI data from September 2024 to August 2025, reveals key trends in the niche market of 19 active listings.
Whether you're considering an Airbnb investment in Pievepelago, optimizing your existing vacation rental, or exploring rental arbitrage opportunities, understanding the Pievepelago Airbnb data is crucial. Leveraging the low regulation environment is key to maximizing your short term rental income potential. Let's dive into the specifics.
Key Pievepelago Airbnb Performance Metrics Overview
Monthly Airbnb Revenue Variations & Income Potential in Pievepelago (2025)
Understanding the monthly revenue variations for Airbnb listings in Pievepelago is key to maximizing your short term rental income potential. Seasonality significantly impacts earnings. Our analysis, based on data from the past 12 months, shows that the peak revenue month for STRs in Pievepelago is typically July, while May often presents the lowest earnings, highlighting opportunities for strategic pricing adjustments during shoulder and low seasons. Explore the typical Airbnb income in Pievepelago across different performance tiers:
- Best-in-class properties (Top 10%) achieve $2,403+ monthly, often utilizing dynamic pricing and superior guest experiences.
- Strong performing properties (Top 25%) earn $1,370 or more, indicating effective management and desirable locations/amenities.
- Typical properties (Median) generate around $732 per month, representing the average market performance.
- Entry-level properties (Bottom 25%) see earnings around $390, often with potential for optimization.
Average Monthly Airbnb Earnings Trend in Pievepelago
Pievepelago Airbnb Occupancy Rate Trends (2025)
Maximize your bookings by understanding the Pievepelago STR occupancy trends. Seasonal demand shifts significantly influence how often properties are booked. Typically, Julysees the highest demand (peak season occupancy), while October experiences the lowest (low season). Effective strategies, like adjusting minimum stays or offering promotions, can boost occupancy during slower periods. Here's how different property tiers perform in Pievepelago:
- Best-in-class properties (Top 10%) achieve 68%+ occupancy, indicating high desirability and potentially optimized availability.
- Strong performing properties (Top 25%) maintain 43% or higher occupancy, suggesting good market fit and guest satisfaction.
- Typical properties (Median) have an occupancy rate around 24%.
- Entry-level properties (Bottom 25%) average 15% occupancy, potentially facing higher vacancy.
Average Monthly Occupancy Rate Trend in Pievepelago
Average Daily Rate (ADR) Airbnb Trends in Pievepelago (2025)
Effective short term rental pricing strategy in Pievepelago involves understanding monthly ADR fluctuations. The Average Daily Rate (ADR) for Airbnb in Pievepelago typically peaks in January and dips lowest during April. Leveraging Airbnb dynamic pricing tools or strategies based on this seasonality can significantly boost revenue. Here's a look at the typical nightly rates achieved:
- Best-in-class properties (Top 10%) command rates of $155+ per night, often due to premium features or locations.
- Strong performing properties (Top 25%) achieve nightly rates of $108 or more.
- Typical properties (Median) charge around $86 per night.
- Entry-level properties (Bottom 25%) earn around $70 per night.
Average Daily Rate (ADR) Trend by Month in Pievepelago
Get Live Pievepelago Market Intelligence 👇

Explore Real-time Analytics
Airbnb Seasonality Analysis & Trends in Pievepelago (2025)
Peak Season (July, August, February)
- Revenue averages $1,803 per month
- Occupancy rates average 49.2%
- Daily rates average $110
Shoulder Season
- Revenue averages $837 per month
- Occupancy maintains around 27.0%
- Daily rates hold near $112
Low Season (April, May, June)
- Revenue drops to average $472 per month
- Occupancy decreases to average 20.1%
- Daily rates adjust to average $98
Seasonality Insights for Pievepelago
- The Airbnb seasonality in Pievepelago shows highly seasonal trends requiring careful strategy. While the sections above show seasonal averages, it's also insightful to look at the extremes:
- During the high season, the absolute peak month showcases Pievepelago's highest earning potential, with monthly revenues capable of climbing to $2,048, occupancy reaching a high of 60.6%, and ADRs peaking at $119.
- Conversely, the slowest single month of the year, typically falling within the low season, marks the market's lowest point. In this month, revenue might dip to $443, occupancy could drop to 14.7%, and ADRs may adjust down to $94.
- Understanding both the seasonal averages and these monthly peaks and troughs in revenue, occupancy, and ADR is crucial for maximizing your Airbnb profit potential in Pievepelago.
Seasonal Strategies for Maximizing Profit
- Peak Season: Maximize revenue through premium pricing and potentially longer minimum stays. Ensure high availability.
- Low Season: Offer competitive pricing, special promotions (e.g., extended stay discounts), and flexible cancellation policies. Target off-season travelers like remote workers or budget-conscious guests.
- Shoulder Seasons: Implement dynamic pricing that balances peak and low rates. Target weekend travelers or specific events. Offer slightly more flexible terms than peak season.
- Regularly analyze your own performance against these Pievepelago seasonality benchmarks and adjust your pricing and availability strategy accordingly.
Best Areas for Airbnb Investment in Pievepelago (2025)
Exploring the top neighborhoods for short-term rentals in Pievepelago? This section highlights key areas, outlining why they are attractive for hosts and guests, along with notable local attractions. Consider these locations based on your target guest profile and investment strategy.
| Neighborhood / Area | Why Host Here? (Target Guests & Appeal) | Key Attractions & Landmarks |
|---|---|---|
| Fiumalbo | Charming mountain town offering breathtaking views and access to nature. It's a great spot for skiing in winter and hiking in summer, making it appealing year-round. | DoloMitic Ski Area, Parco Naturale del Frignano, Ski Resort, Church of San Bartolomeo, Pieve di San Giovanni Battista |
| Abetone | Popular ski resort known for its slopes and beautiful landscapes, ideal for winter sports enthusiasts. A prime location for tourists looking for outdoor activities. | Abetone Ski Area, Oasi Zegna, Mount Cimone, Piste di Abetone, Winter hiking trails |
| Sestola | A picturesque village with a rich history and stunning views. Attracts visitors for its medieval architecture and ski slopes. | Castle of Sestola, Sestola Ski Resort, Pieve di Santa Maria Assunta, Borgo di Sestola, Parco del Frignano |
| Rocca di Cambio | Known for its ski slopes and natural parks, it offers a blend of outdoor fun and cultural experiences. | Campo Felice Ski Resort, Parco Regionale Sirente-Velino, San Pietro in Orticara, Chiesa di Santa Maria Assunta |
| San Martino | A tranquil mountain village perfect for relaxation and nature excursions, appealing to families and couples alike. | San Martino di Castrozza, Hiking trails, Parks and natural reserves, Local restaurants |
| Castel di Casio | Rich in history, this area is great for those looking for a quiet getaway with opportunities for hiking and exploration. | Lago di Castel di Casio, Castel di Casio Castle, Nature trails, Local cultural sites |
| Pievepelago | Located in the heart of the Apennines, it offers a unique combination of culture, adventure, and beautiful landscapes, ideal for travelers year-round. | Pievepelago Village, Hiking routes, Cultural festivals, Local cuisine |
| Lizzano in Belvedere | An area renowned for its natural beauty and wellness retreats. Great for guests seeking relaxation and outdoor experiences. | Cerreto Laghi, Local spas, Natural parks, Hiking and cycling trails |
Understanding Airbnb License Requirements & STR Laws in Pievepelago (2025)
While Pievepelago, Emilia-Romagna, Italy currently shows low STR regulations, specific Airbnb license requirements might still exist or change. Always verify the latest short term rental regulations and Airbnb license requirements directly with local government authorities for Pievepelago to ensure full compliance before hosting.
(Source: AirROI data, 2025, based on 5% licensed listings)
Top Performing Airbnb Properties in Pievepelago (2025)
Benchmark your potential! Explore examples of top-performing Airbnb properties in Pievepelagobased on Trailing Twelve Month (TTM) revenue. Analyze their characteristics, revenue, occupancy rate, and ADR to understand what drives success in this market.

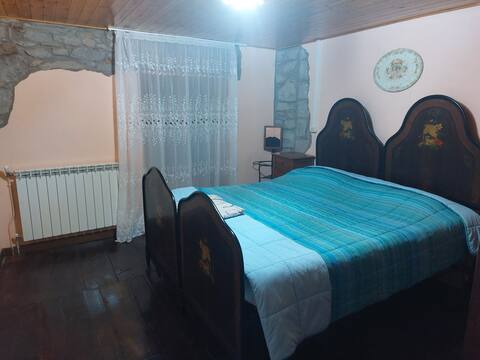
Appartamento a Pieve
Entire Place • 2 bedrooms
Casa vacanze Pievepelago
Entire Place • 2 bedrooms
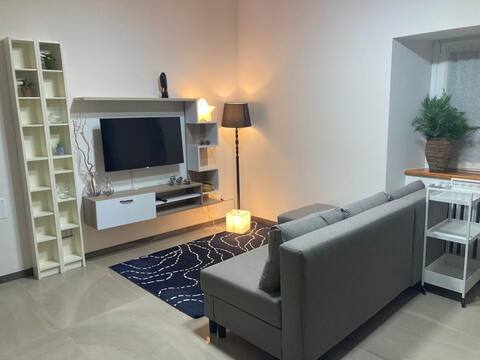
Lucia Apartment
Entire Place • 1 bedroom

Strawberry house Weekly discount 18% Monthly 40%
Entire Place • 1 bedroom

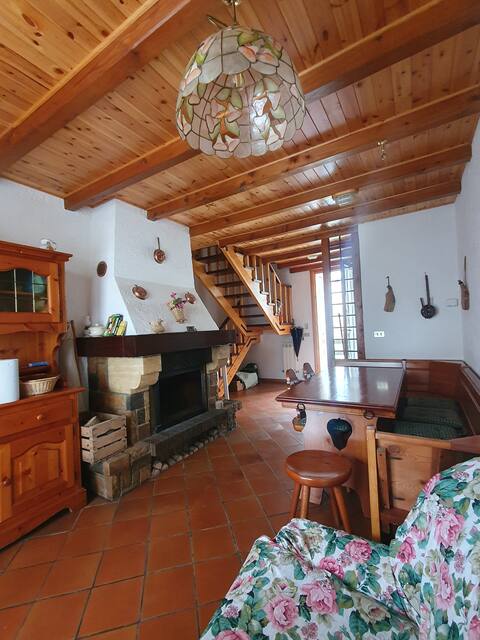
Charming Chalet with pine forest
Entire Place • 3 bedrooms
vacation home
Entire Place • 4 bedrooms
Note: Performance varies based on location, size, amenities, seasonality, and management quality. Data reflects the past 12 months.
Top Performing Airbnb Hosts in Pievepelago (2025)
Learn from the best! This table showcases top-performing Airbnb hosts in Pievepelago based on the number of properties managed and estimated total revenue over the past year. Analyze their scale and performance metrics.
| Host Name | Properties | Grossing Revenue | Stay Reviews | Avg Rating |
|---|---|---|---|---|
| Roberto | 2 | $15,990 | 19 | 4.79/5.0 |
| Alessio | 1 | $12,324 | 23 | 4.83/5.0 |
| Nicola | 1 | $11,639 | 13 | 4.62/5.0 |
| Roberto | 1 | $9,631 | 19 | 4.84/5.0 |
| Barbara | 1 | $9,104 | 6 | 4.50/5.0 |
| Elena | 1 | $6,424 | 10 | 4.60/5.0 |
| Gianfranco | 2 | $6,238 | 33 | 4.83/5.0 |
| Giancarlo | 1 | $4,797 | 5 | 5.00/5.0 |
| Mirella | 1 | $4,787 | 33 | 4.94/5.0 |
| David | 1 | $3,724 | 1 | Not Rated |
Analyzing the strategies of top hosts, such as their property selection, pricing, and guest communication, can offer valuable lessons for optimizing your own Airbnb operations in Pievepelago.
Dive Deeper: Advanced Pievepelago STR Market Data (2025)
Ready to unlock more insights? AirROI provides access to advanced metrics and comprehensive Airbnb data for Pievepelago. Explore detailed analytics beyond this report to refine your investment strategy, optimize pricing, and maximize your vacation rental profits.
Explore Advanced MetricsPievepelago Short-Term Rental Market Composition (2025): Property & Room Types
Room Type Distribution
Property Type Distribution
Market Composition Insights for Pievepelago
- The Pievepelago Airbnb market composition is heavily skewed towards Entire Home/Apt listings, which make up 100% of the 19 active rentals. This indicates strong guest preference for privacy and space.
- Looking at the property type distribution in Pievepelago, Apartment/Condo properties are the most common (57.9%), reflecting the local real estate landscape.
- Houses represent a significant 42.1% portion, catering likely to families or larger groups.
Pievepelago Airbnb Room Capacity Analysis (2025): Bedroom Distribution
Distribution of Listings by Number of Bedrooms
Room Capacity Insights for Pievepelago
- The dominant room capacity in Pievepelago is 2 bedrooms listings, making up 47.4% of the market. This suggests a strong demand for properties suitable for couples or solo travelers.
- Together, 2 bedrooms and 1 bedroom properties represent 84.2% of the active Airbnb listings in Pievepelago, indicating a high concentration in these sizes.
Pievepelago Vacation Rental Guest Capacity Trends (2025)
Distribution of Listings by Guest Capacity
Guest Capacity Insights for Pievepelago
- The most common guest capacity trend in Pievepelago vacation rentals is listings accommodating 4 guests (47.4%). This suggests the primary traveler segment is likely small families or groups.
- Properties designed for 4 guests and 8+ guests dominate the Pievepelago STR market, accounting for 63.2% of listings.
- 42.1% of properties accommodate 6+ guests, serving the market segment for larger families or group travel in Pievepelago.
- On average, properties in Pievepelago are equipped to host 5.2 guests.
Pievepelago Airbnb Booking Patterns (2025): Available vs. Booked Days
Available Days Distribution
Booked Days Distribution
Booking Pattern Insights for Pievepelago
- The most common availability pattern in Pievepelago falls within the 271-366 days range, representing 84.2% of listings. This suggests many properties have significant open periods on their calendars.
- Approximately 100.0% of listings show high availability (181+ days open annually), indicating potential for increased bookings or specific owner usage patterns.
- For booked days, the 1-30 days range is most frequent in Pievepelago (42.1%), reflecting common guest stay durations or potential owner blocking patterns.
Pievepelago Airbnb Minimum Stay Requirements Analysis
Distribution of Listings by Minimum Night Requirement
1 Night
2 listings
11.1% of total
2 Nights
5 listings
27.8% of total
4-6 Nights
3 listings
16.7% of total
7-29 Nights
3 listings
16.7% of total
30+ Nights
5 listings
27.8% of total
Key Insights
- The most prevalent minimum stay requirement in Pievepelago is 2 Nights, adopted by 27.8% of listings. This highlights the market's preference for shorter, flexible bookings.
- A significant segment (27.8%) caters to monthly stays (30+ nights) in Pievepelago, pointing to opportunities in the extended-stay market.
Recommendations
- Align with the market by considering a 2 Nights minimum stay, as 27.8% of Pievepelago hosts use this setting.
- If feasible, allowing 1-night stays, especially midweek or during low season, could capture last-minute bookings, as only 11.1% currently do.
- Explore offering discounts for stays of 30+ nights to attract the 27.8% of the market seeking extended stays.
- Adjust minimum nights based on seasonality – potentially shorter during low season and longer during peak demand periods in Pievepelago.
Pievepelago Airbnb Cancellation Policy Trends Analysis (2025)
Flexible
4 listings
22.2% of total
Moderate
10 listings
55.6% of total
Strict
4 listings
22.2% of total
Cancellation Policy Insights for Pievepelago
- The prevailing Airbnb cancellation policy trend in Pievepelago is Moderate, used by 55.6% of listings.
- The market strongly favors guest-friendly terms, with 77.8% of listings offering Flexible or Moderate policies. This suggests guests in Pievepelago may expect booking flexibility.
Recommendations for Hosts
- Consider adopting a Moderate policy to align with the 55.6% market standard in Pievepelago.
- Regularly review your cancellation policy against competitors and market demand shifts in Pievepelago.
Pievepelago STR Booking Lead Time Analysis (2025)
Average Booking Lead Time by Month
Booking Lead Time Insights for Pievepelago
- The overall average booking lead time for vacation rentals in Pievepelago is 40 days.
- Guests book furthest in advance for stays during December (average 82 days), likely coinciding with peak travel demand or local events.
- The shortest booking windows occur for stays in November (average 8 days), indicating more last-minute travel plans during this time.
- Seasonally, Winter (61 days avg.) sees the longest lead times, while Fall (15 days avg.) has the shortest, reflecting typical travel planning cycles.
Recommendations for Hosts
- Use the overall average lead time (40 days) as a baseline for your pricing and availability strategy in Pievepelago.
- For December stays, consider implementing length-of-stay discounts or slightly higher rates for bookings made less than 82 days out to capitalize on advance planning.
- During November, focus on last-minute booking availability and promotions, as guests book with very short notice (8 days avg.).
- Target marketing efforts for the Winter season well in advance (at least 61 days) to capture early planners.
- Monitor your own booking lead times against these Pievepelago averages to identify opportunities for dynamic pricing adjustments.
Popular & Essential Airbnb Amenities in Pievepelago (2025)
Amenity Prevalence
Amenity Insights for Pievepelago
- Popular amenities like Heating, Dishes and silverware, Kitchen are common but not universal. Offering these can provide a competitive edge.
Recommendations for Hosts
- Consider adding popular differentiators like Heating or Dishes and silverware to increase appeal.
- Highlight unique or less common amenities you offer (e.g., hot tub, dedicated workspace, EV charger) in your listing description and photos.
- Regularly check competitor amenities in Pievepelago to stay competitive.
Pievepelago Airbnb Guest Demographics & Profile Analysis (2025)
Guest Profile Summary for Pievepelago
- The typical guest profile for Airbnb in Pievepelago consists of primarily domestic travelers (77%), often arriving from nearby Florence, typically belonging to the Post-2000s (Gen Z/Alpha) group (50%), primarily speaking English or Italian.
- Domestic travelers account for 76.5% of guests.
- Key international markets include Italy (76.5%) and United Kingdom (8.8%).
- Top languages spoken are English (38.5%) followed by Italian (34.6%).
- A significant demographic segment is the Post-2000s (Gen Z/Alpha) group, representing 50% of guests.
Recommendations for Hosts
- Target domestic marketing efforts towards travelers from Florence and Prato.
- Tailor amenities and listing descriptions to appeal to the dominant Post-2000s (Gen Z/Alpha) demographic (e.g., highlight fast WiFi, smart home features, local guides).
- Highlight unique local experiences or amenities relevant to the primary guest profile.
- Consider seasonal promotions aligned with peak travel times for key origin markets.
Nearby Short-Term Rental Market Comparison
How does the Pievepelago Airbnb market stack up against its neighbors? Compare key performance metrics like average monthly revenue, ADR, and occupancy rates in surrounding areas to understand the broader regional STR landscape.
| Market | Active Properties | Monthly Revenue | Daily Rate | Avg. Occupancy |
|---|---|---|---|---|
| Laglio | 62 | $4,413 | $531.42 | 41% |
| Sala Comacina | 69 | $3,851 | $447.78 | 46% |
| Portofino | 73 | $3,687 | $506.89 | 40% |
| Marciano della Chiana | 17 | $3,650 | $501.78 | 35% |
| Brenzone sul Garda | 21 | $3,607 | $322.79 | 44% |
| Tignano | 11 | $3,518 | $362.03 | 41% |
| Castelfranco di Sotto | 51 | $3,399 | $347.46 | 34% |
| Carate Urio | 74 | $3,349 | $366.58 | 42% |
| Bellagio | 441 | $3,329 | $317.37 | 48% |
| San Fermo della Battaglia | 21 | $3,206 | $329.79 | 45% |