Piacenza Airbnb Market Analysis 2026: Short Term Rental Data & Vacation Rental Statistics in Emilia-Romagna, Italy
Is Airbnb profitable in Piacenza in 2026? Explore comprehensive Airbnb analytics for Piacenza, Emilia-Romagna, Italy to uncover income potential. This 2026 STR market report for Piacenza, based on AirROI data from February 2025 to January 2026, reveals key trends in the niche market of 105 active listings.
Whether you're considering an Airbnb investment in Piacenza, optimizing your existing vacation rental, or exploring rental arbitrage opportunities, understanding the Piacenza Airbnb data is crucial. Navigating the high regulation landscape is key to maximizing your short term rental income potential. Let's dive into the specifics.
Key Piacenza Airbnb Performance Metrics Overview
Monthly Airbnb Revenue Variations & Income Potential in Piacenza (2026)
Understanding the monthly revenue variations for Airbnb listings in Piacenza is key to maximizing your short term rental income potential. Seasonality significantly impacts earnings. Our analysis, based on data from the past 12 months, shows that the peak revenue month for STRs in Piacenza is typically October, while January often presents the lowest earnings, highlighting opportunities for strategic pricing adjustments during shoulder and low seasons. Explore the typical Airbnb income in Piacenza across different performance tiers:
- Best-in-class properties (Top 10%) achieve $2,465+ monthly, often utilizing dynamic pricing and superior guest experiences.
- Strong performing properties (Top 25%) earn $1,805 or more, indicating effective management and desirable locations/amenities.
- Typical properties (Median) generate around $1,182 per month, representing the average market performance.
- Entry-level properties (Bottom 25%) see earnings around $617, often with potential for optimization.
Average Monthly Airbnb Earnings Trend in Piacenza
Piacenza Airbnb Occupancy Rate Trends (2026)
Maximize your bookings by understanding the Piacenza STR occupancy trends. Seasonal demand shifts significantly influence how often properties are booked. Typically, Aprilsees the highest demand (peak season occupancy), while January experiences the lowest (low season). Effective strategies, like adjusting minimum stays or offering promotions, can boost occupancy during slower periods. Here's how different property tiers perform in Piacenza:
- Best-in-class properties (Top 10%) achieve 81%+ occupancy, indicating high desirability and potentially optimized availability.
- Strong performing properties (Top 25%) maintain 68% or higher occupancy, suggesting good market fit and guest satisfaction.
- Typical properties (Median) have an occupancy rate around 44%.
- Entry-level properties (Bottom 25%) average 21% occupancy, potentially facing higher vacancy.
Average Monthly Occupancy Rate Trend in Piacenza
Average Daily Rate (ADR) Airbnb Trends in Piacenza (2026)
Effective short term rental pricing strategy in Piacenza involves understanding monthly ADR fluctuations. The Average Daily Rate (ADR) for Airbnb in Piacenza typically peaks in December and dips lowest during April. Leveraging Airbnb dynamic pricing tools or strategies based on this seasonality can significantly boost revenue. Here's a look at the typical nightly rates achieved:
- Best-in-class properties (Top 10%) command rates of $128+ per night, often due to premium features or locations.
- Strong performing properties (Top 25%) achieve nightly rates of $108 or more.
- Typical properties (Median) charge around $90 per night.
- Entry-level properties (Bottom 25%) earn around $72 per night.
Average Daily Rate (ADR) Trend by Month in Piacenza
Get Live Piacenza Market Intelligence 👇

Explore Real-time Analytics
Airbnb Seasonality Analysis & Trends in Piacenza (2026)
Peak Season (October, April, July)
- Revenue averages $1,533 per month
- Occupancy rates average 49.3%
- Daily rates average $96
Shoulder Season
- Revenue averages $1,415 per month
- Occupancy maintains around 46.3%
- Daily rates hold near $99
Low Season (January, February, May)
- Revenue drops to average $1,104 per month
- Occupancy decreases to average 38.3%
- Daily rates adjust to average $96
Seasonality Insights for Piacenza
- The Airbnb seasonality in Piacenza shows moderate seasonality with distinct peak and low periods. While the sections above show seasonal averages, it's also insightful to look at the extremes:
- During the high season, the absolute peak month showcases Piacenza's highest earning potential, with monthly revenues capable of climbing to $1,577, occupancy reaching a high of 53.7%, and ADRs peaking at $107.
- Conversely, the slowest single month of the year, typically falling within the low season, marks the market's lowest point. In this month, revenue might dip to $919, occupancy could drop to 28.2%, and ADRs may adjust down to $89.
- Understanding both the seasonal averages and these monthly peaks and troughs in revenue, occupancy, and ADR is crucial for maximizing your Airbnb profit potential in Piacenza.
Seasonal Strategies for Maximizing Profit
- Peak Season: Maximize revenue through premium pricing and potentially longer minimum stays. Ensure high availability.
- Low Season: Offer competitive pricing, special promotions (e.g., extended stay discounts), and flexible cancellation policies. Target off-season travelers like remote workers or budget-conscious guests.
- Shoulder Seasons: Implement dynamic pricing that balances peak and low rates. Target weekend travelers or specific events. Offer slightly more flexible terms than peak season.
- Regularly analyze your own performance against these Piacenza seasonality benchmarks and adjust your pricing and availability strategy accordingly.
Best Areas for Airbnb Investment in Piacenza (2026)
Exploring the top neighborhoods for short-term rentals in Piacenza? This section highlights key areas, outlining why they are attractive for hosts and guests, along with notable local attractions. Consider these locations based on your target guest profile and investment strategy.
| Neighborhood / Area | Why Host Here? (Target Guests & Appeal) | Key Attractions & Landmarks |
|---|---|---|
| Centro Storico | The historic center of Piacenza, filled with stunning architecture, charming streets, and local culture. A top spot for tourists visiting the city for its history and vibrant atmosphere. | Palazzo Gotico, Piazza Cavalli, Cathedral of Piacenza, Basilica di Sant'Antonino, Museo di Storia Naturale, Teatro Municipale |
| Borgo di Piacenza | A bustling area with a mix of residential and commercial properties. Offers a variety of local shops and restaurants, attracting both locals and tourists looking for an authentic experience. | Mercato Coperto di Piacenza, Local shops, Restaurants, Parks and green spaces, Cafes |
| San Lazzaro | A residential area that is becoming increasingly trendy. Close to the city center and offers a quieter atmosphere, great for families and longer stays. | Parks and recreational areas, Local cafes, Shopping centers, Cultural events, Community activities |
| Via Emilia | A major thoroughfare that runs through Piacenza, lined with shops, cafes, and restaurants. It is a popular area for both locals and visitors to explore. | Shopping, Dining options, Cultural sites along the road, Public transport links, Historical landmarks |
| Piazza dei Cavalli | An iconic square in Piacenza surrounded by historic buildings and bustling with activity. Perfect for tourists wanting to soak in the local culture. | Palazzo Gotico, Cafes and restaurants, Events and festivals, Street performances, Local markets |
| Riviera d'Arno | A picturesque riverside area that offers beautiful views and walking paths. It's great for those who enjoy nature and outdoor activities. | Hiking trails, Biking paths, Scenic views, Water activities, Picnic areas |
| Castello di Grazzano Visconti | A nearby castle that is a popular day trip destination for tourists. An excellent investment for those looking to cater to visitors to this historical site. | Castle tours, Gardens, Local artisan shops, Cultural heritage events, Scenic photography spots |
| Podenzano | A suburban area with charming houses and a close-knit community feel. It attracts families and those looking for a tranquil living experience. | Parks, Local schools, Community events, Quiet residential neighborhoods, Local dining options |
Understanding Airbnb License Requirements & STR Laws in Piacenza (2026)
Yes, Piacenza, Emilia-Romagna, Italy enforces high STR regulations. Obtaining a license and ensuring compliance is almost certainly required according to current 2026 STR laws. Always verify the latest short term rental regulations and Airbnb license requirements directly with local government authorities for Piacenza to ensure full compliance before hosting.
(Source: AirROI data, 2026, based on 87% licensed listings)
Top Performing Airbnb Properties in Piacenza (2026)
Benchmark your potential! Explore examples of top-performing Airbnb properties in Piacenzabased on Trailing Twelve Month (TTM) revenue. Analyze their characteristics, revenue, occupancy rate, and ADR to understand what drives success in this market.
Nice apartment with private parking.
Entire Place • 3 bedrooms
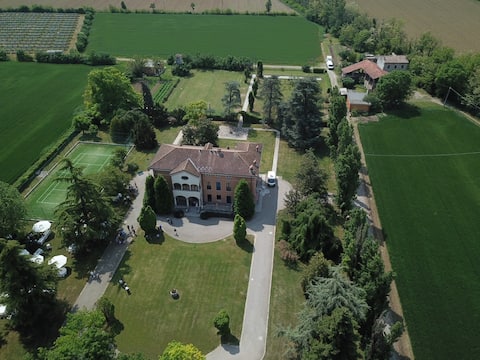
Villa Madonnina, 50 minutes from Milan
Entire Place • 5 bedrooms

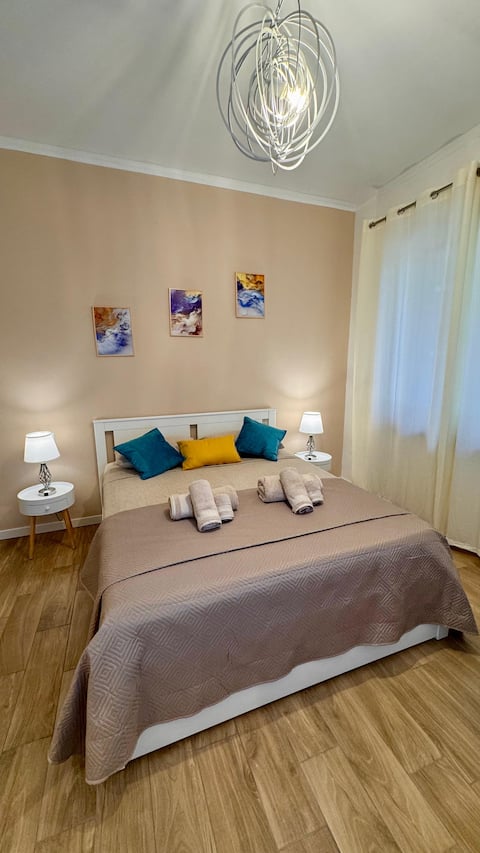
Casa San Raimondo
Entire Place • 2 bedrooms
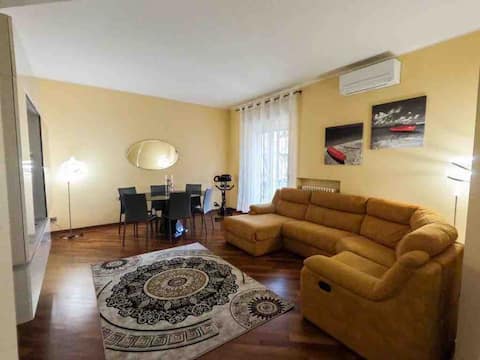
Terrace Oasis
Entire Place • 2 bedrooms
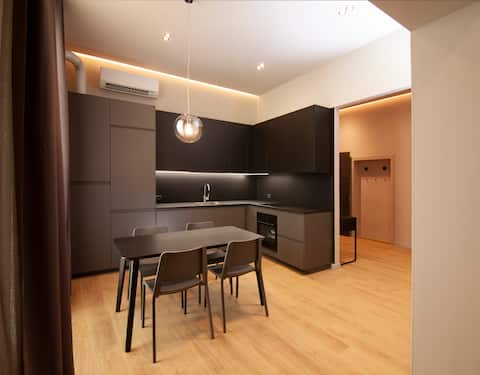
"Borghetto First" Design apartment in city center
Entire Place • 1 bedroom

Piacenza Open Space
Entire Place • 1 bedroom
Note: Performance varies based on location, size, amenities, seasonality, and management quality. Data reflects the past 12 months.
Top Performing Airbnb Hosts in Piacenza (2026)
Learn from the best! This table showcases top-performing Airbnb hosts in Piacenza based on the number of properties managed and estimated total revenue over the past year. Analyze their scale and performance metrics.
| Host Name | Properties | Grossing Revenue | Stay Reviews | Avg Rating |
|---|---|---|---|---|
| Marcello | 5 | $105,434 | 478 | 4.70/5.0 |
| Davide | 1 | $77,592 | 101 | 4.94/5.0 |
| Claudio | 3 | $56,259 | 119 | 4.93/5.0 |
| Matteo | 6 | $51,852 | 18 | 5.00/5.0 |
| Francesca | 1 | $45,309 | 10 | 5.00/5.0 |
| Paola | 2 | $44,393 | 50 | 4.75/5.0 |
| Casa Zoe Di Isabella Ferrari | 3 | $38,457 | 94 | 4.79/5.0 |
| Angiola | 1 | $36,490 | 69 | 5.00/5.0 |
| Giovanna | 1 | $31,664 | 61 | 4.98/5.0 |
| Raffaele | 4 | $29,504 | 162 | 4.85/5.0 |
Analyzing the strategies of top hosts, such as their property selection, pricing, and guest communication, can offer valuable lessons for optimizing your own Airbnb operations in Piacenza.
Dive Deeper: Advanced Piacenza STR Market Data (2026)
Ready to unlock more insights? AirROI provides access to advanced metrics and comprehensive Airbnb data for Piacenza. Explore detailed analytics beyond this report to refine your investment strategy, optimize pricing, and maximize your vacation rental profits.
Explore Advanced MetricsPiacenza Short-Term Rental Market Composition (2026): Property & Room Types
Room Type Distribution
Property Type Distribution
Market Composition Insights for Piacenza
- The Piacenza Airbnb market composition is heavily skewed towards Entire Home/Apt listings, which make up 71.4% of the 105 active rentals. This indicates strong guest preference for privacy and space.
- Looking at the property type distribution in Piacenza, Apartment/Condo properties are the most common (74.3%), reflecting the local real estate landscape.
- The presence of 17.1% Hotel/Boutique listings indicates integration with traditional hospitality.
Piacenza Airbnb Room Capacity Analysis (2026): Bedroom Distribution
Distribution of Listings by Number of Bedrooms
Room Capacity Insights for Piacenza
- The dominant room capacity in Piacenza is 1 bedroom listings, making up 46.7% of the market. This suggests a strong demand for properties suitable for couples or solo travelers.
- Together, 1 bedroom and 2 bedrooms properties represent 69.6% of the active Airbnb listings in Piacenza, indicating a high concentration in these sizes.
- Listings with 3+ bedrooms (3.9%) represent a smaller niche, potentially indicating an underserved market for larger group accommodations in Piacenza.
Piacenza Vacation Rental Guest Capacity Trends (2026)
Distribution of Listings by Guest Capacity
Guest Capacity Insights for Piacenza
- The most common guest capacity trend in Piacenza vacation rentals is listings accommodating 4 guests (29.5%). This suggests the primary traveler segment is likely small families or groups.
- Properties designed for 4 guests and 2 guests dominate the Piacenza STR market, accounting for 52.4% of listings.
- Listings for large groups (6+ guests) are relatively rare (4.8%), potentially indicating an opportunity for hosts targeting this segment in Piacenza.
- On average, properties in Piacenza are equipped to host 2.6 guests.
Piacenza Airbnb Booking Patterns (2026): Available vs. Booked Days
Available Days Distribution
Booked Days Distribution
Booking Pattern Insights for Piacenza
- The most common availability pattern in Piacenza falls within the 271-366 days range, representing 44.8% of listings. This suggests many properties have significant open periods on their calendars.
- Approximately 69.6% of listings show high availability (181+ days open annually), indicating potential for increased bookings or specific owner usage patterns.
- For booked days, the 31-90 days range is most frequent in Piacenza (30.5%), reflecting common guest stay durations or potential owner blocking patterns.
- A notable 31.4% of properties secure long booking periods (181+ days booked per year), highlighting successful long-term rental strategies or significant owner usage.
Piacenza Airbnb Minimum Stay Requirements Analysis
Distribution of Listings by Minimum Night Requirement
1 Night
55 listings
52.4% of total
2 Nights
21 listings
20% of total
3 Nights
1 listings
1% of total
4-6 Nights
3 listings
2.9% of total
7-29 Nights
4 listings
3.8% of total
30+ Nights
21 listings
20% of total
Key Insights
- The most prevalent minimum stay requirement in Piacenza is 1 Night, adopted by 52.4% of listings. This highlights the market's preference for shorter, flexible bookings.
- A strong majority (72.4%) of the Piacenza Airbnb data shows acceptance of very short stays (1-2 nights), indicating a dynamic, high-turnover market.
- A significant segment (20%) caters to monthly stays (30+ nights) in Piacenza, pointing to opportunities in the extended-stay market.
Recommendations
- Align with the market by considering a 1 Night minimum stay, as 52.4% of Piacenza hosts use this setting.
- Explore offering discounts for stays of 30+ nights to attract the 20% of the market seeking extended stays.
- Adjust minimum nights based on seasonality – potentially shorter during low season and longer during peak demand periods in Piacenza.
Piacenza Airbnb Cancellation Policy Trends Analysis (2026)
Super Strict 60 Days
1 listings
1% of total
Super Strict 30 Days
2 listings
1.9% of total
Limited
2 listings
1.9% of total
Flexible
43 listings
41% of total
Moderate
40 listings
38.1% of total
Firm
16 listings
15.2% of total
Strict
1 listings
1% of total
Cancellation Policy Insights for Piacenza
- The prevailing Airbnb cancellation policy trend in Piacenza is Flexible, used by 41% of listings.
- The market strongly favors guest-friendly terms, with 79.1% of listings offering Flexible or Moderate policies. This suggests guests in Piacenza may expect booking flexibility.
- Strict cancellation policies are quite rare (1%), potentially making listings with this policy less competitive unless justified by high demand or property type.
Recommendations for Hosts
- Consider adopting a Flexible policy to align with the 41% market standard in Piacenza.
- Using a Strict policy might deter some guests, as only 1% of listings use it. Evaluate if potential revenue protection outweighs possible lower booking rates.
- Regularly review your cancellation policy against competitors and market demand shifts in Piacenza.
Piacenza STR Booking Lead Time Analysis (2026)
Average Booking Lead Time by Month
Booking Lead Time Insights for Piacenza
- The overall average booking lead time for vacation rentals in Piacenza is 33 days.
- Guests book furthest in advance for stays during September (average 45 days), likely coinciding with peak travel demand or local events.
- The shortest booking windows occur for stays in February (average 20 days), indicating more last-minute travel plans during this time.
- Seasonally, Fall (36 days avg.) sees the longest lead times, while Winter (28 days avg.) has the shortest, reflecting typical travel planning cycles.
Recommendations for Hosts
- Use the overall average lead time (33 days) as a baseline for your pricing and availability strategy in Piacenza.
- For September stays, consider implementing length-of-stay discounts or slightly higher rates for bookings made less than 45 days out to capitalize on advance planning.
- Target marketing efforts for the Fall season well in advance (at least 36 days) to capture early planners.
- Monitor your own booking lead times against these Piacenza averages to identify opportunities for dynamic pricing adjustments.
Popular & Essential Airbnb Amenities in Piacenza (2026)
Amenity Prevalence
Amenity Insights for Piacenza
- Popular amenities like Wifi, TV, Air conditioning are common but not universal. Offering these can provide a competitive edge.
- Warning: Wifi is not universally provided but is considered essential globally. Ensure reliable Wifi is offered.
Recommendations for Hosts
- Consider adding popular differentiators like Wifi or TV to increase appeal.
- Highlight unique or less common amenities you offer (e.g., hot tub, dedicated workspace, EV charger) in your listing description and photos.
- Regularly check competitor amenities in Piacenza to stay competitive.
Piacenza Airbnb Guest Demographics & Profile Analysis (2026)
Guest Profile Summary for Piacenza
- The typical guest profile for Airbnb in Piacenza consists of predominantly international visitors (67%), with top international origins including France, typically belonging to the Post-2000s (Gen Z/Alpha) group (50%), primarily speaking English or Italian.
- Domestic travelers account for 32.9% of guests.
- Key international markets include Italy (32.9%) and France (16%).
- Top languages spoken are English (34.3%) followed by Italian (18.2%).
- A significant demographic segment is the Post-2000s (Gen Z/Alpha) group, representing 50% of guests.
Recommendations for Hosts
- Focus marketing internationally, particularly towards travelers from France.
- Tailor amenities and listing descriptions to appeal to the dominant Post-2000s (Gen Z/Alpha) demographic (e.g., highlight fast WiFi, smart home features, local guides).
- Highlight unique local experiences or amenities relevant to the primary guest profile.
- Consider seasonal promotions aligned with peak travel times for key origin markets.
Nearby Short-Term Rental Market Comparison
How does the Piacenza Airbnb market stack up against its neighbors? Compare key performance metrics like average monthly revenue, ADR, and occupancy rates in surrounding areas to understand the broader regional STR landscape.
| Market | Active Properties | Monthly Revenue | Daily Rate | Avg. Occupancy |
|---|---|---|---|---|
| Brienzwiler | 11 | $7,335 | $514.27 | 60% |
| Ranco | 12 | $5,691 | $536.46 | 42% |
| Grindelwald | 513 | $5,587 | $396.62 | 56% |
| Laglio | 64 | $4,334 | $518.58 | 43% |
| Ingenbohl | 14 | $4,251 | $219.49 | 63% |
| Brienz (BE) | 157 | $4,232 | $331.88 | 50% |
| Flüelen | 11 | $3,911 | $313.02 | 57% |
| Schwanden bei Brienz | 21 | $3,891 | $254.22 | 63% |
| Cassinasco | 19 | $3,887 | $718.39 | 40% |
| Cossano Belbo | 15 | $3,763 | $326.53 | 36% |