Monzuno Airbnb Market Analysis 2026: Short Term Rental Data & Vacation Rental Statistics in Emilia-Romagna, Italy
Is Airbnb profitable in Monzuno in 2026? Explore comprehensive Airbnb analytics for Monzuno, Emilia-Romagna, Italy to uncover income potential. This 2026 STR market report for Monzuno, based on AirROI data from February 2025 to January 2026, reveals key trends in the niche market of 24 active listings.
Whether you're considering an Airbnb investment in Monzuno, optimizing your existing vacation rental, or exploring rental arbitrage opportunities, understanding the Monzuno Airbnb data is crucial. Navigating the high regulation landscape is key to maximizing your short term rental income potential. Let's dive into the specifics.
Key Monzuno Airbnb Performance Metrics Overview
Monthly Airbnb Revenue Variations & Income Potential in Monzuno (2026)
Understanding the monthly revenue variations for Airbnb listings in Monzuno is key to maximizing your short term rental income potential. Seasonality significantly impacts earnings. Our analysis, based on data from the past 12 months, shows that the peak revenue month for STRs in Monzuno is typically August, while January often presents the lowest earnings, highlighting opportunities for strategic pricing adjustments during shoulder and low seasons. Explore the typical Airbnb income in Monzuno across different performance tiers:
- Best-in-class properties (Top 10%) achieve $2,391+ monthly, often utilizing dynamic pricing and superior guest experiences.
- Strong performing properties (Top 25%) earn $1,619 or more, indicating effective management and desirable locations/amenities.
- Typical properties (Median) generate around $737 per month, representing the average market performance.
- Entry-level properties (Bottom 25%) see earnings around $269, often with potential for optimization.
Average Monthly Airbnb Earnings Trend in Monzuno
Monzuno Airbnb Occupancy Rate Trends (2026)
Maximize your bookings by understanding the Monzuno STR occupancy trends. Seasonal demand shifts significantly influence how often properties are booked. Typically, Augustsees the highest demand (peak season occupancy), while January experiences the lowest (low season). Effective strategies, like adjusting minimum stays or offering promotions, can boost occupancy during slower periods. Here's how different property tiers perform in Monzuno:
- Best-in-class properties (Top 10%) achieve 71%+ occupancy, indicating high desirability and potentially optimized availability.
- Strong performing properties (Top 25%) maintain 53% or higher occupancy, suggesting good market fit and guest satisfaction.
- Typical properties (Median) have an occupancy rate around 31%.
- Entry-level properties (Bottom 25%) average 15% occupancy, potentially facing higher vacancy.
Average Monthly Occupancy Rate Trend in Monzuno
Average Daily Rate (ADR) Airbnb Trends in Monzuno (2026)
Effective short term rental pricing strategy in Monzuno involves understanding monthly ADR fluctuations. The Average Daily Rate (ADR) for Airbnb in Monzuno typically peaks in January and dips lowest during April. Leveraging Airbnb dynamic pricing tools or strategies based on this seasonality can significantly boost revenue. Here's a look at the typical nightly rates achieved:
- Best-in-class properties (Top 10%) command rates of $152+ per night, often due to premium features or locations.
- Strong performing properties (Top 25%) achieve nightly rates of $115 or more.
- Typical properties (Median) charge around $90 per night.
- Entry-level properties (Bottom 25%) earn around $49 per night.
Average Daily Rate (ADR) Trend by Month in Monzuno
Get Live Monzuno Market Intelligence 👇

Explore Real-time Analytics
Airbnb Seasonality Analysis & Trends in Monzuno (2026)
Peak Season (August, October, September)
- Revenue averages $1,602 per month
- Occupancy rates average 44.5%
- Daily rates average $110
Shoulder Season
- Revenue averages $1,146 per month
- Occupancy maintains around 38.1%
- Daily rates hold near $103
Low Season (January, February, November)
- Revenue drops to average $544 per month
- Occupancy decreases to average 22.2%
- Daily rates adjust to average $107
Seasonality Insights for Monzuno
- The Airbnb seasonality in Monzuno shows highly seasonal trends requiring careful strategy. While the sections above show seasonal averages, it's also insightful to look at the extremes:
- During the high season, the absolute peak month showcases Monzuno's highest earning potential, with monthly revenues capable of climbing to $1,925, occupancy reaching a high of 52.6%, and ADRs peaking at $114.
- Conversely, the slowest single month of the year, typically falling within the low season, marks the market's lowest point. In this month, revenue might dip to $420, occupancy could drop to 15.4%, and ADRs may adjust down to $96.
- Understanding both the seasonal averages and these monthly peaks and troughs in revenue, occupancy, and ADR is crucial for maximizing your Airbnb profit potential in Monzuno.
Seasonal Strategies for Maximizing Profit
- Peak Season: Maximize revenue through premium pricing and potentially longer minimum stays. Ensure high availability.
- Low Season: Offer competitive pricing, special promotions (e.g., extended stay discounts), and flexible cancellation policies. Target off-season travelers like remote workers or budget-conscious guests.
- Shoulder Seasons: Implement dynamic pricing that balances peak and low rates. Target weekend travelers or specific events. Offer slightly more flexible terms than peak season.
- Regularly analyze your own performance against these Monzuno seasonality benchmarks and adjust your pricing and availability strategy accordingly.
Best Areas for Airbnb Investment in Monzuno (2026)
Exploring the top neighborhoods for short-term rentals in Monzuno? This section highlights key areas, outlining why they are attractive for hosts and guests, along with notable local attractions. Consider these locations based on your target guest profile and investment strategy.
| Neighborhood / Area | Why Host Here? (Target Guests & Appeal) | Key Attractions & Landmarks |
|---|---|---|
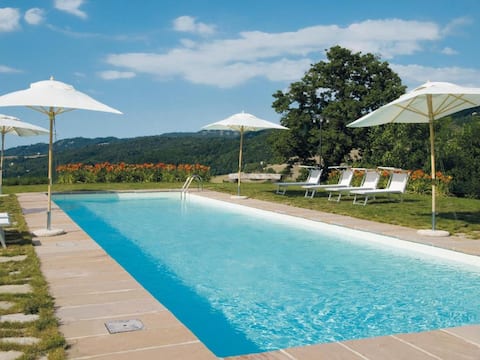
| Monzuno Town Center | The heart of Monzuno, offering local amenities, restaurants, and easy access to surrounding nature. An ideal spot for guests wanting to explore the local culture and enjoy the charm of a small Italian town. | Monzuno Church, Local Markets, Parks and Trails, Historical Sites, Feeling of Community |
| Savena Valley | A picturesque valley perfect for nature lovers and outdoor enthusiasts. Popular for hiking, cycling, and enjoying the serene Italian countryside, making it attractive for travelers seeking a peaceful retreat. | Savena River, Hiking Trails, Traditional Italian Countryside, Picnic Areas, Local Vineyards |
| Monte di Rovigo | This mountainous area offers stunning views and hiking opportunities. It's perfect for adventurous tourists and those seeking photography spots and nature experiences. | Mountain Hiking Trails, Panoramic Views, Nature Reserves, Wildlife Watching, Seasonal Fairs |
| Bologna Day Trips | Monzuno is a short drive from Bologna, making it an excellent base for tourists wanting to explore the city while enjoying a peaceful stay in the countryside. | Bologna Historical City Center, Two Towers, Bologna Food Tours, Piazza Maggiore, University of Bologna |
| Cultural Experiences | Monzuno hosts local events, festivals, and traditional Italian culture that attract tourists. Guests can experience an authentic Italian lifestyle and community events. | Local Festivities, Traditional Cuisine Restaurants, Artisan Workshops, Cultural Displays, Community Gatherings |
| Outdoor Activities | Given its natural landscape, Monzuno is renowned for outdoor activities such as hiking, biking, and nature walks, catering to adventure seekers and families alike. | Biking Trails, Nature Parks, Outdoor Sports Programs, Adventure Camps, Guided Nature Tours |
| Gothic Architecture | Visitors are drawn to the unique gothic architecture present in certain historic sites around Monzuno, appealing to history and architecture buffs. | Old Churches, Historical Buildings, Architectural Tours, Charming Streets, Cultural Heritage Sites |
| Wine and Dine | Monzuno is located within a region known for its exquisite Italian wines and culinary experiences, making it attractive for food and wine enthusiasts. | Wine Tasting Tours, Gastronomic Festivals, Local Trattorias, Cooking Classes, Vineyard Visits |
Understanding Airbnb License Requirements & STR Laws in Monzuno (2026)
Yes, Monzuno, Emilia-Romagna, Italy enforces high STR regulations. Obtaining a license and ensuring compliance is almost certainly required according to current 2026 STR laws. Always verify the latest short term rental regulations and Airbnb license requirements directly with local government authorities for Monzuno to ensure full compliance before hosting.
(Source: AirROI data, 2026, based on 92% licensed listings)
Top Performing Airbnb Properties in Monzuno (2026)
Benchmark your potential! Explore examples of top-performing Airbnb properties in Monzunobased on Trailing Twelve Month (TTM) revenue. Analyze their characteristics, revenue, occupancy rate, and ADR to understand what drives success in this market.

House with a view surrounded by nature_ 5
Entire Place • 2 bedrooms
Lodole Relais
Entire Place • 2 bedrooms

Gorgeous One Bed Villa Overseeing the Apennines
Entire Place • 1 bedroom

Sunset on Monte Sole
Entire Place • 2 bedrooms

House with a view of nature_ 2
Entire Place • 1 bedroom
OcchiodiAdone B&B (Via degli Dei)
Private Room • N/A
Note: Performance varies based on location, size, amenities, seasonality, and management quality. Data reflects the past 12 months.
Top Performing Airbnb Hosts in Monzuno (2026)
Learn from the best! This table showcases top-performing Airbnb hosts in Monzuno based on the number of properties managed and estimated total revenue over the past year. Analyze their scale and performance metrics.
| Host Name | Properties | Grossing Revenue | Stay Reviews | Avg Rating |
|---|---|---|---|---|
| Stefania | 3 | $52,480 | 302 | 4.96/5.0 |
| Umberto | 1 | $25,202 | 51 | 4.86/5.0 |
| Anna Maria | 1 | $20,167 | 265 | 4.96/5.0 |
| Matteo | 2 | $19,606 | 8 | 5.00/5.0 |
| Valter | 1 | $16,915 | 30 | 4.93/5.0 |
| Livia | 1 | $13,916 | 26 | 4.88/5.0 |
| Pier Luigi | 1 | $13,485 | 37 | 5.00/5.0 |
| Daniela | 2 | $11,998 | 20 | 4.42/5.0 |
| Carlotta | 2 | $8,967 | 110 | 4.89/5.0 |
| Laura | 2 | $8,368 | 37 | 4.95/5.0 |
Analyzing the strategies of top hosts, such as their property selection, pricing, and guest communication, can offer valuable lessons for optimizing your own Airbnb operations in Monzuno.
Dive Deeper: Advanced Monzuno STR Market Data (2026)
Ready to unlock more insights? AirROI provides access to advanced metrics and comprehensive Airbnb data for Monzuno. Explore detailed analytics beyond this report to refine your investment strategy, optimize pricing, and maximize your vacation rental profits.
Explore Advanced MetricsMonzuno Short-Term Rental Market Composition (2026): Property & Room Types
Room Type Distribution
Property Type Distribution
Market Composition Insights for Monzuno
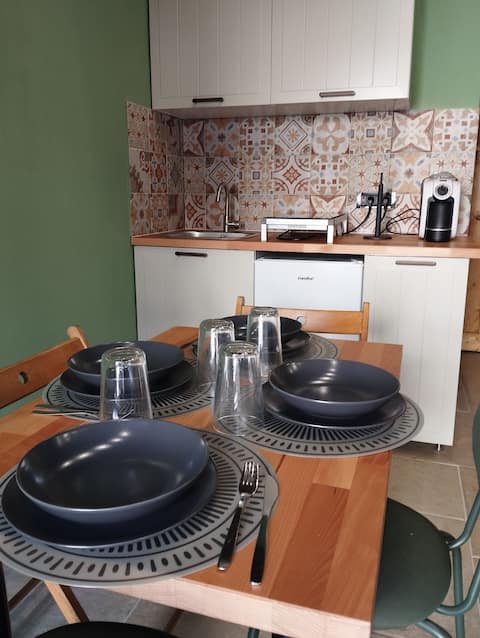
- The Monzuno Airbnb market composition is heavily skewed towards Entire Home/Apt listings, which make up 58.3% of the 24 active rentals. This indicates strong guest preference for privacy and space.
- However, a notable 41.7% share for Private Rooms suggests opportunities for budget-conscious travelers or hosts renting out spare rooms.
- Looking at the property type distribution in Monzuno, House properties are the most common (45.8%), reflecting the local real estate landscape.
- Houses represent a significant 45.8% portion, catering likely to families or larger groups.
- The presence of 8.3% Hotel/Boutique listings indicates integration with traditional hospitality.
- Smaller segments like others (combined 4.2%) offer potential for unique stay experiences.
Monzuno Airbnb Room Capacity Analysis (2026): Bedroom Distribution
Distribution of Listings by Number of Bedrooms
Room Capacity Insights for Monzuno
- The dominant room capacity in Monzuno is 2 bedrooms listings, making up 41.7% of the market. This suggests a strong demand for properties suitable for couples or solo travelers.
- Together, 2 bedrooms and 1 bedroom properties represent 79.2% of the active Airbnb listings in Monzuno, indicating a high concentration in these sizes.
Monzuno Vacation Rental Guest Capacity Trends (2026)
Distribution of Listings by Guest Capacity
Guest Capacity Insights for Monzuno
- The most common guest capacity trend in Monzuno vacation rentals is listings accommodating 4 guests (29.2%). This suggests the primary traveler segment is likely small families or groups.
- Properties designed for 4 guests and 5 guests dominate the Monzuno STR market, accounting for 45.9% of listings.
- On average, properties in Monzuno are equipped to host 3.0 guests.
Monzuno Airbnb Booking Patterns (2026): Available vs. Booked Days
Available Days Distribution
Booked Days Distribution
Booking Pattern Insights for Monzuno
- The most common availability pattern in Monzuno falls within the 271-366 days range, representing 58.3% of listings. This suggests many properties have significant open periods on their calendars.
- Approximately 91.6% of listings show high availability (181+ days open annually), indicating potential for increased bookings or specific owner usage patterns.
- For booked days, the 31-90 days range is most frequent in Monzuno (41.7%), reflecting common guest stay durations or potential owner blocking patterns.
- A notable 8.3% of properties secure long booking periods (181+ days booked per year), highlighting successful long-term rental strategies or significant owner usage.
Monzuno Airbnb Minimum Stay Requirements Analysis
Distribution of Listings by Minimum Night Requirement
1 Night
15 listings
62.5% of total
2 Nights
2 listings
8.3% of total
3 Nights
2 listings
8.3% of total
4-6 Nights
1 listings
4.2% of total
7-29 Nights
1 listings
4.2% of total
30+ Nights
3 listings
12.5% of total
Key Insights
- The most prevalent minimum stay requirement in Monzuno is 1 Night, adopted by 62.5% of listings. This highlights the market's preference for shorter, flexible bookings.
- A strong majority (70.8%) of the Monzuno Airbnb data shows acceptance of very short stays (1-2 nights), indicating a dynamic, high-turnover market.
- A significant segment (12.5%) caters to monthly stays (30+ nights) in Monzuno, pointing to opportunities in the extended-stay market.
Recommendations
- Align with the market by considering a 1 Night minimum stay, as 62.5% of Monzuno hosts use this setting.
- Explore offering discounts for stays of 30+ nights to attract the 12.5% of the market seeking extended stays.
- Adjust minimum nights based on seasonality – potentially shorter during low season and longer during peak demand periods in Monzuno.
Monzuno Airbnb Cancellation Policy Trends Analysis (2026)
Flexible
15 listings
62.5% of total
Moderate
8 listings
33.3% of total
Strict
1 listings
4.2% of total
Cancellation Policy Insights for Monzuno
- The prevailing Airbnb cancellation policy trend in Monzuno is Flexible, used by 62.5% of listings.
- The market strongly favors guest-friendly terms, with 95.8% of listings offering Flexible or Moderate policies. This suggests guests in Monzuno may expect booking flexibility.
- Strict cancellation policies are quite rare (4.2%), potentially making listings with this policy less competitive unless justified by high demand or property type.
Recommendations for Hosts
- Consider adopting a Flexible policy to align with the 62.5% market standard in Monzuno.
- Given the high prevalence of Flexible policies (62.5%), offering this can enhance booking appeal, especially during shoulder seasons.
- Using a Strict policy might deter some guests, as only 4.2% of listings use it. Evaluate if potential revenue protection outweighs possible lower booking rates.
- Regularly review your cancellation policy against competitors and market demand shifts in Monzuno.
Monzuno STR Booking Lead Time Analysis (2026)
Average Booking Lead Time by Month
Booking Lead Time Insights for Monzuno
- The overall average booking lead time for vacation rentals in Monzuno is 49 days.
- Guests book furthest in advance for stays during May (average 71 days), likely coinciding with peak travel demand or local events.
- The shortest booking windows occur for stays in November (average 23 days), indicating more last-minute travel plans during this time.
- Seasonally, Summer (57 days avg.) sees the longest lead times, while Fall (36 days avg.) has the shortest, reflecting typical travel planning cycles.
Recommendations for Hosts
- Use the overall average lead time (49 days) as a baseline for your pricing and availability strategy in Monzuno.
- For May stays, consider implementing length-of-stay discounts or slightly higher rates for bookings made less than 71 days out to capitalize on advance planning.
- Target marketing efforts for the Summer season well in advance (at least 57 days) to capture early planners.
- Monitor your own booking lead times against these Monzuno averages to identify opportunities for dynamic pricing adjustments.
Popular & Essential Airbnb Amenities in Monzuno (2026)
Amenity Prevalence
Amenity Insights for Monzuno
- Essential amenities in Monzuno that guests expect include: Free parking on premises. Lacking these (this) could significantly impact bookings.
- Popular amenities like Heating, Hair dryer, Wifi are common but not universal. Offering these can provide a competitive edge.
- Warning: Wifi is not universally provided but is considered essential globally. Ensure reliable Wifi is offered.
Recommendations for Hosts
- Ensure your listing includes all essential amenities for Monzuno: Free parking on premises.
- Consider adding popular differentiators like Heating or Hair dryer to increase appeal.
- Highlight unique or less common amenities you offer (e.g., hot tub, dedicated workspace, EV charger) in your listing description and photos.
- Regularly check competitor amenities in Monzuno to stay competitive.
Monzuno Airbnb Guest Demographics & Profile Analysis (2026)
Guest Profile Summary for Monzuno
- The typical guest profile for Airbnb in Monzuno consists of predominantly international visitors (69%), with top international origins including Germany, typically belonging to the Post-2000s (Gen Z/Alpha) group (50%), primarily speaking English or Italian.
- Domestic travelers account for 31.3% of guests.
- Key international markets include Italy (31.3%) and Germany (14.8%).
- Top languages spoken are English (37.1%) followed by Italian (14.9%).
- A significant demographic segment is the Post-2000s (Gen Z/Alpha) group, representing 50% of guests.
Recommendations for Hosts
- Focus marketing internationally, particularly towards travelers from Germany.
- Tailor amenities and listing descriptions to appeal to the dominant Post-2000s (Gen Z/Alpha) demographic (e.g., highlight fast WiFi, smart home features, local guides).
- Highlight unique local experiences or amenities relevant to the primary guest profile.
- Consider seasonal promotions aligned with peak travel times for key origin markets.
Nearby Short-Term Rental Market Comparison
How does the Monzuno Airbnb market stack up against its neighbors? Compare key performance metrics like average monthly revenue, ADR, and occupancy rates in surrounding areas to understand the broader regional STR landscape.
| Market | Active Properties | Monthly Revenue | Daily Rate | Avg. Occupancy |
|---|---|---|---|---|
| Tignano | 12 | $4,160 | $366.92 | 45% |
| Marciano della Chiana | 17 | $3,823 | $545.25 | 35% |
| Castelfranco di Sotto | 47 | $3,777 | $377.39 | 39% |
| Buonconvento | 60 | $3,186 | $440.58 | 43% |
| Radda in Chianti | 94 | $3,098 | $361.57 | 39% |
| Venice | 6,889 | $2,992 | $246.20 | 47% |
| Impruneta | 146 | $2,887 | $297.45 | 40% |
| Lastra a Signa | 96 | $2,760 | $311.91 | 43% |
| Florence | 10,496 | $2,755 | $225.30 | 49% |
| Marcialla | 29 | $2,745 | $263.00 | 48% |