Cattolica Airbnb Market Analysis 2026: Short Term Rental Data & Vacation Rental Statistics in Emilia-Romagna, Italy
Is Airbnb profitable in Cattolica in 2026? Explore comprehensive Airbnb analytics for Cattolica, Emilia-Romagna, Italy to uncover income potential. This 2026 STR market report for Cattolica, based on AirROI data from February 2025 to January 2026, reveals key trends in the niche market of 155 active listings.
Whether you're considering an Airbnb investment in Cattolica, optimizing your existing vacation rental, or exploring rental arbitrage opportunities, understanding the Cattolica Airbnb data is crucial. Navigating the high regulation landscape is key to maximizing your short term rental income potential. Let's dive into the specifics.
Key Cattolica Airbnb Performance Metrics Overview
Monthly Airbnb Revenue Variations & Income Potential in Cattolica (2026)
Understanding the monthly revenue variations for Airbnb listings in Cattolica is key to maximizing your short term rental income potential. Seasonality significantly impacts earnings. Our analysis, based on data from the past 12 months, shows that the peak revenue month for STRs in Cattolica is typically August, while February often presents the lowest earnings, highlighting opportunities for strategic pricing adjustments during shoulder and low seasons. Explore the typical Airbnb income in Cattolica across different performance tiers:
- Best-in-class properties (Top 10%) achieve $3,290+ monthly, often utilizing dynamic pricing and superior guest experiences.
- Strong performing properties (Top 25%) earn $1,888 or more, indicating effective management and desirable locations/amenities.
- Typical properties (Median) generate around $1,123 per month, representing the average market performance.
- Entry-level properties (Bottom 25%) see earnings around $588, often with potential for optimization.
Average Monthly Airbnb Earnings Trend in Cattolica
Cattolica Airbnb Occupancy Rate Trends (2026)
Maximize your bookings by understanding the Cattolica STR occupancy trends. Seasonal demand shifts significantly influence how often properties are booked. Typically, Augustsees the highest demand (peak season occupancy), while January experiences the lowest (low season). Effective strategies, like adjusting minimum stays or offering promotions, can boost occupancy during slower periods. Here's how different property tiers perform in Cattolica:
- Best-in-class properties (Top 10%) achieve 68%+ occupancy, indicating high desirability and potentially optimized availability.
- Strong performing properties (Top 25%) maintain 47% or higher occupancy, suggesting good market fit and guest satisfaction.
- Typical properties (Median) have an occupancy rate around 29%.
- Entry-level properties (Bottom 25%) average 14% occupancy, potentially facing higher vacancy.
Average Monthly Occupancy Rate Trend in Cattolica
Average Daily Rate (ADR) Airbnb Trends in Cattolica (2026)
Effective short term rental pricing strategy in Cattolica involves understanding monthly ADR fluctuations. The Average Daily Rate (ADR) for Airbnb in Cattolica typically peaks in August and dips lowest during October. Leveraging Airbnb dynamic pricing tools or strategies based on this seasonality can significantly boost revenue. Here's a look at the typical nightly rates achieved:
- Best-in-class properties (Top 10%) command rates of $231+ per night, often due to premium features or locations.
- Strong performing properties (Top 25%) achieve nightly rates of $166 or more.
- Typical properties (Median) charge around $119 per night.
- Entry-level properties (Bottom 25%) earn around $86 per night.
Average Daily Rate (ADR) Trend by Month in Cattolica
Get Live Cattolica Market Intelligence 👇

Explore Real-time Analytics
Airbnb Seasonality Analysis & Trends in Cattolica (2026)
Peak Season (August, July, November)
- Revenue averages $2,706 per month
- Occupancy rates average 48.3%
- Daily rates average $148
Shoulder Season
- Revenue averages $1,261 per month
- Occupancy maintains around 31.4%
- Daily rates hold near $138
Low Season (January, February, December)
- Revenue drops to average $873 per month
- Occupancy decreases to average 22.5%
- Daily rates adjust to average $133
Seasonality Insights for Cattolica
- The Airbnb seasonality in Cattolica shows highly seasonal trends requiring careful strategy. While the sections above show seasonal averages, it's also insightful to look at the extremes:
- During the high season, the absolute peak month showcases Cattolica's highest earning potential, with monthly revenues capable of climbing to $3,479, occupancy reaching a high of 60.6%, and ADRs peaking at $159.
- Conversely, the slowest single month of the year, typically falling within the low season, marks the market's lowest point. In this month, revenue might dip to $719, occupancy could drop to 20.2%, and ADRs may adjust down to $132.
- Understanding both the seasonal averages and these monthly peaks and troughs in revenue, occupancy, and ADR is crucial for maximizing your Airbnb profit potential in Cattolica.
Seasonal Strategies for Maximizing Profit
- Peak Season: Maximize revenue through premium pricing and potentially longer minimum stays. Ensure high availability.
- Low Season: Offer competitive pricing, special promotions (e.g., extended stay discounts), and flexible cancellation policies. Target off-season travelers like remote workers or budget-conscious guests.
- Shoulder Seasons: Implement dynamic pricing that balances peak and low rates. Target weekend travelers or specific events. Offer slightly more flexible terms than peak season.
- Regularly analyze your own performance against these Cattolica seasonality benchmarks and adjust your pricing and availability strategy accordingly.
Best Areas for Airbnb Investment in Cattolica (2026)
Exploring the top neighborhoods for short-term rentals in Cattolica? This section highlights key areas, outlining why they are attractive for hosts and guests, along with notable local attractions. Consider these locations based on your target guest profile and investment strategy.
| Neighborhood / Area | Why Host Here? (Target Guests & Appeal) | Key Attractions & Landmarks |
|---|---|---|
| Centro di Cattolica | The heart of Cattolica, bustling with shops, restaurants, and close proximity to the beach. Ideal for tourists looking for convenience and vibrant atmosphere. | Cattolica Beach, Aquarium of Cattolica, Via Dante, Cattolica's pedestrian area, local markets |
| Via Milano | A popular street known for its proximity to the beach and family-friendly accommodations. Great for families and travelers looking for easy access to beach activities. | Cattolica Beach, Beach Clubs, Playgrounds, Restaurants along Via Milano, Cycling paths |
| Parco della vittoria | A scenic park area that attracts visitors looking for green spaces and outdoor activities. Perfect for those who enjoy nature. | Parco della Vittoria, Walking paths, Biking trails, Picnic areas |
| San Giovanni in Marignano | A quaint nearby village known for its rural charm and traditional Italian ambiance. Attracts tourists interested in local culture and traditions. | Historic center, Church of San Giovanni Battista, Local wine tasting |
| Località Pian Ventoso | This area provides a more tranquil setting away from the busy beach but still close enough to enjoy Cattolica's attractions. | Scenic views, Nature walks, Peaceful accommodations |
| Gabbice Mare | A neighboring resort town that offers beautiful beaches and a relaxed atmosphere, great for vacationers looking for a quieter stay. | Beach Activities, Water sports, Local eateries |
| Cattolica Sea Park | Family-oriented area focusing on entertainment and amusement activities for all ages, ideal for attracting families. | Aquarium, Entertainment centers, Family-friendly restaurants |
| Riviera Romagnola | The larger coastal area where Cattolica is located, known for its hotels and tourism infrastructure. A prime target for Airbnb hosting due to tourist influx. | Attractions along the coast, Theme parks, Nightlife in nearby towns |
Understanding Airbnb License Requirements & STR Laws in Cattolica (2026)
Yes, Cattolica, Emilia-Romagna, Italy enforces high STR regulations. Obtaining a license and ensuring compliance is almost certainly required according to current 2026 STR laws. Always verify the latest short term rental regulations and Airbnb license requirements directly with local government authorities for Cattolica to ensure full compliance before hosting.
(Source: AirROI data, 2026, based on 87% licensed listings)
Top Performing Airbnb Properties in Cattolica (2026)
Benchmark your potential! Explore examples of top-performing Airbnb properties in Cattolicabased on Trailing Twelve Month (TTM) revenue. Analyze their characteristics, revenue, occupancy rate, and ADR to understand what drives success in this market.

Patty Sweet Home, Cattolica Centro
Entire Place • 2 bedrooms
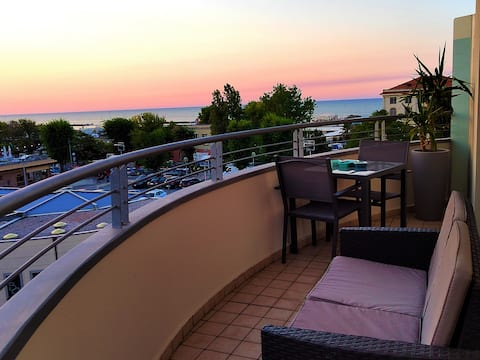
Superior Suite Penthouse on the Sea
Entire Place • 3 bedrooms

Bluemar Dolcemare - (105 sqm.)
Entire Place • 2 bedrooms

VistaMare Bluemar-Living the Sea
Entire Place • 2 bedrooms
Casa Adele
Entire Place • 2 bedrooms
Vista Mare Bluemar - The art of the Sea (105mq)
Entire Place • 2 bedrooms
Note: Performance varies based on location, size, amenities, seasonality, and management quality. Data reflects the past 12 months.
Top Performing Airbnb Hosts in Cattolica (2026)
Learn from the best! This table showcases top-performing Airbnb hosts in Cattolica based on the number of properties managed and estimated total revenue over the past year. Analyze their scale and performance metrics.
| Host Name | Properties | Grossing Revenue | Stay Reviews | Avg Rating |
|---|---|---|---|---|
| Alberto | 3 | $120,294 | 83 | 4.95/5.0 |
| Matteo | 2 | $101,236 | 144 | 4.96/5.0 |
| Marco | 7 | $78,452 | 18 | 4.72/5.0 |
| Amazhome | 5 | $54,023 | 28 | 4.92/5.0 |
| Cattolica For Family | 5 | $50,562 | 38 | 4.73/5.0 |
| Stefania | 1 | $50,086 | 23 | 5.00/5.0 |
| Residence | 4 | $40,622 | 46 | 4.88/5.0 |
| Diletta | 6 | $38,358 | 56 | 4.89/5.0 |
| Matteo | 4 | $34,655 | 8 | 4.50/5.0 |
| Novasol | 1 | $30,654 | 10 | 4.90/5.0 |
Analyzing the strategies of top hosts, such as their property selection, pricing, and guest communication, can offer valuable lessons for optimizing your own Airbnb operations in Cattolica.
Dive Deeper: Advanced Cattolica STR Market Data (2026)
Ready to unlock more insights? AirROI provides access to advanced metrics and comprehensive Airbnb data for Cattolica. Explore detailed analytics beyond this report to refine your investment strategy, optimize pricing, and maximize your vacation rental profits.
Explore Advanced MetricsCattolica Short-Term Rental Market Composition (2026): Property & Room Types
Room Type Distribution
Property Type Distribution
Market Composition Insights for Cattolica
- The Cattolica Airbnb market composition is heavily skewed towards Entire Home/Apt listings, which make up 87.7% of the 155 active rentals. This indicates strong guest preference for privacy and space.
- Looking at the property type distribution in Cattolica, Apartment/Condo properties are the most common (80.6%), reflecting the local real estate landscape.
- The presence of 7.7% Hotel/Boutique listings indicates integration with traditional hospitality.
Cattolica Airbnb Room Capacity Analysis (2026): Bedroom Distribution
Distribution of Listings by Number of Bedrooms
Room Capacity Insights for Cattolica
- The dominant room capacity in Cattolica is 1 bedroom listings, making up 41.3% of the market. This suggests a strong demand for properties suitable for couples or solo travelers.
- Together, 1 bedroom and 2 bedrooms properties represent 80.0% of the active Airbnb listings in Cattolica, indicating a high concentration in these sizes.
Cattolica Vacation Rental Guest Capacity Trends (2026)
Distribution of Listings by Guest Capacity
Guest Capacity Insights for Cattolica
- The most common guest capacity trend in Cattolica vacation rentals is listings accommodating 4 guests (36.1%). This suggests the primary traveler segment is likely small families or groups.
- Properties designed for 4 guests and 6 guests dominate the Cattolica STR market, accounting for 55.5% of listings.
- 27.8% of properties accommodate 6+ guests, serving the market segment for larger families or group travel in Cattolica.
- On average, properties in Cattolica are equipped to host 4.2 guests.
Cattolica Airbnb Booking Patterns (2026): Available vs. Booked Days
Available Days Distribution
Booked Days Distribution
Booking Pattern Insights for Cattolica
- The most common availability pattern in Cattolica falls within the 271-366 days range, representing 72.9% of listings. This suggests many properties have significant open periods on their calendars.
- Approximately 98.1% of listings show high availability (181+ days open annually), indicating potential for increased bookings or specific owner usage patterns.
- For booked days, the 31-90 days range is most frequent in Cattolica (38.7%), reflecting common guest stay durations or potential owner blocking patterns.
- A notable 1.9% of properties secure long booking periods (181+ days booked per year), highlighting successful long-term rental strategies or significant owner usage.
Cattolica Airbnb Minimum Stay Requirements Analysis
Distribution of Listings by Minimum Night Requirement
1 Night
15 listings
9.7% of total
2 Nights
9 listings
5.8% of total
3 Nights
12 listings
7.7% of total
4-6 Nights
24 listings
15.5% of total
7-29 Nights
21 listings
13.5% of total
30+ Nights
74 listings
47.7% of total
Key Insights
- The most prevalent minimum stay requirement in Cattolica is 30+ Nights, adopted by 47.7% of listings. This highlights the market's preference for longer commitments.
- Very short stays (1-2 nights) are less common (15.5%), suggesting hosts prefer slightly longer bookings to optimize turnover.
- A significant segment (47.7%) caters to monthly stays (30+ nights) in Cattolica, pointing to opportunities in the extended-stay market.
Recommendations
- Align with the market by considering a 30+ Nights minimum stay, as 47.7% of Cattolica hosts use this setting.
- If feasible, allowing 1-night stays, especially midweek or during low season, could capture last-minute bookings, as only 9.7% currently do.
- Explore offering discounts for stays of 30+ nights to attract the 47.7% of the market seeking extended stays.
- Adjust minimum nights based on seasonality – potentially shorter during low season and longer during peak demand periods in Cattolica.
Cattolica Airbnb Cancellation Policy Trends Analysis (2026)
Super Strict 30 Days
7 listings
4.5% of total
Super Strict 60 Days
6 listings
3.9% of total
Limited
4 listings
2.6% of total
Flexible
29 listings
18.7% of total
Moderate
54 listings
34.8% of total
Firm
45 listings
29% of total
Strict
10 listings
6.5% of total
Cancellation Policy Insights for Cattolica
- The prevailing Airbnb cancellation policy trend in Cattolica is Moderate, used by 34.8% of listings.
- There's a relatively balanced mix between guest-friendly (53.5%) and stricter (35.5%) policies, offering choices for different guest needs.
- Strict cancellation policies are quite rare (6.5%), potentially making listings with this policy less competitive unless justified by high demand or property type.
Recommendations for Hosts
- Consider adopting a Moderate policy to align with the 34.8% market standard in Cattolica.
- Using a Strict policy might deter some guests, as only 6.5% of listings use it. Evaluate if potential revenue protection outweighs possible lower booking rates.
- Regularly review your cancellation policy against competitors and market demand shifts in Cattolica.
Cattolica STR Booking Lead Time Analysis (2026)
Average Booking Lead Time by Month
Booking Lead Time Insights for Cattolica
- The overall average booking lead time for vacation rentals in Cattolica is 63 days.
- Guests book furthest in advance for stays during August (average 100 days), likely coinciding with peak travel demand or local events.
- The shortest booking windows occur for stays in February (average 21 days), indicating more last-minute travel plans during this time.
- Seasonally, Summer (75 days avg.) sees the longest lead times, while Winter (25 days avg.) has the shortest, reflecting typical travel planning cycles.
Recommendations for Hosts
- Use the overall average lead time (63 days) as a baseline for your pricing and availability strategy in Cattolica.
- For August stays, consider implementing length-of-stay discounts or slightly higher rates for bookings made less than 100 days out to capitalize on advance planning.
- Target marketing efforts for the Summer season well in advance (at least 75 days) to capture early planners.
- Monitor your own booking lead times against these Cattolica averages to identify opportunities for dynamic pricing adjustments.
Popular & Essential Airbnb Amenities in Cattolica (2026)
Amenity Prevalence
Amenity Insights for Cattolica
- Essential amenities in Cattolica that guests expect include: TV. Lacking these (this) could significantly impact bookings.
- Popular amenities like Air conditioning, Kitchen, Refrigerator are common but not universal. Offering these can provide a competitive edge.
Recommendations for Hosts
- Ensure your listing includes all essential amenities for Cattolica: TV.
- Prioritize adding missing essentials: TV.
- Consider adding popular differentiators like Air conditioning or Kitchen to increase appeal.
- Highlight unique or less common amenities you offer (e.g., hot tub, dedicated workspace, EV charger) in your listing description and photos.
- Regularly check competitor amenities in Cattolica to stay competitive.
Cattolica Airbnb Guest Demographics & Profile Analysis (2026)
Guest Profile Summary for Cattolica
- The typical guest profile for Airbnb in Cattolica consists of a mix of domestic (54%) and international guests, often arriving from nearby Milan, typically belonging to the Post-2000s (Gen Z/Alpha) group (50%), primarily speaking English or Italian.
- Domestic travelers account for 54.3% of guests.
- Key international markets include Italy (54.3%) and Germany (7.8%).
- Top languages spoken are English (32.9%) followed by Italian (23.4%).
- A significant demographic segment is the Post-2000s (Gen Z/Alpha) group, representing 50% of guests.
Recommendations for Hosts
- Balance marketing efforts between domestic and international channels based on the guest mix.
- Tailor amenities and listing descriptions to appeal to the dominant Post-2000s (Gen Z/Alpha) demographic (e.g., highlight fast WiFi, smart home features, local guides).
- Highlight unique local experiences or amenities relevant to the primary guest profile.
- Consider seasonal promotions aligned with peak travel times for key origin markets.
Nearby Short-Term Rental Market Comparison
How does the Cattolica Airbnb market stack up against its neighbors? Compare key performance metrics like average monthly revenue, ADR, and occupancy rates in surrounding areas to understand the broader regional STR landscape.
| Market | Active Properties | Monthly Revenue | Daily Rate | Avg. Occupancy |
|---|---|---|---|---|
| Tignano | 12 | $4,160 | $366.92 | 45% |
| Celleno | 13 | $4,041 | $594.80 | 28% |
| Marciano della Chiana | 17 | $3,823 | $545.25 | 35% |
| Buonconvento | 60 | $3,186 | $440.58 | 43% |
| Collevecchio | 14 | $3,140 | $334.97 | 40% |
| Radda in Chianti | 94 | $3,098 | $361.57 | 39% |
| Palombara Sabina | 15 | $2,914 | $309.11 | 38% |
| Impruneta | 146 | $2,887 | $297.45 | 40% |
| Lastra a Signa | 96 | $2,760 | $311.91 | 43% |
| Florence | 10,496 | $2,755 | $225.30 | 49% |