Bologna Airbnb Market Analysis 2026: Short Term Rental Data & Vacation Rental Statistics in Emilia-Romagna, Italy
Is Airbnb profitable in Bologna in 2026? Explore comprehensive Airbnb analytics for Bologna, Emilia-Romagna, Italy to uncover income potential. This 2026 STR market report for Bologna, based on AirROI data from February 2025 to January 2026, reveals key trends in the bustling market of 3,446 active listings.
Whether you're considering an Airbnb investment in Bologna, optimizing your existing vacation rental, or exploring rental arbitrage opportunities, understanding the Bologna Airbnb data is crucial. Navigating the high regulation landscape is key to maximizing your short term rental income potential. Let's dive into the specifics.
Key Bologna Airbnb Performance Metrics Overview
Monthly Airbnb Revenue Variations & Income Potential in Bologna (2026)
Understanding the monthly revenue variations for Airbnb listings in Bologna is key to maximizing your short term rental income potential. Seasonality significantly impacts earnings. Our analysis, based on data from the past 12 months, shows that the peak revenue month for STRs in Bologna is typically September, while January often presents the lowest earnings, highlighting opportunities for strategic pricing adjustments during shoulder and low seasons. Explore the typical Airbnb income in Bologna across different performance tiers:
- Best-in-class properties (Top 10%) achieve $5,172+ monthly, often utilizing dynamic pricing and superior guest experiences.
- Strong performing properties (Top 25%) earn $3,537 or more, indicating effective management and desirable locations/amenities.
- Typical properties (Median) generate around $2,278 per month, representing the average market performance.
- Entry-level properties (Bottom 25%) see earnings around $1,237, often with potential for optimization.
Average Monthly Airbnb Earnings Trend in Bologna
Bologna Airbnb Occupancy Rate Trends (2026)
Maximize your bookings by understanding the Bologna STR occupancy trends. Seasonal demand shifts significantly influence how often properties are booked. Typically, Aprilsees the highest demand (peak season occupancy), while January experiences the lowest (low season). Effective strategies, like adjusting minimum stays or offering promotions, can boost occupancy during slower periods. Here's how different property tiers perform in Bologna:
- Best-in-class properties (Top 10%) achieve 86%+ occupancy, indicating high desirability and potentially optimized availability.
- Strong performing properties (Top 25%) maintain 74% or higher occupancy, suggesting good market fit and guest satisfaction.
- Typical properties (Median) have an occupancy rate around 54%.
- Entry-level properties (Bottom 25%) average 28% occupancy, potentially facing higher vacancy.
Average Monthly Occupancy Rate Trend in Bologna
Average Daily Rate (ADR) Airbnb Trends in Bologna (2026)
Effective short term rental pricing strategy in Bologna involves understanding monthly ADR fluctuations. The Average Daily Rate (ADR) for Airbnb in Bologna typically peaks in September and dips lowest during February. Leveraging Airbnb dynamic pricing tools or strategies based on this seasonality can significantly boost revenue. Here's a look at the typical nightly rates achieved:
- Best-in-class properties (Top 10%) command rates of $278+ per night, often due to premium features or locations.
- Strong performing properties (Top 25%) achieve nightly rates of $193 or more.
- Typical properties (Median) charge around $139 per night.
- Entry-level properties (Bottom 25%) earn around $102 per night.
Average Daily Rate (ADR) Trend by Month in Bologna
Get Live Bologna Market Intelligence 👇

Explore Real-time Analytics
Airbnb Seasonality Analysis & Trends in Bologna (2026)
Peak Season (September, October, May)
- Revenue averages $3,663 per month
- Occupancy rates average 60.6%
- Daily rates average $188
Shoulder Season
- Revenue averages $2,784 per month
- Occupancy maintains around 53.5%
- Daily rates hold near $165
Low Season (January, February, December)
- Revenue drops to average $1,701 per month
- Occupancy decreases to average 37.0%
- Daily rates adjust to average $158
Seasonality Insights for Bologna
- The Airbnb seasonality in Bologna shows highly seasonal trends requiring careful strategy. While the sections above show seasonal averages, it's also insightful to look at the extremes:
- During the high season, the absolute peak month showcases Bologna's highest earning potential, with monthly revenues capable of climbing to $3,808, occupancy reaching a high of 62.5%, and ADRs peaking at $207.
- Conversely, the slowest single month of the year, typically falling within the low season, marks the market's lowest point. In this month, revenue might dip to $1,430, occupancy could drop to 29.6%, and ADRs may adjust down to $141.
- Understanding both the seasonal averages and these monthly peaks and troughs in revenue, occupancy, and ADR is crucial for maximizing your Airbnb profit potential in Bologna.
Seasonal Strategies for Maximizing Profit
- Peak Season: Maximize revenue through premium pricing and potentially longer minimum stays. Ensure high availability.
- Low Season: Offer competitive pricing, special promotions (e.g., extended stay discounts), and flexible cancellation policies. Target off-season travelers like remote workers or budget-conscious guests.
- Shoulder Seasons: Implement dynamic pricing that balances peak and low rates. Target weekend travelers or specific events. Offer slightly more flexible terms than peak season.
- Regularly analyze your own performance against these Bologna seasonality benchmarks and adjust your pricing and availability strategy accordingly.
Best Areas for Airbnb Investment in Bologna (2026)
Exploring the top neighborhoods for short-term rentals in Bologna? This section highlights key areas, outlining why they are attractive for hosts and guests, along with notable local attractions. Consider these locations based on your target guest profile and investment strategy.
| Neighborhood / Area | Why Host Here? (Target Guests & Appeal) | Key Attractions & Landmarks |
|---|---|---|
| Centro Storico | The historic center of Bologna, filled with medieval architecture, museums, and vibrant street life. A prime location for tourists who want to experience the local culture and cuisine. | Piazza Maggiore, Basilica di San Petronio, Two Towers (Le Due Torri), Palazzo Comunale, Archiginnasio of Bologna, Via dell'Indipendenza |
| Bologna Fiera | This area is known for its trade shows and exhibitions, making it ideal for business travelers. It's close to the fairgrounds and well-connected to the city center. | Fiera di Bologna, Montagnola Park, Museum of Modern Art of Bologna, Via Zamboni, Palazzo della Regione |
| Santo Stefano | A charming district with picturesque streets, local shops, and famous restaurants. A great area for those looking to enjoy a quieter, yet culturally rich experience. | Basilica di Santo Stefano, Giardini Margherita, San Domenico, Santa Maria della Vita, Oratorio di Santa Cecilia |
| Bologna Navile | This area is known for its canals and green spaces, making it a unique spot for visitors who want to relax away from the bustling city center. | Canale delle Moline, Parco Montanari, Porte Galliera, Museo per la Memoria di Ustica |
| Via Indipendenza | A major shopping street that attracts tourists and locals alike. It's the perfect location for those looking for easy access to shopping, dining, and cultural experiences. | Shopping boutiques, Restored historic buildings, Teatro Arena del Sole, Piazza del Nettuno |
| San Vitale | A lively residential area with a mix of students and families. Close to the University of Bologna, attracting young travelers and academic visitors. | University of Bologna, Piazza San Vitale, Basilica di San Domenico, Piazza San Francesco |
| Borgo Panigale | Renowned for being the home of Ducati, this area appeals to motorsport enthusiasts. It's a bit outside the city but offers a different cultural experience. | Ducati Museum, Puccini Park, Parco della Resistenza |
| Saragozza | Known for its beautiful porticoed streets and proximity to the hills, this area attracts walkers and those who enjoy nature, as well as local eateries. | Portico di San Luca, Santuario di Madonna di San Luca, Giardini di Villa Aldini |
Understanding Airbnb License Requirements & STR Laws in Bologna (2026)
Yes, Bologna, Emilia-Romagna, Italy enforces high STR regulations. Obtaining a license and ensuring compliance is almost certainly required according to current 2026 STR laws. Always verify the latest short term rental regulations and Airbnb license requirements directly with local government authorities for Bologna to ensure full compliance before hosting.
(Source: AirROI data, 2026, based on 89% licensed listings)
Top Performing Airbnb Properties in Bologna (2026)
Benchmark your potential! Explore examples of top-performing Airbnb properties in Bolognabased on Trailing Twelve Month (TTM) revenue. Analyze their characteristics, revenue, occupancy rate, and ADR to understand what drives success in this market.
Villa Bottrigari - 5 Apartments
Entire Place • 5 bedrooms
Private bathroom, Garage included in the price
Private Room • N/A
San Vitale 5 Stelle - Central Luxury Apartment
Entire Place • 3 bedrooms
Marchesana Luxury - 200sqm apartment
Entire Place • 3 bedrooms
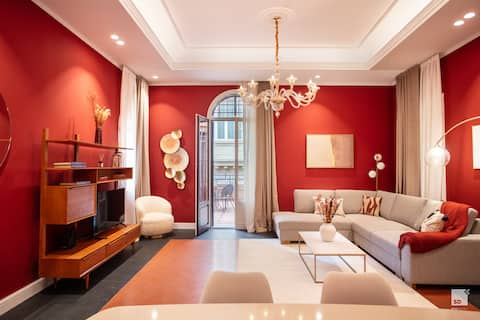
Urban Jungle
Entire Place • 3 bedrooms
![[City centre] Beautiful cottage with garden](https://a0.muscache.com/im/pictures/miso/Hosting-1112088267574821032/original/e171401d-d146-4eeb-8bfd-fd0c21cdc584.jpeg?im_w=480&im_format=avif)
[City centre] Beautiful cottage with garden
Entire Place • 2 bedrooms
Note: Performance varies based on location, size, amenities, seasonality, and management quality. Data reflects the past 12 months.
Top Performing Airbnb Hosts in Bologna (2026)
Learn from the best! This table showcases top-performing Airbnb hosts in Bologna based on the number of properties managed and estimated total revenue over the past year. Analyze their scale and performance metrics.
| Host Name | Properties | Grossing Revenue | Stay Reviews | Avg Rating |
|---|---|---|---|---|
| Luca | 60 | $2,284,060 | 2503 | 4.47/5.0 |
| Wonderful Italy Emilia-Romagna | 118 | $2,233,441 | 2271 | 4.32/5.0 |
| Realkasa | 86 | $2,126,385 | 2932 | 4.52/5.0 |
| Welcome To Emilia Romagna & Ma | 72 | $2,109,532 | 4887 | 4.40/5.0 |
| Patrizio | 53 | $1,892,798 | 1667 | 4.70/5.0 |
| Rambaldo | 28 | $1,526,342 | 2186 | 4.77/5.0 |
| Nicola | 24 | $1,229,129 | 1268 | 4.70/5.0 |
| Rino | 36 | $1,173,720 | 575 | 4.71/5.0 |
| Design Club Collection | 35 | $1,132,478 | 3544 | 4.74/5.0 |
| Valerio | 23 | $1,095,012 | 951 | 4.77/5.0 |
Analyzing the strategies of top hosts, such as their property selection, pricing, and guest communication, can offer valuable lessons for optimizing your own Airbnb operations in Bologna.
Dive Deeper: Advanced Bologna STR Market Data (2026)
Ready to unlock more insights? AirROI provides access to advanced metrics and comprehensive Airbnb data for Bologna. Explore detailed analytics beyond this report to refine your investment strategy, optimize pricing, and maximize your vacation rental profits.
Explore Advanced MetricsBologna Short-Term Rental Market Composition (2026): Property & Room Types
Room Type Distribution
Property Type Distribution
Market Composition Insights for Bologna
- The Bologna Airbnb market composition is heavily skewed towards Entire Home/Apt listings, which make up 81.9% of the 3,446 active rentals. This indicates strong guest preference for privacy and space.
- Looking at the property type distribution in Bologna, Apartment/Condo properties are the most common (76.6%), reflecting the local real estate landscape.
- Houses represent a significant 16.6% portion, catering likely to families or larger groups.
- The presence of 6.2% Hotel/Boutique listings indicates integration with traditional hospitality.
- Smaller segments like others, unique stays, outdoor/unique (combined 0.8%) offer potential for unique stay experiences.
Bologna Airbnb Room Capacity Analysis (2026): Bedroom Distribution
Distribution of Listings by Number of Bedrooms
Room Capacity Insights for Bologna
- The dominant room capacity in Bologna is 1 bedroom listings, making up 52.6% of the market. This suggests a strong demand for properties suitable for couples or solo travelers.
- Together, 1 bedroom and 2 bedrooms properties represent 75.8% of the active Airbnb listings in Bologna, indicating a high concentration in these sizes.
- With over half the market (52.6%) consisting of studios or 1-bedroom units, Bologna is particularly well-suited for individuals or couples.
- Listings with 3+ bedrooms (5.8%) represent a smaller niche, potentially indicating an underserved market for larger group accommodations in Bologna.
Bologna Vacation Rental Guest Capacity Trends (2026)
Distribution of Listings by Guest Capacity
Guest Capacity Insights for Bologna
- The most common guest capacity trend in Bologna vacation rentals is listings accommodating 4 guests (32.1%). This suggests the primary traveler segment is likely small families or groups.
- Properties designed for 4 guests and 2 guests dominate the Bologna STR market, accounting for 50.8% of listings.
- 13.0% of properties accommodate 6+ guests, serving the market segment for larger families or group travel in Bologna.
- On average, properties in Bologna are equipped to host 3.2 guests.
Bologna Airbnb Booking Patterns (2026): Available vs. Booked Days
Available Days Distribution
Booked Days Distribution
Booking Pattern Insights for Bologna
- The most common availability pattern in Bologna falls within the 271-366 days range, representing 31.8% of listings. This suggests many properties have significant open periods on their calendars.
- Approximately 60.4% of listings show high availability (181+ days open annually), indicating potential for increased bookings or specific owner usage patterns.
- For booked days, the 181-270 days range is most frequent in Bologna (29.6%), reflecting common guest stay durations or potential owner blocking patterns.
- A notable 41.1% of properties secure long booking periods (181+ days booked per year), highlighting successful long-term rental strategies or significant owner usage.
Bologna Airbnb Minimum Stay Requirements Analysis
Distribution of Listings by Minimum Night Requirement
1 Night
830 listings
24.1% of total
2 Nights
673 listings
19.5% of total
3 Nights
121 listings
3.5% of total
4-6 Nights
156 listings
4.5% of total
7-29 Nights
133 listings
3.9% of total
30+ Nights
1531 listings
44.5% of total
Key Insights
- The most prevalent minimum stay requirement in Bologna is 30+ Nights, adopted by 44.5% of listings. This highlights the market's preference for longer commitments.
- A significant segment (44.5%) caters to monthly stays (30+ nights) in Bologna, pointing to opportunities in the extended-stay market.
Recommendations
- Align with the market by considering a 30+ Nights minimum stay, as 44.5% of Bologna hosts use this setting.
- If feasible, allowing 1-night stays, especially midweek or during low season, could capture last-minute bookings, as only 24.1% currently do.
- Explore offering discounts for stays of 30+ nights to attract the 44.5% of the market seeking extended stays.
- Adjust minimum nights based on seasonality – potentially shorter during low season and longer during peak demand periods in Bologna.
Bologna Airbnb Cancellation Policy Trends Analysis (2026)
Super Strict 30 Days
76 listings
2.2% of total
Limited
127 listings
3.7% of total
Super Strict 60 Days
13 listings
0.4% of total
Flexible
815 listings
23.7% of total
Moderate
1956 listings
56.8% of total
Firm
397 listings
11.5% of total
Strict
57 listings
1.7% of total
Cancellation Policy Insights for Bologna
- The prevailing Airbnb cancellation policy trend in Bologna is Moderate, used by 56.8% of listings.
- The market strongly favors guest-friendly terms, with 80.5% of listings offering Flexible or Moderate policies. This suggests guests in Bologna may expect booking flexibility.
- Strict cancellation policies are quite rare (1.7%), potentially making listings with this policy less competitive unless justified by high demand or property type.
Recommendations for Hosts
- Consider adopting a Moderate policy to align with the 56.8% market standard in Bologna.
- Using a Strict policy might deter some guests, as only 1.7% of listings use it. Evaluate if potential revenue protection outweighs possible lower booking rates.
- Regularly review your cancellation policy against competitors and market demand shifts in Bologna.
Bologna STR Booking Lead Time Analysis (2026)
Average Booking Lead Time by Month
Booking Lead Time Insights for Bologna
- The overall average booking lead time for vacation rentals in Bologna is 57 days.
- Guests book furthest in advance for stays during May (average 76 days), likely coinciding with peak travel demand or local events.
- The shortest booking windows occur for stays in February (average 34 days), indicating more last-minute travel plans during this time.
- Seasonally, Spring (67 days avg.) sees the longest lead times, while Winter (39 days avg.) has the shortest, reflecting typical travel planning cycles.
Recommendations for Hosts
- Use the overall average lead time (57 days) as a baseline for your pricing and availability strategy in Bologna.
- For May stays, consider implementing length-of-stay discounts or slightly higher rates for bookings made less than 76 days out to capitalize on advance planning.
- Target marketing efforts for the Spring season well in advance (at least 67 days) to capture early planners.
- Monitor your own booking lead times against these Bologna averages to identify opportunities for dynamic pricing adjustments.
Popular & Essential Airbnb Amenities in Bologna (2026)
Amenity Prevalence
Amenity Insights for Bologna
- Essential amenities in Bologna that guests expect include: Wifi, Heating. Lacking these (any) could significantly impact bookings.
- Popular amenities like Hair dryer, Hot water, TV are common but not universal. Offering these can provide a competitive edge.
Recommendations for Hosts
- Ensure your listing includes all essential amenities for Bologna: Wifi, Heating.
- Prioritize adding missing essentials: Wifi, Heating.
- Consider adding popular differentiators like Hair dryer or Hot water to increase appeal.
- Highlight unique or less common amenities you offer (e.g., hot tub, dedicated workspace, EV charger) in your listing description and photos.
- Regularly check competitor amenities in Bologna to stay competitive.
Bologna Airbnb Guest Demographics & Profile Analysis (2026)
Guest Profile Summary for Bologna
- The typical guest profile for Airbnb in Bologna consists of predominantly international visitors (88%), with top international origins including United Kingdom, typically belonging to the Post-2000s (Gen Z/Alpha) group (50%), primarily speaking English or Italian.
- Domestic travelers account for 11.8% of guests.
- Key international markets include United States (19.2%) and United Kingdom (14.7%).
- Top languages spoken are English (42.2%) followed by Italian (10.4%).
- A significant demographic segment is the Post-2000s (Gen Z/Alpha) group, representing 50% of guests.
Recommendations for Hosts
- Focus marketing internationally, particularly towards travelers from United Kingdom.
- Tailor amenities and listing descriptions to appeal to the dominant Post-2000s (Gen Z/Alpha) demographic (e.g., highlight fast WiFi, smart home features, local guides).
- Highlight unique local experiences or amenities relevant to the primary guest profile.
- Consider seasonal promotions aligned with peak travel times for key origin markets.
Nearby Short-Term Rental Market Comparison
How does the Bologna Airbnb market stack up against its neighbors? Compare key performance metrics like average monthly revenue, ADR, and occupancy rates in surrounding areas to understand the broader regional STR landscape.
| Market | Active Properties | Monthly Revenue | Daily Rate | Avg. Occupancy |
|---|---|---|---|---|
| Tignano | 12 | $4,160 | $366.92 | 45% |
| Marciano della Chiana | 17 | $3,823 | $545.25 | 35% |
| Castelfranco di Sotto | 47 | $3,777 | $377.39 | 39% |
| Buonconvento | 60 | $3,186 | $440.58 | 43% |
| Radda in Chianti | 94 | $3,098 | $361.57 | 39% |
| Venice | 6,889 | $2,992 | $246.20 | 47% |
| Impruneta | 146 | $2,887 | $297.45 | 40% |
| Lastra a Signa | 96 | $2,760 | $311.91 | 43% |
| Florence | 10,496 | $2,755 | $225.30 | 49% |
| Marcialla | 29 | $2,745 | $263.00 | 48% |