Trani Airbnb Market Analysis 2026: Short Term Rental Data & Vacation Rental Statistics in Apulia, Italy
Is Airbnb profitable in Trani in 2026? Explore comprehensive Airbnb analytics for Trani, Apulia, Italy to uncover income potential. This 2026 STR market report for Trani, based on AirROI data from February 2025 to January 2026, reveals key trends in the market of 258 active listings.
Whether you're considering an Airbnb investment in Trani, optimizing your existing vacation rental, or exploring rental arbitrage opportunities, understanding the Trani Airbnb data is crucial. Navigating the high regulation landscape is key to maximizing your short term rental income potential. Let's dive into the specifics.
Key Trani Airbnb Performance Metrics Overview
Monthly Airbnb Revenue Variations & Income Potential in Trani (2026)
Understanding the monthly revenue variations for Airbnb listings in Trani is key to maximizing your short term rental income potential. Seasonality significantly impacts earnings. Our analysis, based on data from the past 12 months, shows that the peak revenue month for STRs in Trani is typically August, while January often presents the lowest earnings, highlighting opportunities for strategic pricing adjustments during shoulder and low seasons. Explore the typical Airbnb income in Trani across different performance tiers:
- Best-in-class properties (Top 10%) achieve $2,083+ monthly, often utilizing dynamic pricing and superior guest experiences.
- Strong performing properties (Top 25%) earn $1,339 or more, indicating effective management and desirable locations/amenities.
- Typical properties (Median) generate around $740 per month, representing the average market performance.
- Entry-level properties (Bottom 25%) see earnings around $370, often with potential for optimization.
Average Monthly Airbnb Earnings Trend in Trani
Trani Airbnb Occupancy Rate Trends (2026)
Maximize your bookings by understanding the Trani STR occupancy trends. Seasonal demand shifts significantly influence how often properties are booked. Typically, Augustsees the highest demand (peak season occupancy), while January experiences the lowest (low season). Effective strategies, like adjusting minimum stays or offering promotions, can boost occupancy during slower periods. Here's how different property tiers perform in Trani:
- Best-in-class properties (Top 10%) achieve 62%+ occupancy, indicating high desirability and potentially optimized availability.
- Strong performing properties (Top 25%) maintain 44% or higher occupancy, suggesting good market fit and guest satisfaction.
- Typical properties (Median) have an occupancy rate around 25%.
- Entry-level properties (Bottom 25%) average 13% occupancy, potentially facing higher vacancy.
Average Monthly Occupancy Rate Trend in Trani
Average Daily Rate (ADR) Airbnb Trends in Trani (2026)
Effective short term rental pricing strategy in Trani involves understanding monthly ADR fluctuations. The Average Daily Rate (ADR) for Airbnb in Trani typically peaks in August and dips lowest during November. Leveraging Airbnb dynamic pricing tools or strategies based on this seasonality can significantly boost revenue. Here's a look at the typical nightly rates achieved:
- Best-in-class properties (Top 10%) command rates of $171+ per night, often due to premium features or locations.
- Strong performing properties (Top 25%) achieve nightly rates of $118 or more.
- Typical properties (Median) charge around $90 per night.
- Entry-level properties (Bottom 25%) earn around $74 per night.
Average Daily Rate (ADR) Trend by Month in Trani
Get Live Trani Market Intelligence 👇

Explore Real-time Analytics
Airbnb Seasonality Analysis & Trends in Trani (2026)
Peak Season (August, July, September)
- Revenue averages $1,611 per month
- Occupancy rates average 43.4%
- Daily rates average $120
Shoulder Season
- Revenue averages $883 per month
- Occupancy maintains around 28.9%
- Daily rates hold near $108
Low Season (January, February, December)
- Revenue drops to average $587 per month
- Occupancy decreases to average 20.6%
- Daily rates adjust to average $104
Seasonality Insights for Trani
- The Airbnb seasonality in Trani shows highly seasonal trends requiring careful strategy. While the sections above show seasonal averages, it's also insightful to look at the extremes:
- During the high season, the absolute peak month showcases Trani's highest earning potential, with monthly revenues capable of climbing to $2,060, occupancy reaching a high of 52.0%, and ADRs peaking at $128.
- Conversely, the slowest single month of the year, typically falling within the low season, marks the market's lowest point. In this month, revenue might dip to $531, occupancy could drop to 16.8%, and ADRs may adjust down to $103.
- Understanding both the seasonal averages and these monthly peaks and troughs in revenue, occupancy, and ADR is crucial for maximizing your Airbnb profit potential in Trani.
Seasonal Strategies for Maximizing Profit
- Peak Season: Maximize revenue through premium pricing and potentially longer minimum stays. Ensure high availability.
- Low Season: Offer competitive pricing, special promotions (e.g., extended stay discounts), and flexible cancellation policies. Target off-season travelers like remote workers or budget-conscious guests.
- Shoulder Seasons: Implement dynamic pricing that balances peak and low rates. Target weekend travelers or specific events. Offer slightly more flexible terms than peak season.
- Regularly analyze your own performance against these Trani seasonality benchmarks and adjust your pricing and availability strategy accordingly.
Best Areas for Airbnb Investment in Trani (2026)
Exploring the top neighborhoods for short-term rentals in Trani? This section highlights key areas, outlining why they are attractive for hosts and guests, along with notable local attractions. Consider these locations based on your target guest profile and investment strategy.
| Neighborhood / Area | Why Host Here? (Target Guests & Appeal) | Key Attractions & Landmarks |
|---|---|---|
| Centro Storico | The historic center of Trani is a beautiful area with charming narrow streets, perfect for tourists. It's known for its stunning Cathedral and vibrant local culture. | Trani Cathedral, Castello Svevo di Trani, Piazza Duomo, Palazzo Caccini, Marina di Trani, Local restaurants and shops |
| Porto di Trani | The harbor area is lively and picturesque, making it a favorite for visitors looking to enjoy seafood, boat tours and the marina atmosphere. | Trani Marina, Fish Market, Seafood restaurants, Boat tours, Sunset views, Nearby beaches |
| Borgo Antico | The old village is full of history and charm, offering an authentic Italian experience with local artisan shops and beautiful views. | Castello di Trani, Piazza Libertà, Artisan shops, Local festivals, Seaside walks |
| Spiaggia di Trani | Trani's beach area attracts sun-seekers and families, offering sandy beaches and beach clubs. | Sandy beaches, Beach clubs, Sun loungers, Water sports, Lifeguard stations |
| Via Bovio | This promenade along the seafront is popular for evening strolls, dining and entertainment, drawing locals and tourists alike. | Seaside restaurants, Gelato shops, Walking paths, Public art, Events and performances |
| Viale Martiri della Libertà | A lively street that offers shopping and dining, making it a great area for tourists to stay for convenience and local flair. | Shopping boutiques, Cafés and trattorias, Local markets, Cultural events, Street performances |
| Convento di San Francesco | This historical area is known for its beautiful convent and garden, perfect for those seeking peace and scenic views. | San Francesco Convent, Gardens, Cultural events, Art exhibitions, Historical tours |
| Località Barletta | Nearby Barletta is a vibrant town with a rich history, offering additional attractions and enhancing Trani's appeal to visitors. | Colossus of Barletta, Castello di Barletta, Shopping in the historic center, Cultural events, Art galleries |
Understanding Airbnb License Requirements & STR Laws in Trani (2026)
Yes, Trani, Apulia, Italy enforces high STR regulations. Obtaining a license and ensuring compliance is almost certainly required according to current 2026 STR laws. Always verify the latest short term rental regulations and Airbnb license requirements directly with local government authorities for Trani to ensure full compliance before hosting.
(Source: AirROI data, 2026, based on 83% licensed listings)
Top Performing Airbnb Properties in Trani (2026)
Benchmark your potential! Explore examples of top-performing Airbnb properties in Tranibased on Trailing Twelve Month (TTM) revenue. Analyze their characteristics, revenue, occupancy rate, and ADR to understand what drives success in this market.
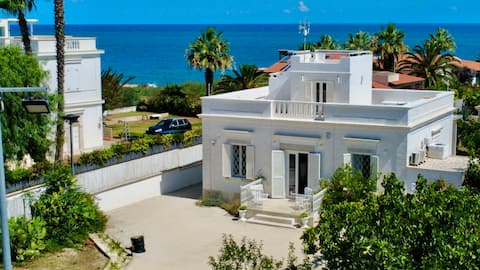
Villa Matinella by the sea
Entire Place • 3 bedrooms

Stunning view apartment on the port of Trani
Entire Place • 2 bedrooms

PalazzoBianchi-Dominus apartament with harbor view
Entire Place • 3 bedrooms

Maresia Trani - Alessandra and Giovanna
Private Room • 3 bedrooms
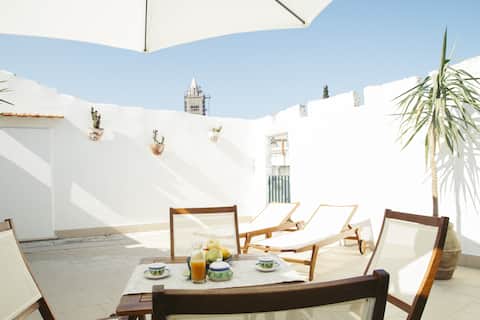
Palazzo Bianchi - CAMPANARIUM Flat PRIVATE terrace
Entire Place • 1 bedroom

Sea view apartment on the harbor of Trani
Entire Place • 1 bedroom
Note: Performance varies based on location, size, amenities, seasonality, and management quality. Data reflects the past 12 months.
Top Performing Airbnb Hosts in Trani (2026)
Learn from the best! This table showcases top-performing Airbnb hosts in Trani based on the number of properties managed and estimated total revenue over the past year. Analyze their scale and performance metrics.
| Host Name | Properties | Grossing Revenue | Stay Reviews | Avg Rating |
|---|---|---|---|---|
| GuestHost - Welcome To Our Hom | 43 | $173,837 | 244 | 4.32/5.0 |
| Sara | 2 | $63,735 | 258 | 4.87/5.0 |
| Ds | 6 | $59,840 | 400 | 4.89/5.0 |
| Doriana | 6 | $47,237 | 140 | 4.75/5.0 |
| Sergio | 1 | $41,464 | 53 | 5.00/5.0 |
| Giacomo | 5 | $36,818 | 521 | 4.85/5.0 |
| Riccardina | 5 | $35,860 | 158 | 4.78/5.0 |
| Francesca | 1 | $35,764 | 52 | 4.96/5.0 |
| Silvana | 7 | $33,037 | 71 | 4.72/5.0 |
| Alessandra | 1 | $32,120 | 72 | 5.00/5.0 |
Analyzing the strategies of top hosts, such as their property selection, pricing, and guest communication, can offer valuable lessons for optimizing your own Airbnb operations in Trani.
Dive Deeper: Advanced Trani STR Market Data (2026)
Ready to unlock more insights? AirROI provides access to advanced metrics and comprehensive Airbnb data for Trani. Explore detailed analytics beyond this report to refine your investment strategy, optimize pricing, and maximize your vacation rental profits.
Explore Advanced MetricsTrani Short-Term Rental Market Composition (2026): Property & Room Types
Room Type Distribution
Property Type Distribution
Market Composition Insights for Trani
- The Trani Airbnb market composition is heavily skewed towards Entire Home/Apt listings, which make up 69% of the 258 active rentals. This indicates strong guest preference for privacy and space.
- However, a notable 30.6% share for Private Rooms suggests opportunities for budget-conscious travelers or hosts renting out spare rooms.
- Looking at the property type distribution in Trani, Apartment/Condo properties are the most common (58.1%), reflecting the local real estate landscape.
- Houses represent a significant 20.9% portion, catering likely to families or larger groups.
- The presence of 17.8% Hotel/Boutique listings indicates integration with traditional hospitality.
- Smaller segments like outdoor/unique, others, unique stays (combined 3.1%) offer potential for unique stay experiences.
Trani Airbnb Room Capacity Analysis (2026): Bedroom Distribution
Distribution of Listings by Number of Bedrooms
Room Capacity Insights for Trani
- The dominant room capacity in Trani is 1 bedroom listings, making up 50.8% of the market. This suggests a strong demand for properties suitable for couples or solo travelers.
- Together, 1 bedroom and 2 bedrooms properties represent 69.0% of the active Airbnb listings in Trani, indicating a high concentration in these sizes.
- With over half the market (50.8%) consisting of studios or 1-bedroom units, Trani is particularly well-suited for individuals or couples.
- Listings with 3+ bedrooms (7.8%) represent a smaller niche, potentially indicating an underserved market for larger group accommodations in Trani.
Trani Vacation Rental Guest Capacity Trends (2026)
Distribution of Listings by Guest Capacity
Guest Capacity Insights for Trani
- The most common guest capacity trend in Trani vacation rentals is listings accommodating 4 guests (32.6%). This suggests the primary traveler segment is likely small families or groups.
- Properties designed for 4 guests and 2 guests dominate the Trani STR market, accounting for 48.1% of listings.
- 13.6% of properties accommodate 6+ guests, serving the market segment for larger families or group travel in Trani.
- On average, properties in Trani are equipped to host 3.0 guests.
Trani Airbnb Booking Patterns (2026): Available vs. Booked Days
Available Days Distribution
Booked Days Distribution
Booking Pattern Insights for Trani
- The most common availability pattern in Trani falls within the 271-366 days range, representing 69.8% of listings. This suggests many properties have significant open periods on their calendars.
- Approximately 95.8% of listings show high availability (181+ days open annually), indicating potential for increased bookings or specific owner usage patterns.
- For booked days, the 31-90 days range is most frequent in Trani (40.7%), reflecting common guest stay durations or potential owner blocking patterns.
- A notable 4.7% of properties secure long booking periods (181+ days booked per year), highlighting successful long-term rental strategies or significant owner usage.
Trani Airbnb Minimum Stay Requirements Analysis
Distribution of Listings by Minimum Night Requirement
1 Night
79 listings
30.6% of total
2 Nights
33 listings
12.8% of total
3 Nights
13 listings
5% of total
4-6 Nights
11 listings
4.3% of total
7-29 Nights
7 listings
2.7% of total
30+ Nights
115 listings
44.6% of total
Key Insights
- The most prevalent minimum stay requirement in Trani is 30+ Nights, adopted by 44.6% of listings. This highlights the market's preference for longer commitments.
- A significant segment (44.6%) caters to monthly stays (30+ nights) in Trani, pointing to opportunities in the extended-stay market.
Recommendations
- Align with the market by considering a 30+ Nights minimum stay, as 44.6% of Trani hosts use this setting.
- Explore offering discounts for stays of 30+ nights to attract the 44.6% of the market seeking extended stays.
- Adjust minimum nights based on seasonality – potentially shorter during low season and longer during peak demand periods in Trani.
Trani Airbnb Cancellation Policy Trends Analysis (2026)
Super Strict 30 Days
6 listings
2.3% of total
Super Strict 60 Days
3 listings
1.2% of total
Limited
3 listings
1.2% of total
Flexible
75 listings
29.1% of total
Moderate
128 listings
49.6% of total
Firm
32 listings
12.4% of total
Strict
11 listings
4.3% of total
Cancellation Policy Insights for Trani
- The prevailing Airbnb cancellation policy trend in Trani is Moderate, used by 49.6% of listings.
- The market strongly favors guest-friendly terms, with 78.7% of listings offering Flexible or Moderate policies. This suggests guests in Trani may expect booking flexibility.
- Strict cancellation policies are quite rare (4.3%), potentially making listings with this policy less competitive unless justified by high demand or property type.
Recommendations for Hosts
- Consider adopting a Moderate policy to align with the 49.6% market standard in Trani.
- Using a Strict policy might deter some guests, as only 4.3% of listings use it. Evaluate if potential revenue protection outweighs possible lower booking rates.
- Regularly review your cancellation policy against competitors and market demand shifts in Trani.
Trani STR Booking Lead Time Analysis (2026)
Average Booking Lead Time by Month
Booking Lead Time Insights for Trani
- The overall average booking lead time for vacation rentals in Trani is 47 days.
- Guests book furthest in advance for stays during August (average 71 days), likely coinciding with peak travel demand or local events.
- The shortest booking windows occur for stays in February (average 20 days), indicating more last-minute travel plans during this time.
- Seasonally, Fall (61 days avg.) sees the longest lead times, while Winter (37 days avg.) has the shortest, reflecting typical travel planning cycles.
Recommendations for Hosts
- Use the overall average lead time (47 days) as a baseline for your pricing and availability strategy in Trani.
- For August stays, consider implementing length-of-stay discounts or slightly higher rates for bookings made less than 71 days out to capitalize on advance planning.
- Target marketing efforts for the Fall season well in advance (at least 61 days) to capture early planners.
- Monitor your own booking lead times against these Trani averages to identify opportunities for dynamic pricing adjustments.
Popular & Essential Airbnb Amenities in Trani (2026)
Amenity Prevalence
Amenity Insights for Trani
- Essential amenities in Trani that guests expect include: Wifi, Air conditioning. Lacking these (any) could significantly impact bookings.
- Popular amenities like Hair dryer, TV, Heating are common but not universal. Offering these can provide a competitive edge.
Recommendations for Hosts
- Ensure your listing includes all essential amenities for Trani: Wifi, Air conditioning.
- Prioritize adding missing essentials: Wifi, Air conditioning.
- Consider adding popular differentiators like Hair dryer or TV to increase appeal.
- Highlight unique or less common amenities you offer (e.g., hot tub, dedicated workspace, EV charger) in your listing description and photos.
- Regularly check competitor amenities in Trani to stay competitive.
Trani Airbnb Guest Demographics & Profile Analysis (2026)
Guest Profile Summary for Trani
- The typical guest profile for Airbnb in Trani consists of predominantly international visitors (75%), with top international origins including France, typically belonging to the Post-2000s (Gen Z/Alpha) group (50%), primarily speaking English or Italian.
- Domestic travelers account for 24.7% of guests.
- Key international markets include Italy (24.7%) and France (15.1%).
- Top languages spoken are English (36.8%) followed by Italian (16.9%).
- A significant demographic segment is the Post-2000s (Gen Z/Alpha) group, representing 50% of guests.
Recommendations for Hosts
- Focus marketing internationally, particularly towards travelers from France.
- Tailor amenities and listing descriptions to appeal to the dominant Post-2000s (Gen Z/Alpha) demographic (e.g., highlight fast WiFi, smart home features, local guides).
- Highlight unique local experiences or amenities relevant to the primary guest profile.
- Consider seasonal promotions aligned with peak travel times for key origin markets.
Nearby Short-Term Rental Market Comparison
How does the Trani Airbnb market stack up against its neighbors? Compare key performance metrics like average monthly revenue, ADR, and occupancy rates in surrounding areas to understand the broader regional STR landscape.
| Market | Active Properties | Monthly Revenue | Daily Rate | Avg. Occupancy |
|---|---|---|---|---|
| San Michele Salentino | 76 | $2,635 | $296.04 | 46% |
| Torchiara | 18 | $2,501 | $338.25 | 27% |
| Majkovi | 21 | $2,320 | $268.88 | 43% |
| Giungano | 12 | $2,293 | $256.14 | 39% |
| Castellana Grotte | 194 | $2,129 | $242.07 | 42% |
| Carovigno | 442 | $2,005 | $283.77 | 41% |
| Polignano a Mare | 718 | $1,915 | $201.20 | 43% |
| San Vito dei Normanni | 168 | $1,885 | $272.31 | 42% |
| Ostuni | 1,596 | $1,855 | $262.11 | 37% |
| Laureana Cilento | 32 | $1,821 | $238.50 | 33% |