Porto Cesareo Airbnb Market Analysis 2026: Short Term Rental Data & Vacation Rental Statistics in Apulia, Italy
Is Airbnb profitable in Porto Cesareo in 2026? Explore comprehensive Airbnb analytics for Porto Cesareo, Apulia, Italy to uncover income potential. This 2026 STR market report for Porto Cesareo, based on AirROI data from February 2025 to January 2026, reveals key trends in the market of 921 active listings.
Whether you're considering an Airbnb investment in Porto Cesareo, optimizing your existing vacation rental, or exploring rental arbitrage opportunities, understanding the Porto Cesareo Airbnb data is crucial. Navigating the high regulation landscape is key to maximizing your short term rental income potential. Let's dive into the specifics.
Key Porto Cesareo Airbnb Performance Metrics Overview
Monthly Airbnb Revenue Variations & Income Potential in Porto Cesareo (2026)
Understanding the monthly revenue variations for Airbnb listings in Porto Cesareo is key to maximizing your short term rental income potential. Seasonality significantly impacts earnings. Our analysis, based on data from the past 12 months, shows that the peak revenue month for STRs in Porto Cesareo is typically August, while February often presents the lowest earnings, highlighting opportunities for strategic pricing adjustments during shoulder and low seasons. Explore the typical Airbnb income in Porto Cesareo across different performance tiers:
- Best-in-class properties (Top 10%) achieve $2,901+ monthly, often utilizing dynamic pricing and superior guest experiences.
- Strong performing properties (Top 25%) earn $1,796 or more, indicating effective management and desirable locations/amenities.
- Typical properties (Median) generate around $986 per month, representing the average market performance.
- Entry-level properties (Bottom 25%) see earnings around $466, often with potential for optimization.
Average Monthly Airbnb Earnings Trend in Porto Cesareo
Porto Cesareo Airbnb Occupancy Rate Trends (2026)
Maximize your bookings by understanding the Porto Cesareo STR occupancy trends. Seasonal demand shifts significantly influence how often properties are booked. Typically, Augustsees the highest demand (peak season occupancy), while February experiences the lowest (low season). Effective strategies, like adjusting minimum stays or offering promotions, can boost occupancy during slower periods. Here's how different property tiers perform in Porto Cesareo:
- Best-in-class properties (Top 10%) achieve 63%+ occupancy, indicating high desirability and potentially optimized availability.
- Strong performing properties (Top 25%) maintain 44% or higher occupancy, suggesting good market fit and guest satisfaction.
- Typical properties (Median) have an occupancy rate around 25%.
- Entry-level properties (Bottom 25%) average 10% occupancy, potentially facing higher vacancy.
Average Monthly Occupancy Rate Trend in Porto Cesareo
Average Daily Rate (ADR) Airbnb Trends in Porto Cesareo (2026)
Effective short term rental pricing strategy in Porto Cesareo involves understanding monthly ADR fluctuations. The Average Daily Rate (ADR) for Airbnb in Porto Cesareo typically peaks in August and dips lowest during November. Leveraging Airbnb dynamic pricing tools or strategies based on this seasonality can significantly boost revenue. Here's a look at the typical nightly rates achieved:
- Best-in-class properties (Top 10%) command rates of $250+ per night, often due to premium features or locations.
- Strong performing properties (Top 25%) achieve nightly rates of $175 or more.
- Typical properties (Median) charge around $121 per night.
- Entry-level properties (Bottom 25%) earn around $89 per night.
Average Daily Rate (ADR) Trend by Month in Porto Cesareo
Get Live Porto Cesareo Market Intelligence 👇

Explore Real-time Analytics
Airbnb Seasonality Analysis & Trends in Porto Cesareo (2026)
Peak Season (August, July, June)
- Revenue averages $2,672 per month
- Occupancy rates average 47.2%
- Daily rates average $181
Shoulder Season
- Revenue averages $1,133 per month
- Occupancy maintains around 26.2%
- Daily rates hold near $155
Low Season (January, February, December)
- Revenue drops to average $663 per month
- Occupancy decreases to average 18.8%
- Daily rates adjust to average $152
Seasonality Insights for Porto Cesareo
- The Airbnb seasonality in Porto Cesareo shows highly seasonal trends requiring careful strategy. While the sections above show seasonal averages, it's also insightful to look at the extremes:
- During the high season, the absolute peak month showcases Porto Cesareo's highest earning potential, with monthly revenues capable of climbing to $3,416, occupancy reaching a high of 54.6%, and ADRs peaking at $199.
- Conversely, the slowest single month of the year, typically falling within the low season, marks the market's lowest point. In this month, revenue might dip to $590, occupancy could drop to 16.9%, and ADRs may adjust down to $135.
- Understanding both the seasonal averages and these monthly peaks and troughs in revenue, occupancy, and ADR is crucial for maximizing your Airbnb profit potential in Porto Cesareo.
Seasonal Strategies for Maximizing Profit
- Peak Season: Maximize revenue through premium pricing and potentially longer minimum stays. Ensure high availability.
- Low Season: Offer competitive pricing, special promotions (e.g., extended stay discounts), and flexible cancellation policies. Target off-season travelers like remote workers or budget-conscious guests.
- Shoulder Seasons: Implement dynamic pricing that balances peak and low rates. Target weekend travelers or specific events. Offer slightly more flexible terms than peak season.
- Regularly analyze your own performance against these Porto Cesareo seasonality benchmarks and adjust your pricing and availability strategy accordingly.
Best Areas for Airbnb Investment in Porto Cesareo (2026)
Exploring the top neighborhoods for short-term rentals in Porto Cesareo? This section highlights key areas, outlining why they are attractive for hosts and guests, along with notable local attractions. Consider these locations based on your target guest profile and investment strategy.
| Neighborhood / Area | Why Host Here? (Target Guests & Appeal) | Key Attractions & Landmarks |
|---|---|---|
| Porto Cesareo Beach | Stunning beach area known for its crystal clear waters and beautiful sandy shores. Ideal for families and beachgoers, making it a prime rental location during the summer months. | Porto Cesareo Beach, Isola dei Conigli, La Spiaggia di Punta Prosciutto, Lido Tabù, Torre di St. Thomas |
| Centro Storico | The historical center of Porto Cesareo, rich in culture and charming streets. Visitors love the authentic Italian experience, local restaurants, and proximity to the beach. | Piazza Nazario Sauro, Chiesa di Porto Cesareo, Local seafood restaurants, Shopping at local boutiques, Cultural events and festivals |
| Isola dei Conigli | Famous for its natural reserve and beautiful beach, this area attracts eco-tourists and those seeking a tranquil retreat. Perfect for nature lovers and water sports. | Isola dei Conigli Beach, Snorkeling and diving opportunities, Nature walks, Wildlife viewing, Lesser known beaches nearby |
| Excursion to Torre Lapillo | A popular spot for tourists seeking beautiful beaches and water sports. Close enough to Porto Cesareo while offering plenty of amenities and restaurants. | Torre Lapillo Beach, Lido Cherillo, Water sports rentals, Restaurants with local cuisine, Shallow waters ideal for kids |
| Local Seafood Markets | Known for its fresh seafood, this area attracts food enthusiasts who indulge in local culinary experiences. It's a prime cultural spot for food-themed Airbnb stays. | Local seafood market, Cooking classes, Fish restaurants, Boat tours for fishing, Food festivals |
| Salina dei Monaci | An area known for its natural beauty and bird watching, especially during migration seasons. Great for eco-tourism and unique Airbnb offerings. | Bird watching, Nature trails, Beach access, Photography spots, Secluded beaches |
| Porto Cesareo Marina | This marina attracts boat owners and visitors interested in maritime activities. It’s a great area for those looking to enjoy sailing and water adventures. | Boat rentals, Fishing tours, Waterfront dining, Marina activities, Scenic views of the coast |
| Nightlife District | Known for its vibrant nightlife, this area draws young tourists and locals looking for entertainment, bars, and late-night dining experiences. | Bars and clubs, Live music venues, Night markets, Outdoor summer events, Beach parties |
Understanding Airbnb License Requirements & STR Laws in Porto Cesareo (2026)
Yes, Porto Cesareo, Apulia, Italy enforces high STR regulations. Obtaining a license and ensuring compliance is almost certainly required according to current 2026 STR laws. Always verify the latest short term rental regulations and Airbnb license requirements directly with local government authorities for Porto Cesareo to ensure full compliance before hosting.
(Source: AirROI data, 2026, based on 85% licensed listings)
Top Performing Airbnb Properties in Porto Cesareo (2026)
Benchmark your potential! Explore examples of top-performing Airbnb properties in Porto Cesareobased on Trailing Twelve Month (TTM) revenue. Analyze their characteristics, revenue, occupancy rate, and ADR to understand what drives success in this market.
Villa Nausicaa - Private Pool By Cala Salento
Entire Place • 6 bedrooms
Villa Relax - Beach at 500m By Cala Salento
Entire Place • 5 bedrooms
"SUITE VISTA MARE" by Flow Boutique Apartments
Entire Place • 4 bedrooms
Villa Kenja • Pool • Garden • Near the sea
Entire Place • 4 bedrooms

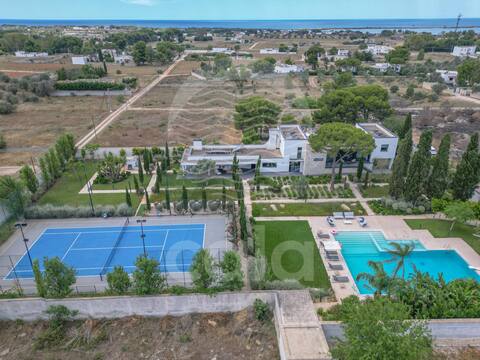
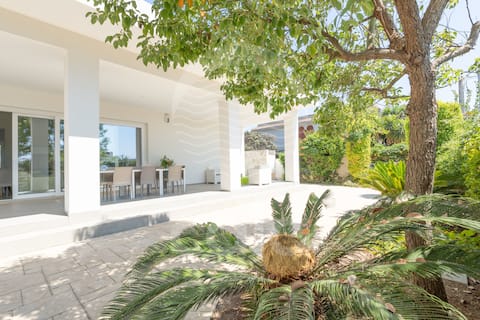
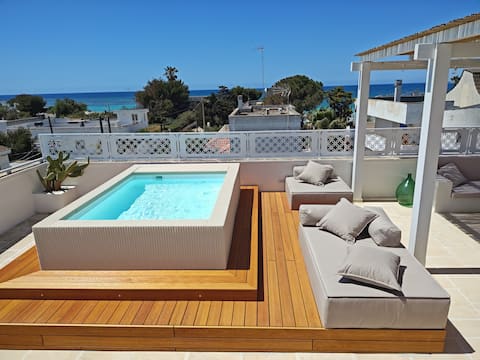
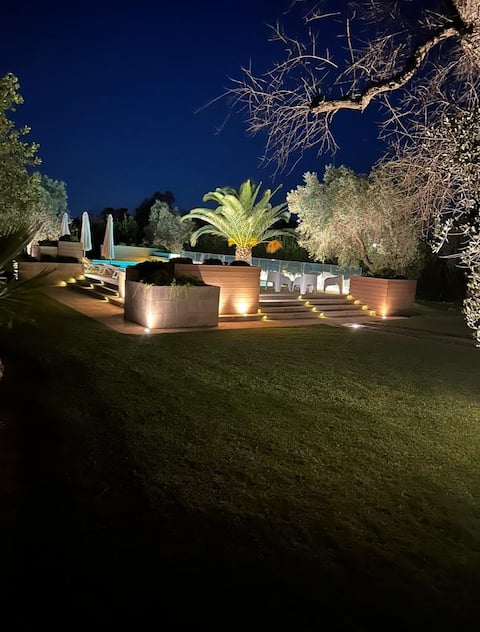
Contemporary Beach Villa with Pool and Gardens
Entire Place • 2 bedrooms

Villa Bali - private pool By Cala Salento
Entire Place • 3 bedrooms
Note: Performance varies based on location, size, amenities, seasonality, and management quality. Data reflects the past 12 months.
Top Performing Airbnb Hosts in Porto Cesareo (2026)
Learn from the best! This table showcases top-performing Airbnb hosts in Porto Cesareo based on the number of properties managed and estimated total revenue over the past year. Analyze their scale and performance metrics.
| Host Name | Properties | Grossing Revenue | Stay Reviews | Avg Rating |
|---|---|---|---|---|
| Barbarhouse SRL | 164 | $1,131,025 | 617 | 4.33/5.0 |
| Cala Salento | 95 | $1,018,533 | 314 | 4.60/5.0 |
| Sottocosta | 83 | $553,675 | 275 | 3.99/5.0 |
| Fabio | 39 | $303,121 | 143 | 4.32/5.0 |
| Fedele | 4 | $105,180 | 109 | 4.84/5.0 |
| Chiara | 3 | $98,583 | 105 | 4.93/5.0 |
| Manuel | 5 | $76,197 | 14 | 4.90/5.0 |
| Umberto Livraghi | 6 | $65,026 | 577 | 4.82/5.0 |
| Massimo | 11 | $64,845 | 39 | 4.45/5.0 |
| Alessandro | 2 | $62,673 | 80 | 4.79/5.0 |
Analyzing the strategies of top hosts, such as their property selection, pricing, and guest communication, can offer valuable lessons for optimizing your own Airbnb operations in Porto Cesareo.
Dive Deeper: Advanced Porto Cesareo STR Market Data (2026)
Ready to unlock more insights? AirROI provides access to advanced metrics and comprehensive Airbnb data for Porto Cesareo. Explore detailed analytics beyond this report to refine your investment strategy, optimize pricing, and maximize your vacation rental profits.
Explore Advanced MetricsPorto Cesareo Short-Term Rental Market Composition (2026): Property & Room Types
Room Type Distribution
Property Type Distribution
Market Composition Insights for Porto Cesareo
- The Porto Cesareo Airbnb market composition is heavily skewed towards Entire Home/Apt listings, which make up 93.1% of the 921 active rentals. This indicates strong guest preference for privacy and space.
- Looking at the property type distribution in Porto Cesareo, House properties are the most common (55.4%), reflecting the local real estate landscape.
- Houses represent a significant 55.4% portion, catering likely to families or larger groups.
- Smaller segments like hotel/boutique, others, outdoor/unique (combined 5.5%) offer potential for unique stay experiences.
Porto Cesareo Airbnb Room Capacity Analysis (2026): Bedroom Distribution
Distribution of Listings by Number of Bedrooms
Room Capacity Insights for Porto Cesareo
- The dominant room capacity in Porto Cesareo is 2 bedrooms listings, making up 39% of the market. This suggests a strong demand for properties suitable for couples or solo travelers.
- Together, 2 bedrooms and 1 bedroom properties represent 70.3% of the active Airbnb listings in Porto Cesareo, indicating a high concentration in these sizes.
- A significant 22.9% of listings offer 3+ bedrooms, catering to larger groups and families seeking more space in Porto Cesareo.
Porto Cesareo Vacation Rental Guest Capacity Trends (2026)
Distribution of Listings by Guest Capacity
Guest Capacity Insights for Porto Cesareo
- The most common guest capacity trend in Porto Cesareo vacation rentals is listings accommodating 4 guests (28.4%). This suggests the primary traveler segment is likely small families or groups.
- Properties designed for 4 guests and 6 guests dominate the Porto Cesareo STR market, accounting for 46.0% of listings.
- 40.6% of properties accommodate 6+ guests, serving the market segment for larger families or group travel in Porto Cesareo.
- On average, properties in Porto Cesareo are equipped to host 4.9 guests.
Porto Cesareo Airbnb Booking Patterns (2026): Available vs. Booked Days
Available Days Distribution
Booked Days Distribution
Booking Pattern Insights for Porto Cesareo
- The most common availability pattern in Porto Cesareo falls within the 271-366 days range, representing 84% of listings. This suggests many properties have significant open periods on their calendars.
- Approximately 99.5% of listings show high availability (181+ days open annually), indicating potential for increased bookings or specific owner usage patterns.
- For booked days, the 1-30 days range is most frequent in Porto Cesareo (43.8%), reflecting common guest stay durations or potential owner blocking patterns.
- A notable 0.4% of properties secure long booking periods (181+ days booked per year), highlighting successful long-term rental strategies or significant owner usage.
Porto Cesareo Airbnb Minimum Stay Requirements Analysis
Distribution of Listings by Minimum Night Requirement
1 Night
27 listings
2.9% of total
2 Nights
40 listings
4.3% of total
3 Nights
50 listings
5.4% of total
4-6 Nights
164 listings
17.8% of total
7-29 Nights
102 listings
11.1% of total
30+ Nights
538 listings
58.4% of total
Key Insights
- The most prevalent minimum stay requirement in Porto Cesareo is 30+ Nights, adopted by 58.4% of listings. This highlights the market's preference for longer commitments.
- Very short stays (1-2 nights) are less common (7.2%), suggesting hosts prefer slightly longer bookings to optimize turnover.
- A significant segment (58.4%) caters to monthly stays (30+ nights) in Porto Cesareo, pointing to opportunities in the extended-stay market.
Recommendations
- Align with the market by considering a 30+ Nights minimum stay, as 58.4% of Porto Cesareo hosts use this setting.
- If feasible, allowing 1-night stays, especially midweek or during low season, could capture last-minute bookings, as only 2.9% currently do.
- Explore offering discounts for stays of 30+ nights to attract the 58.4% of the market seeking extended stays.
- Adjust minimum nights based on seasonality – potentially shorter during low season and longer during peak demand periods in Porto Cesareo.
Porto Cesareo Airbnb Cancellation Policy Trends Analysis (2026)
Super Strict 60 Days
108 listings
11.7% of total
Super Strict 30 Days
26 listings
2.8% of total
Flexible
77 listings
8.4% of total
Moderate
162 listings
17.6% of total
Firm
363 listings
39.4% of total
Strict
185 listings
20.1% of total
Cancellation Policy Insights for Porto Cesareo
- The prevailing Airbnb cancellation policy trend in Porto Cesareo is Firm, used by 39.4% of listings.
- A majority (59.5%) of hosts in Porto Cesareo utilize Firm or Strict policies, indicating a market where hosts prioritize booking security.
Recommendations for Hosts
- Consider adopting a Firm policy to align with the 39.4% market standard in Porto Cesareo.
- Regularly review your cancellation policy against competitors and market demand shifts in Porto Cesareo.
Porto Cesareo STR Booking Lead Time Analysis (2026)
Average Booking Lead Time by Month
Booking Lead Time Insights for Porto Cesareo
- The overall average booking lead time for vacation rentals in Porto Cesareo is 65 days.
- Guests book furthest in advance for stays during August (average 91 days), likely coinciding with peak travel demand or local events.
- The shortest booking windows occur for stays in February (average 24 days), indicating more last-minute travel plans during this time.
- Seasonally, Summer (74 days avg.) sees the longest lead times, while Winter (27 days avg.) has the shortest, reflecting typical travel planning cycles.
Recommendations for Hosts
- Use the overall average lead time (65 days) as a baseline for your pricing and availability strategy in Porto Cesareo.
- For August stays, consider implementing length-of-stay discounts or slightly higher rates for bookings made less than 91 days out to capitalize on advance planning.
- Target marketing efforts for the Summer season well in advance (at least 74 days) to capture early planners.
- Monitor your own booking lead times against these Porto Cesareo averages to identify opportunities for dynamic pricing adjustments.
Popular & Essential Airbnb Amenities in Porto Cesareo (2026)
Amenity Prevalence
Amenity Insights for Porto Cesareo
- Essential amenities in Porto Cesareo that guests expect include: Air conditioning, TV. Lacking these (any) could significantly impact bookings.
- Popular amenities like Kitchen, Refrigerator, Hair dryer are common but not universal. Offering these can provide a competitive edge.
Recommendations for Hosts
- Ensure your listing includes all essential amenities for Porto Cesareo: Air conditioning, TV.
- Prioritize adding missing essentials: Air conditioning, TV.
- Consider adding popular differentiators like Kitchen or Refrigerator to increase appeal.
- Highlight unique or less common amenities you offer (e.g., hot tub, dedicated workspace, EV charger) in your listing description and photos.
- Regularly check competitor amenities in Porto Cesareo to stay competitive.
Porto Cesareo Airbnb Guest Demographics & Profile Analysis (2026)
Guest Profile Summary for Porto Cesareo
- The typical guest profile for Airbnb in Porto Cesareo consists of a mix of domestic (44%) and international guests, with top international origins including Germany, typically belonging to the Post-2000s (Gen Z/Alpha) group (50%), primarily speaking English or Italian.
- Domestic travelers account for 43.6% of guests.
- Key international markets include Italy (43.6%) and Germany (10.9%).
- Top languages spoken are English (36.4%) followed by Italian (21.7%).
- A significant demographic segment is the Post-2000s (Gen Z/Alpha) group, representing 50% of guests.
Recommendations for Hosts
- Balance marketing efforts between domestic and international channels based on the guest mix.
- Tailor amenities and listing descriptions to appeal to the dominant Post-2000s (Gen Z/Alpha) demographic (e.g., highlight fast WiFi, smart home features, local guides).
- Highlight unique local experiences or amenities relevant to the primary guest profile.
- Consider seasonal promotions aligned with peak travel times for key origin markets.
Nearby Short-Term Rental Market Comparison
How does the Porto Cesareo Airbnb market stack up against its neighbors? Compare key performance metrics like average monthly revenue, ADR, and occupancy rates in surrounding areas to understand the broader regional STR landscape.
| Market | Active Properties | Monthly Revenue | Daily Rate | Avg. Occupancy |
|---|---|---|---|---|
| San Michele Salentino | 76 | $2,635 | $296.04 | 46% |
| Sanarica | 14 | $2,311 | $227.51 | 35% |
| Castellana Grotte | 194 | $2,129 | $242.07 | 42% |
| Carovigno | 442 | $2,005 | $283.77 | 41% |
| Polignano a Mare | 718 | $1,915 | $201.20 | 43% |
| San Vito dei Normanni | 168 | $1,885 | $272.31 | 42% |
| Muro Leccese | 29 | $1,863 | $336.37 | 35% |
| Ostuni | 1,596 | $1,855 | $262.11 | 37% |
| Lequile | 22 | $1,790 | $177.86 | 45% |
| Monopoli | 1,240 | $1,734 | $200.27 | 42% |