Monopoli Airbnb Market Analysis 2026: Short Term Rental Data & Vacation Rental Statistics in Apulia, Italy
Is Airbnb profitable in Monopoli in 2026? Explore comprehensive Airbnb analytics for Monopoli, Apulia, Italy to uncover income potential. This 2026 STR market report for Monopoli, based on AirROI data from February 2025 to January 2026, reveals key trends in the bustling market of 1,240 active listings.
Whether you're considering an Airbnb investment in Monopoli, optimizing your existing vacation rental, or exploring rental arbitrage opportunities, understanding the Monopoli Airbnb data is crucial. Navigating the high regulation landscape is key to maximizing your short term rental income potential. Let's dive into the specifics.
Key Monopoli Airbnb Performance Metrics Overview
Monthly Airbnb Revenue Variations & Income Potential in Monopoli (2026)
Understanding the monthly revenue variations for Airbnb listings in Monopoli is key to maximizing your short term rental income potential. Seasonality significantly impacts earnings. Our analysis, based on data from the past 12 months, shows that the peak revenue month for STRs in Monopoli is typically August, while January often presents the lowest earnings, highlighting opportunities for strategic pricing adjustments during shoulder and low seasons. Explore the typical Airbnb income in Monopoli across different performance tiers:
- Best-in-class properties (Top 10%) achieve $4,871+ monthly, often utilizing dynamic pricing and superior guest experiences.
- Strong performing properties (Top 25%) earn $3,049 or more, indicating effective management and desirable locations/amenities.
- Typical properties (Median) generate around $1,856 per month, representing the average market performance.
- Entry-level properties (Bottom 25%) see earnings around $995, often with potential for optimization.
Average Monthly Airbnb Earnings Trend in Monopoli
Monopoli Airbnb Occupancy Rate Trends (2026)
Maximize your bookings by understanding the Monopoli STR occupancy trends. Seasonal demand shifts significantly influence how often properties are booked. Typically, Augustsees the highest demand (peak season occupancy), while January experiences the lowest (low season). Effective strategies, like adjusting minimum stays or offering promotions, can boost occupancy during slower periods. Here's how different property tiers perform in Monopoli:
- Best-in-class properties (Top 10%) achieve 74%+ occupancy, indicating high desirability and potentially optimized availability.
- Strong performing properties (Top 25%) maintain 58% or higher occupancy, suggesting good market fit and guest satisfaction.
- Typical properties (Median) have an occupancy rate around 38%.
- Entry-level properties (Bottom 25%) average 20% occupancy, potentially facing higher vacancy.
Average Monthly Occupancy Rate Trend in Monopoli
Average Daily Rate (ADR) Airbnb Trends in Monopoli (2026)
Effective short term rental pricing strategy in Monopoli involves understanding monthly ADR fluctuations. The Average Daily Rate (ADR) for Airbnb in Monopoli typically peaks in August and dips lowest during November. Leveraging Airbnb dynamic pricing tools or strategies based on this seasonality can significantly boost revenue. Here's a look at the typical nightly rates achieved:
- Best-in-class properties (Top 10%) command rates of $330+ per night, often due to premium features or locations.
- Strong performing properties (Top 25%) achieve nightly rates of $216 or more.
- Typical properties (Median) charge around $150 per night.
- Entry-level properties (Bottom 25%) earn around $114 per night.
Average Daily Rate (ADR) Trend by Month in Monopoli
Get Live Monopoli Market Intelligence 👇

Explore Real-time Analytics
Airbnb Seasonality Analysis & Trends in Monopoli (2026)
Peak Season (August, July, September)
- Revenue averages $4,560 per month
- Occupancy rates average 61.9%
- Daily rates average $231
Shoulder Season
- Revenue averages $2,204 per month
- Occupancy maintains around 39.2%
- Daily rates hold near $190
Low Season (January, February, December)
- Revenue drops to average $984 per month
- Occupancy decreases to average 20.6%
- Daily rates adjust to average $185
Seasonality Insights for Monopoli
- The Airbnb seasonality in Monopoli shows highly seasonal trends requiring careful strategy. While the sections above show seasonal averages, it's also insightful to look at the extremes:
- During the high season, the absolute peak month showcases Monopoli's highest earning potential, with monthly revenues capable of climbing to $5,284, occupancy reaching a high of 66.8%, and ADRs peaking at $246.
- Conversely, the slowest single month of the year, typically falling within the low season, marks the market's lowest point. In this month, revenue might dip to $786, occupancy could drop to 16.1%, and ADRs may adjust down to $180.
- Understanding both the seasonal averages and these monthly peaks and troughs in revenue, occupancy, and ADR is crucial for maximizing your Airbnb profit potential in Monopoli.
Seasonal Strategies for Maximizing Profit
- Peak Season: Maximize revenue through premium pricing and potentially longer minimum stays. Ensure high availability.
- Low Season: Offer competitive pricing, special promotions (e.g., extended stay discounts), and flexible cancellation policies. Target off-season travelers like remote workers or budget-conscious guests.
- Shoulder Seasons: Implement dynamic pricing that balances peak and low rates. Target weekend travelers or specific events. Offer slightly more flexible terms than peak season.
- Regularly analyze your own performance against these Monopoli seasonality benchmarks and adjust your pricing and availability strategy accordingly.
Best Areas for Airbnb Investment in Monopoli (2026)
Exploring the top neighborhoods for short-term rentals in Monopoli? This section highlights key areas, outlining why they are attractive for hosts and guests, along with notable local attractions. Consider these locations based on your target guest profile and investment strategy.
| Neighborhood / Area | Why Host Here? (Target Guests & Appeal) | Key Attractions & Landmarks |
|---|---|---|
| Old Town | Charming historic center with narrow streets, traditional architecture, and a vibrant atmosphere. Popular with tourists looking to explore history and local culture. | Castello di Carlo V, Basilica Cattedrale Maria Santissima della Madia, Piazza Vittorio Emanuele II, Museo della Cattedrale, Scalinata della Madonna della Madia |
| Lido Santo Stefano | Beautiful beach area known for its sandy shores and crystal clear waters. Attracts families and beachgoers looking for relaxation and sun. | Lido Santo Stefano Beach, Lido di Monopoli, Beaches of Capitolo, Bays of Monopoli, Beach clubs and restaurants |
| Capitolo | Popular coastal area with lively beach clubs and excellent seafood restaurants. Ideal for those looking to enjoy the sun and sea during the summer months. | Capitolo Beach, Lido Palm Beach, Cala Porta Vecchia, Parco Belvedere, Amusement parks |
| Lamodicea | A quieter, scenic location known for its beautiful cliffs and natural landscapes. Great for visitors seeking tranquility and nature. | Cala Susca, Cala di Monopoli, Scenic coastal walks, Natural parks nearby |
| Corso Roma | The main shopping artery of Monopoli featuring shops, cafes, and restaurants. Perfect for travelers looking to experience local life and enjoy urban amenities. | Local boutiques, Restaurants and ice cream shops, Cafes and bars, Events and fairs |
| Porto di Monopoli | The picturesque harbor area with seafood restaurants and local market. Attracts visitors wanting to experience the maritime culture. | Fishing port, Fresh seafood markets, Marina dei Sospiri, Seaside promenade |
| Nearby Alberobello | Famed for its unique trulli houses, attracting tourists eager to explore this UNESCO World Heritage site. Ideal for day excursions. | Trulli of Alberobello, Trullo Sovrano, Museo del Territorio, Local craft shops, Traditional restaurants |
| Grotte di Castellana | Famous cave system located nearby, drawing visitors interested in nature and guided tours. Perfect for adventure seekers and families. | Grotte di Castellana, Cave tours, Nature walks, Surrounding landscapes |
Understanding Airbnb License Requirements & STR Laws in Monopoli (2026)
Yes, Monopoli, Apulia, Italy enforces high STR regulations. Obtaining a license and ensuring compliance is almost certainly required according to current 2026 STR laws. Always verify the latest short term rental regulations and Airbnb license requirements directly with local government authorities for Monopoli to ensure full compliance before hosting.
(Source: AirROI data, 2026, based on 92% licensed listings)
Top Performing Airbnb Properties in Monopoli (2026)
Benchmark your potential! Explore examples of top-performing Airbnb properties in Monopolibased on Trailing Twelve Month (TTM) revenue. Analyze their characteristics, revenue, occupancy rate, and ADR to understand what drives success in this market.
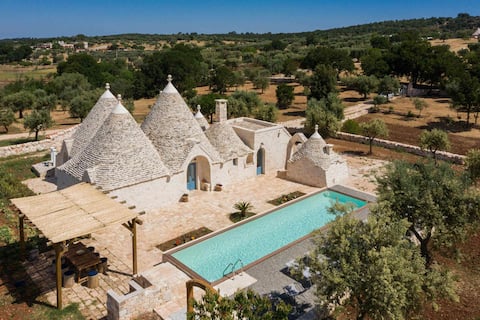
Trullo Pia
Entire Place • 3 bedrooms
TD Tenuta Donna Madia Sea View Pool Over Vineyard
Entire Place • 7 bedrooms

Rosalinda Luxury Trulli - Monopoli
Entire Place • 5 bedrooms

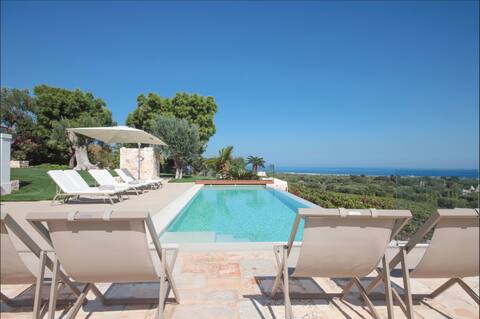
Villa Therasia - Private escape
Entire Place • 6 bedrooms

Trullo Due Ulivi
Entire Place • 2 bedrooms

Villa Favorita Luxury Monopoli Trullo
Entire Place • 4 bedrooms
Note: Performance varies based on location, size, amenities, seasonality, and management quality. Data reflects the past 12 months.
Top Performing Airbnb Hosts in Monopoli (2026)
Learn from the best! This table showcases top-performing Airbnb hosts in Monopoli based on the number of properties managed and estimated total revenue over the past year. Analyze their scale and performance metrics.
| Host Name | Properties | Grossing Revenue | Stay Reviews | Avg Rating |
|---|---|---|---|---|
| Trulli & Dimore | 25 | $1,492,079 | 409 | 4.81/5.0 |
| HelloApulia | 26 | $1,000,965 | 475 | 4.83/5.0 |
| Cosimo | 69 | $869,455 | 818 | 4.53/5.0 |
| Francesco | 46 | $736,014 | 512 | 4.85/5.0 |
| GuestHost - Welcome To Our Hom | 20 | $456,140 | 669 | 4.69/5.0 |
| Dimore Favorita | 2 | $353,958 | 42 | 4.96/5.0 |
| Cosimo | 24 | $320,950 | 226 | 4.68/5.0 |
| Massimo | 2 | $307,161 | 46 | 4.95/5.0 |
| Francesco | 9 | $295,987 | 285 | 4.88/5.0 |
| WePuglia Srl | 13 | $274,138 | 231 | 4.78/5.0 |
Analyzing the strategies of top hosts, such as their property selection, pricing, and guest communication, can offer valuable lessons for optimizing your own Airbnb operations in Monopoli.
Dive Deeper: Advanced Monopoli STR Market Data (2026)
Ready to unlock more insights? AirROI provides access to advanced metrics and comprehensive Airbnb data for Monopoli. Explore detailed analytics beyond this report to refine your investment strategy, optimize pricing, and maximize your vacation rental profits.
Explore Advanced MetricsMonopoli Short-Term Rental Market Composition (2026): Property & Room Types
Room Type Distribution
Property Type Distribution
Market Composition Insights for Monopoli
- The Monopoli Airbnb market composition is heavily skewed towards Entire Home/Apt listings, which make up 90.3% of the 1,240 active rentals. This indicates strong guest preference for privacy and space.
- Looking at the property type distribution in Monopoli, Apartment/Condo properties are the most common (49%), reflecting the local real estate landscape.
- Houses represent a significant 36.9% portion, catering likely to families or larger groups.
- The presence of 5.6% Hotel/Boutique listings indicates integration with traditional hospitality.
- Smaller segments like outdoor/unique, others (combined 1.7%) offer potential for unique stay experiences.
Monopoli Airbnb Room Capacity Analysis (2026): Bedroom Distribution
Distribution of Listings by Number of Bedrooms
Room Capacity Insights for Monopoli
- The dominant room capacity in Monopoli is 1 bedroom listings, making up 49% of the market. This suggests a strong demand for properties suitable for couples or solo travelers.
- Together, 1 bedroom and 2 bedrooms properties represent 78.6% of the active Airbnb listings in Monopoli, indicating a high concentration in these sizes.
Monopoli Vacation Rental Guest Capacity Trends (2026)
Distribution of Listings by Guest Capacity
Guest Capacity Insights for Monopoli
- The most common guest capacity trend in Monopoli vacation rentals is listings accommodating 4 guests (38%). This suggests the primary traveler segment is likely small families or groups.
- Properties designed for 4 guests and 2 guests dominate the Monopoli STR market, accounting for 58.2% of listings.
- 19.6% of properties accommodate 6+ guests, serving the market segment for larger families or group travel in Monopoli.
- On average, properties in Monopoli are equipped to host 3.9 guests.
Monopoli Airbnb Booking Patterns (2026): Available vs. Booked Days
Available Days Distribution
Booked Days Distribution
Booking Pattern Insights for Monopoli
- The most common availability pattern in Monopoli falls within the 271-366 days range, representing 50.4% of listings. This suggests many properties have significant open periods on their calendars.
- Approximately 86.4% of listings show high availability (181+ days open annually), indicating potential for increased bookings or specific owner usage patterns.
- For booked days, the 91-180 days range is most frequent in Monopoli (36.6%), reflecting common guest stay durations or potential owner blocking patterns.
- A notable 14.8% of properties secure long booking periods (181+ days booked per year), highlighting successful long-term rental strategies or significant owner usage.
Monopoli Airbnb Minimum Stay Requirements Analysis
Distribution of Listings by Minimum Night Requirement
1 Night
96 listings
7.7% of total
2 Nights
138 listings
11.1% of total
3 Nights
114 listings
9.2% of total
4-6 Nights
158 listings
12.7% of total
7-29 Nights
32 listings
2.6% of total
30+ Nights
702 listings
56.6% of total
Key Insights
- The most prevalent minimum stay requirement in Monopoli is 30+ Nights, adopted by 56.6% of listings. This highlights the market's preference for longer commitments.
- Very short stays (1-2 nights) are less common (18.8%), suggesting hosts prefer slightly longer bookings to optimize turnover.
- A significant segment (56.6%) caters to monthly stays (30+ nights) in Monopoli, pointing to opportunities in the extended-stay market.
Recommendations
- Align with the market by considering a 30+ Nights minimum stay, as 56.6% of Monopoli hosts use this setting.
- If feasible, allowing 1-night stays, especially midweek or during low season, could capture last-minute bookings, as only 7.7% currently do.
- Explore offering discounts for stays of 30+ nights to attract the 56.6% of the market seeking extended stays.
- Adjust minimum nights based on seasonality – potentially shorter during low season and longer during peak demand periods in Monopoli.
Monopoli Airbnb Cancellation Policy Trends Analysis (2026)
Limited
28 listings
2.3% of total
Super Strict 30 Days
70 listings
5.6% of total
Super Strict 60 Days
7 listings
0.6% of total
Flexible
239 listings
19.3% of total
Moderate
436 listings
35.2% of total
Firm
384 listings
31% of total
Strict
75 listings
6.1% of total
Cancellation Policy Insights for Monopoli
- The prevailing Airbnb cancellation policy trend in Monopoli is Moderate, used by 35.2% of listings.
- There's a relatively balanced mix between guest-friendly (54.5%) and stricter (37.1%) policies, offering choices for different guest needs.
- Strict cancellation policies are quite rare (6.1%), potentially making listings with this policy less competitive unless justified by high demand or property type.
Recommendations for Hosts
- Consider adopting a Moderate policy to align with the 35.2% market standard in Monopoli.
- Using a Strict policy might deter some guests, as only 6.1% of listings use it. Evaluate if potential revenue protection outweighs possible lower booking rates.
- Regularly review your cancellation policy against competitors and market demand shifts in Monopoli.
Monopoli STR Booking Lead Time Analysis (2026)
Average Booking Lead Time by Month
Booking Lead Time Insights for Monopoli
- The overall average booking lead time for vacation rentals in Monopoli is 60 days.
- Guests book furthest in advance for stays during August (average 79 days), likely coinciding with peak travel demand or local events.
- The shortest booking windows occur for stays in January (average 23 days), indicating more last-minute travel plans during this time.
- Seasonally, Summer (69 days avg.) sees the longest lead times, while Winter (31 days avg.) has the shortest, reflecting typical travel planning cycles.
Recommendations for Hosts
- Use the overall average lead time (60 days) as a baseline for your pricing and availability strategy in Monopoli.
- For August stays, consider implementing length-of-stay discounts or slightly higher rates for bookings made less than 79 days out to capitalize on advance planning.
- Target marketing efforts for the Summer season well in advance (at least 69 days) to capture early planners.
- Monitor your own booking lead times against these Monopoli averages to identify opportunities for dynamic pricing adjustments.
Popular & Essential Airbnb Amenities in Monopoli (2026)
Amenity Prevalence
Amenity Insights for Monopoli
- Essential amenities in Monopoli that guests expect include: Wifi, Air conditioning. Lacking these (any) could significantly impact bookings.
- Popular amenities like Hair dryer, Kitchen, TV are common but not universal. Offering these can provide a competitive edge.
Recommendations for Hosts
- Ensure your listing includes all essential amenities for Monopoli: Wifi, Air conditioning.
- Prioritize adding missing essentials: Wifi, Air conditioning.
- Consider adding popular differentiators like Hair dryer or Kitchen to increase appeal.
- Highlight unique or less common amenities you offer (e.g., hot tub, dedicated workspace, EV charger) in your listing description and photos.
- Regularly check competitor amenities in Monopoli to stay competitive.
Monopoli Airbnb Guest Demographics & Profile Analysis (2026)
Guest Profile Summary for Monopoli
- The typical guest profile for Airbnb in Monopoli consists of predominantly international visitors (95%), with top international origins including United States, typically belonging to the Post-2000s (Gen Z/Alpha) group (50%), primarily speaking English or French.
- Domestic travelers account for 5.1% of guests.
- Key international markets include France (16.1%) and United States (15%).
- Top languages spoken are English (43.4%) followed by French (14.3%).
- A significant demographic segment is the Post-2000s (Gen Z/Alpha) group, representing 50% of guests.
Recommendations for Hosts
- Focus marketing internationally, particularly towards travelers from United States.
- Tailor amenities and listing descriptions to appeal to the dominant Post-2000s (Gen Z/Alpha) demographic (e.g., highlight fast WiFi, smart home features, local guides).
- Highlight unique local experiences or amenities relevant to the primary guest profile.
- Consider seasonal promotions aligned with peak travel times for key origin markets.
Nearby Short-Term Rental Market Comparison
How does the Monopoli Airbnb market stack up against its neighbors? Compare key performance metrics like average monthly revenue, ADR, and occupancy rates in surrounding areas to understand the broader regional STR landscape.
| Market | Active Properties | Monthly Revenue | Daily Rate | Avg. Occupancy |
|---|---|---|---|---|
| San Michele Salentino | 76 | $2,635 | $296.04 | 46% |
| Sanarica | 14 | $2,311 | $227.51 | 35% |
| Castellana Grotte | 194 | $2,129 | $242.07 | 42% |
| Carovigno | 442 | $2,005 | $283.77 | 41% |
| Polignano a Mare | 718 | $1,915 | $201.20 | 43% |
| San Vito dei Normanni | 168 | $1,885 | $272.31 | 42% |
| Muro Leccese | 29 | $1,863 | $336.37 | 35% |
| Ostuni | 1,596 | $1,855 | $262.11 | 37% |
| Lequile | 22 | $1,790 | $177.86 | 45% |
| Martina Franca | 584 | $1,734 | $234.24 | 39% |