La Thuile Airbnb Market Analysis 2026: Short Term Rental Data & Vacation Rental Statistics in Aosta Valley, Italy
Is Airbnb profitable in La Thuile in 2026? Explore comprehensive Airbnb analytics for La Thuile, Aosta Valley, Italy to uncover income potential. This 2026 STR market report for La Thuile, based on AirROI data from February 2025 to January 2026, reveals key trends in the niche market of 104 active listings.
Whether you're considering an Airbnb investment in La Thuile, optimizing your existing vacation rental, or exploring rental arbitrage opportunities, understanding the La Thuile Airbnb data is crucial. Navigating the high regulation landscape is key to maximizing your short term rental income potential. Let's dive into the specifics.
Key La Thuile Airbnb Performance Metrics Overview
Monthly Airbnb Revenue Variations & Income Potential in La Thuile (2026)
Understanding the monthly revenue variations for Airbnb listings in La Thuile is key to maximizing your short term rental income potential. Seasonality significantly impacts earnings. Our analysis, based on data from the past 12 months, shows that the peak revenue month for STRs in La Thuile is typically February, while September often presents the lowest earnings, highlighting opportunities for strategic pricing adjustments during shoulder and low seasons. Explore the typical Airbnb income in La Thuile across different performance tiers:
- Best-in-class properties (Top 10%) achieve $3,805+ monthly, often utilizing dynamic pricing and superior guest experiences.
- Strong performing properties (Top 25%) earn $2,708 or more, indicating effective management and desirable locations/amenities.
- Typical properties (Median) generate around $1,745 per month, representing the average market performance.
- Entry-level properties (Bottom 25%) see earnings around $1,006, often with potential for optimization.
Average Monthly Airbnb Earnings Trend in La Thuile
La Thuile Airbnb Occupancy Rate Trends (2026)
Maximize your bookings by understanding the La Thuile STR occupancy trends. Seasonal demand shifts significantly influence how often properties are booked. Typically, Februarysees the highest demand (peak season occupancy), while September experiences the lowest (low season). Effective strategies, like adjusting minimum stays or offering promotions, can boost occupancy during slower periods. Here's how different property tiers perform in La Thuile:
- Best-in-class properties (Top 10%) achieve 57%+ occupancy, indicating high desirability and potentially optimized availability.
- Strong performing properties (Top 25%) maintain 43% or higher occupancy, suggesting good market fit and guest satisfaction.
- Typical properties (Median) have an occupancy rate around 30%.
- Entry-level properties (Bottom 25%) average 16% occupancy, potentially facing higher vacancy.
Average Monthly Occupancy Rate Trend in La Thuile
Average Daily Rate (ADR) Airbnb Trends in La Thuile (2026)
Effective short term rental pricing strategy in La Thuile involves understanding monthly ADR fluctuations. The Average Daily Rate (ADR) for Airbnb in La Thuile typically peaks in January and dips lowest during May. Leveraging Airbnb dynamic pricing tools or strategies based on this seasonality can significantly boost revenue. Here's a look at the typical nightly rates achieved:
- Best-in-class properties (Top 10%) command rates of $324+ per night, often due to premium features or locations.
- Strong performing properties (Top 25%) achieve nightly rates of $257 or more.
- Typical properties (Median) charge around $199 per night.
- Entry-level properties (Bottom 25%) earn around $149 per night.
Average Daily Rate (ADR) Trend by Month in La Thuile
Get Live La Thuile Market Intelligence 👇

Explore Real-time Analytics
Airbnb Seasonality Analysis & Trends in La Thuile (2026)
Peak Season (February, March, August)
- Revenue averages $3,802 per month
- Occupancy rates average 56.8%
- Daily rates average $211
Shoulder Season
- Revenue averages $1,855 per month
- Occupancy maintains around 28.3%
- Daily rates hold near $211
Low Season (September, October, November)
- Revenue drops to average $756 per month
- Occupancy decreases to average 13.1%
- Daily rates adjust to average $210
Seasonality Insights for La Thuile
- The Airbnb seasonality in La Thuile shows highly seasonal trends requiring careful strategy. While the sections above show seasonal averages, it's also insightful to look at the extremes:
- During the high season, the absolute peak month showcases La Thuile's highest earning potential, with monthly revenues capable of climbing to $4,567, occupancy reaching a high of 68.6%, and ADRs peaking at $241.
- Conversely, the slowest single month of the year, typically falling within the low season, marks the market's lowest point. In this month, revenue might dip to $672, occupancy could drop to 12.2%, and ADRs may adjust down to $194.
- Understanding both the seasonal averages and these monthly peaks and troughs in revenue, occupancy, and ADR is crucial for maximizing your Airbnb profit potential in La Thuile.
Seasonal Strategies for Maximizing Profit
- Peak Season: Maximize revenue through premium pricing and potentially longer minimum stays. Ensure high availability.
- Low Season: Offer competitive pricing, special promotions (e.g., extended stay discounts), and flexible cancellation policies. Target off-season travelers like remote workers or budget-conscious guests.
- Shoulder Seasons: Implement dynamic pricing that balances peak and low rates. Target weekend travelers or specific events. Offer slightly more flexible terms than peak season.
- Regularly analyze your own performance against these La Thuile seasonality benchmarks and adjust your pricing and availability strategy accordingly.
Best Areas for Airbnb Investment in La Thuile (2026)
Exploring the top neighborhoods for short-term rentals in La Thuile? This section highlights key areas, outlining why they are attractive for hosts and guests, along with notable local attractions. Consider these locations based on your target guest profile and investment strategy.
| Neighborhood / Area | Why Host Here? (Target Guests & Appeal) | Key Attractions & Landmarks |
|---|---|---|
| Les Suches | Located near the ski lifts and offering access to the vast ski area of La Thuile. This neighborhood is perfect for winter sports lovers and attracts ski enthusiasts year-round. | Les Suches Ski Lift, La Thuile Ski Area, Mont Blanc views |
| Centre of La Thuile | The heart of the village, bustling with shops, restaurants, and local culture. Ideal for those looking to experience the charm of La Thuile and easy access to amenities. | Local restaurants, Shopping shops, Cultural attractions, Events and festivals |
| Dolonne | A picturesque area known for its beautiful landscapes and proximity to nature trails. Perfect for hikers and nature lovers during both winter and summer. | Nature hikes, Scenic views, Horse riding trails |
| La Thuile Station | Near the train station, making it accessible for tourists arriving from larger cities. A strategic location for short stays or weekend getaways. | Train services to Aosta, Access to surrounding ski areas |
| Piccolo San Bernardo | A beautiful area known for its scenic landscape and hiking opportunities in summer. Popular with tourists looking for tranquility and natural beauty. | Hiking routes, Piccolo San Bernardo Pass, Natural parks |
| Les Chavonnes | A quiet residential area with a local feel, suitable for long-term rentals or family vacations. It offers a peaceful retreat away from the main tourist areas. | Nearby parks, Local community events, Authentic local experiences |
| Colombaz | A suburban area with great views and ski access. It's a family-friendly neighborhood appealing to visitors seeking a balance of relaxation and activities. | Ski runs, Sledding areas, Community parks |
| Frazione La Verdaz | A little-known gem offering rustic charm and local hospitality. Ideal for those looking to escape the crowds and enjoy a more intimate holiday experience. | Traditional chalets, Rural landscapes, Local cuisine |
Understanding Airbnb License Requirements & STR Laws in La Thuile (2026)
Yes, La Thuile, Aosta Valley, Italy enforces high STR regulations. Obtaining a license and ensuring compliance is almost certainly required according to current 2026 STR laws. Always verify the latest short term rental regulations and Airbnb license requirements directly with local government authorities for La Thuile to ensure full compliance before hosting.
(Source: AirROI data, 2026, based on 90% licensed listings)
Top Performing Airbnb Properties in La Thuile (2026)
Benchmark your potential! Explore examples of top-performing Airbnb properties in La Thuilebased on Trailing Twelve Month (TTM) revenue. Analyze their characteristics, revenue, occupancy rate, and ADR to understand what drives success in this market.
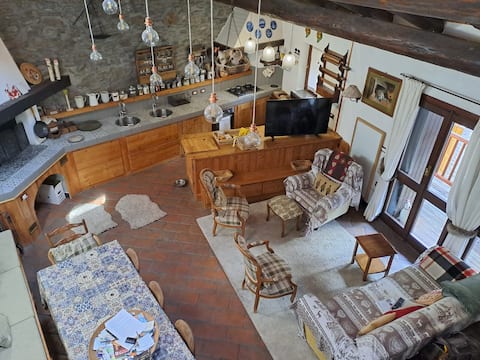
Maison de Sabine - Typical dwelling in an old village
Entire Place • 4 bedrooms

NEW luxury two floor house host up to 8 people
Entire Place • 4 bedrooms

large, bright and cozy apartment
Entire Place • 3 bedrooms
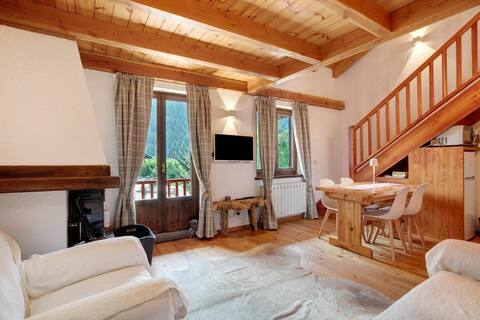
Charming Chalet with Fireplace
Entire Place • 4 bedrooms

Appartamento Jardin des Alpes.
Entire Place • 1 bedroom

Chalet-style apartment in the heart of La Thuile
Entire Place • 2 bedrooms
Note: Performance varies based on location, size, amenities, seasonality, and management quality. Data reflects the past 12 months.
Top Performing Airbnb Hosts in La Thuile (2026)
Learn from the best! This table showcases top-performing Airbnb hosts in La Thuile based on the number of properties managed and estimated total revenue over the past year. Analyze their scale and performance metrics.
| Host Name | Properties | Grossing Revenue | Stay Reviews | Avg Rating |
|---|---|---|---|---|
| Valentina | 5 | $87,700 | 17 | 4.13/5.0 |
| Valeria | 2 | $69,291 | 31 | 4.91/5.0 |
| Marta Virginia | 1 | $50,823 | 49 | 4.84/5.0 |
| Giorgia Maria | 1 | $43,328 | 7 | 5.00/5.0 |
| Marco | 1 | $37,399 | 2 | Not Rated |
| Eduardo | 1 | $35,660 | 30 | 4.90/5.0 |
| Alex | 1 | $31,950 | 10 | 4.90/5.0 |
| Monica | 1 | $30,563 | 38 | 4.92/5.0 |
| Gianpaolo | 1 | $29,826 | 86 | 4.85/5.0 |
| Valentina | 1 | $28,969 | 5 | 4.80/5.0 |
Analyzing the strategies of top hosts, such as their property selection, pricing, and guest communication, can offer valuable lessons for optimizing your own Airbnb operations in La Thuile.
Dive Deeper: Advanced La Thuile STR Market Data (2026)
Ready to unlock more insights? AirROI provides access to advanced metrics and comprehensive Airbnb data for La Thuile. Explore detailed analytics beyond this report to refine your investment strategy, optimize pricing, and maximize your vacation rental profits.
Explore Advanced MetricsLa Thuile Short-Term Rental Market Composition (2026): Property & Room Types
Room Type Distribution
Property Type Distribution
Market Composition Insights for La Thuile
- The La Thuile Airbnb market composition is heavily skewed towards Entire Home/Apt listings, which make up 99% of the 104 active rentals. This indicates strong guest preference for privacy and space.
- Looking at the property type distribution in La Thuile, Apartment/Condo properties are the most common (90.4%), reflecting the local real estate landscape.
- Smaller segments like hotel/boutique, outdoor/unique (combined 2.0%) offer potential for unique stay experiences.
La Thuile Airbnb Room Capacity Analysis (2026): Bedroom Distribution
Distribution of Listings by Number of Bedrooms
Room Capacity Insights for La Thuile
- The dominant room capacity in La Thuile is 2 bedrooms listings, making up 42.3% of the market. This suggests a strong demand for properties suitable for couples or solo travelers.
- Together, 2 bedrooms and 1 bedroom properties represent 75.0% of the active Airbnb listings in La Thuile, indicating a high concentration in these sizes.
La Thuile Vacation Rental Guest Capacity Trends (2026)
Distribution of Listings by Guest Capacity
Guest Capacity Insights for La Thuile
- The most common guest capacity trend in La Thuile vacation rentals is listings accommodating 4 guests (35.6%). This suggests the primary traveler segment is likely small families or groups.
- Properties designed for 4 guests and 6 guests dominate the La Thuile STR market, accounting for 56.8% of listings.
- 30.8% of properties accommodate 6+ guests, serving the market segment for larger families or group travel in La Thuile.
- On average, properties in La Thuile are equipped to host 4.7 guests.
La Thuile Airbnb Booking Patterns (2026): Available vs. Booked Days
Available Days Distribution
Booked Days Distribution
Booking Pattern Insights for La Thuile
- The most common availability pattern in La Thuile falls within the 271-366 days range, representing 68.3% of listings. This suggests many properties have significant open periods on their calendars.
- Approximately 98.1% of listings show high availability (181+ days open annually), indicating potential for increased bookings or specific owner usage patterns.
- For booked days, the 31-90 days range is most frequent in La Thuile (45.2%), reflecting common guest stay durations or potential owner blocking patterns.
- A notable 1.9% of properties secure long booking periods (181+ days booked per year), highlighting successful long-term rental strategies or significant owner usage.
La Thuile Airbnb Minimum Stay Requirements Analysis
Distribution of Listings by Minimum Night Requirement
1 Night
3 listings
2.9% of total
2 Nights
11 listings
10.6% of total
3 Nights
7 listings
6.7% of total
4-6 Nights
23 listings
22.1% of total
7-29 Nights
6 listings
5.8% of total
30+ Nights
54 listings
51.9% of total
Key Insights
- The most prevalent minimum stay requirement in La Thuile is 30+ Nights, adopted by 51.9% of listings. This highlights the market's preference for longer commitments.
- Very short stays (1-2 nights) are less common (13.5%), suggesting hosts prefer slightly longer bookings to optimize turnover.
- A significant segment (51.9%) caters to monthly stays (30+ nights) in La Thuile, pointing to opportunities in the extended-stay market.
Recommendations
- Align with the market by considering a 30+ Nights minimum stay, as 51.9% of La Thuile hosts use this setting.
- If feasible, allowing 1-night stays, especially midweek or during low season, could capture last-minute bookings, as only 2.9% currently do.
- Explore offering discounts for stays of 30+ nights to attract the 51.9% of the market seeking extended stays.
- Adjust minimum nights based on seasonality – potentially shorter during low season and longer during peak demand periods in La Thuile.
La Thuile Airbnb Cancellation Policy Trends Analysis (2026)
Limited
3 listings
2.9% of total
Super Strict 30 Days
1 listings
1% of total
Flexible
20 listings
19.2% of total
Moderate
45 listings
43.3% of total
Firm
29 listings
27.9% of total
Strict
6 listings
5.8% of total
Cancellation Policy Insights for La Thuile
- The prevailing Airbnb cancellation policy trend in La Thuile is Moderate, used by 43.3% of listings.
- There's a relatively balanced mix between guest-friendly (62.5%) and stricter (33.7%) policies, offering choices for different guest needs.
- Strict cancellation policies are quite rare (5.8%), potentially making listings with this policy less competitive unless justified by high demand or property type.
Recommendations for Hosts
- Consider adopting a Moderate policy to align with the 43.3% market standard in La Thuile.
- Using a Strict policy might deter some guests, as only 5.8% of listings use it. Evaluate if potential revenue protection outweighs possible lower booking rates.
- Regularly review your cancellation policy against competitors and market demand shifts in La Thuile.
La Thuile STR Booking Lead Time Analysis (2026)
Average Booking Lead Time by Month
Booking Lead Time Insights for La Thuile
- The overall average booking lead time for vacation rentals in La Thuile is 66 days.
- Guests book furthest in advance for stays during February (average 107 days), likely coinciding with peak travel demand or local events.
- The shortest booking windows occur for stays in October (average 7 days), indicating more last-minute travel plans during this time.
- Seasonally, Winter (92 days avg.) sees the longest lead times, while Fall (16 days avg.) has the shortest, reflecting typical travel planning cycles.
Recommendations for Hosts
- Use the overall average lead time (66 days) as a baseline for your pricing and availability strategy in La Thuile.
- For February stays, consider implementing length-of-stay discounts or slightly higher rates for bookings made less than 107 days out to capitalize on advance planning.
- During October, focus on last-minute booking availability and promotions, as guests book with very short notice (7 days avg.).
- Target marketing efforts for the Winter season well in advance (at least 92 days) to capture early planners.
- Monitor your own booking lead times against these La Thuile averages to identify opportunities for dynamic pricing adjustments.
Popular & Essential Airbnb Amenities in La Thuile (2026)
Amenity Prevalence
Amenity Insights for La Thuile
- Essential amenities in La Thuile that guests expect include: Kitchen, Hair dryer. Lacking these (any) could significantly impact bookings.
- Popular amenities like Heating, Hot water, TV are common but not universal. Offering these can provide a competitive edge.
Recommendations for Hosts
- Ensure your listing includes all essential amenities for La Thuile: Kitchen, Hair dryer.
- Prioritize adding missing essentials: Kitchen, Hair dryer.
- Consider adding popular differentiators like Heating or Hot water to increase appeal.
- Highlight unique or less common amenities you offer (e.g., hot tub, dedicated workspace, EV charger) in your listing description and photos.
- Regularly check competitor amenities in La Thuile to stay competitive.
La Thuile Airbnb Guest Demographics & Profile Analysis (2026)
Guest Profile Summary for La Thuile
- The typical guest profile for Airbnb in La Thuile consists of predominantly international visitors (69%), with top international origins including United Kingdom, typically belonging to the Post-2000s (Gen Z/Alpha) group (50%), primarily speaking English or Italian.
- Domestic travelers account for 31.1% of guests.
- Key international markets include Italy (31.1%) and United Kingdom (24.7%).
- Top languages spoken are English (40.2%) followed by Italian (20.6%).
- A significant demographic segment is the Post-2000s (Gen Z/Alpha) group, representing 50% of guests.
Recommendations for Hosts
- Focus marketing internationally, particularly towards travelers from United Kingdom.
- Tailor amenities and listing descriptions to appeal to the dominant Post-2000s (Gen Z/Alpha) demographic (e.g., highlight fast WiFi, smart home features, local guides).
- Highlight unique local experiences or amenities relevant to the primary guest profile.
- Consider seasonal promotions aligned with peak travel times for key origin markets.
Nearby Short-Term Rental Market Comparison
How does the La Thuile Airbnb market stack up against its neighbors? Compare key performance metrics like average monthly revenue, ADR, and occupancy rates in surrounding areas to understand the broader regional STR landscape.
| Market | Active Properties | Monthly Revenue | Daily Rate | Avg. Occupancy |
|---|---|---|---|---|
| Niederried bei Interlaken | 19 | $6,267 | $552.03 | 44% |
| Lauterbrunnen | 552 | $6,108 | $487.83 | 51% |
| Matten bei Interlaken | 64 | $5,607 | $336.51 | 59% |
| Les Clefs | 34 | $5,585 | $314.08 | 47% |
| Monteu Roero | 12 | $5,184 | $403.07 | 41% |
| Wengen | 12 | $5,115 | $595.38 | 46% |
| Oberhofen am Thunersee | 25 | $5,051 | $329.28 | 51% |
| Zermatt | 792 | $5,017 | $504.14 | 46% |
| Interlaken | 346 | $4,947 | $399.71 | 53% |
| Bönigen | 35 | $4,848 | $288.51 | 65% |