El Paredón Airbnb Market Analysis 2026: Short Term Rental Data & Vacation Rental Statistics in Escuintla, Guatemala
Is Airbnb profitable in El Paredón in 2026? Explore comprehensive Airbnb analytics for El Paredón, Escuintla, Guatemala to uncover income potential. This 2026 STR market report for El Paredón, based on AirROI data from February 2025 to January 2026, reveals key trends in the market of 250 active listings.
Whether you're considering an Airbnb investment in El Paredón, optimizing your existing vacation rental, or exploring rental arbitrage opportunities, understanding the El Paredón Airbnb data is crucial. Leveraging the low regulation environment is key to maximizing your short term rental income potential. Let's dive into the specifics.
Key El Paredón Airbnb Performance Metrics Overview
Monthly Airbnb Revenue Variations & Income Potential in El Paredón (2026)
Understanding the monthly revenue variations for Airbnb listings in El Paredón is key to maximizing your short term rental income potential. Seasonality significantly impacts earnings. Our analysis, based on data from the past 12 months, shows that the peak revenue month for STRs in El Paredón is typically December, while September often presents the lowest earnings, highlighting opportunities for strategic pricing adjustments during shoulder and low seasons. Explore the typical Airbnb income in El Paredón across different performance tiers:
- Best-in-class properties (Top 10%) achieve $3,450+ monthly, often utilizing dynamic pricing and superior guest experiences.
- Strong performing properties (Top 25%) earn $1,819 or more, indicating effective management and desirable locations/amenities.
- Typical properties (Median) generate around $908 per month, representing the average market performance.
- Entry-level properties (Bottom 25%) see earnings around $408, often with potential for optimization.
Average Monthly Airbnb Earnings Trend in El Paredón
El Paredón Airbnb Occupancy Rate Trends (2026)
Maximize your bookings by understanding the El Paredón STR occupancy trends. Seasonal demand shifts significantly influence how often properties are booked. Typically, Februarysees the highest demand (peak season occupancy), while September experiences the lowest (low season). Effective strategies, like adjusting minimum stays or offering promotions, can boost occupancy during slower periods. Here's how different property tiers perform in El Paredón:
- Best-in-class properties (Top 10%) achieve 67%+ occupancy, indicating high desirability and potentially optimized availability.
- Strong performing properties (Top 25%) maintain 50% or higher occupancy, suggesting good market fit and guest satisfaction.
- Typical properties (Median) have an occupancy rate around 29%.
- Entry-level properties (Bottom 25%) average 15% occupancy, potentially facing higher vacancy.
Average Monthly Occupancy Rate Trend in El Paredón
Average Daily Rate (ADR) Airbnb Trends in El Paredón (2026)
Effective short term rental pricing strategy in El Paredón involves understanding monthly ADR fluctuations. The Average Daily Rate (ADR) for Airbnb in El Paredón typically peaks in December and dips lowest during August. Leveraging Airbnb dynamic pricing tools or strategies based on this seasonality can significantly boost revenue. Here's a look at the typical nightly rates achieved:
- Best-in-class properties (Top 10%) command rates of $299+ per night, often due to premium features or locations.
- Strong performing properties (Top 25%) achieve nightly rates of $146 or more.
- Typical properties (Median) charge around $99 per night.
- Entry-level properties (Bottom 25%) earn around $60 per night.
Average Daily Rate (ADR) Trend by Month in El Paredón
Get Live El Paredón Market Intelligence 👇

Explore Real-time Analytics
Airbnb Seasonality Analysis & Trends in El Paredón (2026)
Peak Season (December, January, April)
- Revenue averages $1,978 per month
- Occupancy rates average 38.7%
- Daily rates average $144
Shoulder Season
- Revenue averages $1,545 per month
- Occupancy maintains around 35.4%
- Daily rates hold near $129
Low Season (August, September, October)
- Revenue drops to average $1,160 per month
- Occupancy decreases to average 25.1%
- Daily rates adjust to average $129
Seasonality Insights for El Paredón
- The Airbnb seasonality in El Paredón shows highly seasonal trends requiring careful strategy. While the sections above show seasonal averages, it's also insightful to look at the extremes:
- During the high season, the absolute peak month showcases El Paredón's highest earning potential, with monthly revenues capable of climbing to $2,193, occupancy reaching a high of 45.4%, and ADRs peaking at $152.
- Conversely, the slowest single month of the year, typically falling within the low season, marks the market's lowest point. In this month, revenue might dip to $1,028, occupancy could drop to 23.3%, and ADRs may adjust down to $126.
- Understanding both the seasonal averages and these monthly peaks and troughs in revenue, occupancy, and ADR is crucial for maximizing your Airbnb profit potential in El Paredón.
Seasonal Strategies for Maximizing Profit
- Peak Season: Maximize revenue through premium pricing and potentially longer minimum stays. Ensure high availability.
- Low Season: Offer competitive pricing, special promotions (e.g., extended stay discounts), and flexible cancellation policies. Target off-season travelers like remote workers or budget-conscious guests.
- Shoulder Seasons: Implement dynamic pricing that balances peak and low rates. Target weekend travelers or specific events. Offer slightly more flexible terms than peak season.
- Regularly analyze your own performance against these El Paredón seasonality benchmarks and adjust your pricing and availability strategy accordingly.
Best Areas for Airbnb Investment in El Paredón (2026)
Exploring the top neighborhoods for short-term rentals in El Paredón? This section highlights key areas, outlining why they are attractive for hosts and guests, along with notable local attractions. Consider these locations based on your target guest profile and investment strategy.
| Neighborhood / Area | Why Host Here? (Target Guests & Appeal) | Key Attractions & Landmarks |
|---|---|---|
| Playa El Paredón | A serene beach destination known for its natural beauty and surfing opportunities. It's an ideal spot for beach lovers and travelers looking for a relaxing getaway. | Surfing, Turtle Conservation Program, Beaches, Eco-Tours, Local Restaurants |
| Cacao Beach | Known for its picturesque scenery and tranquil environment, Cacao Beach attracts those looking for a peaceful vacation spot, ideal for nature enthusiasts and families. | Beach Access, Sunset Views, Local Fishing, Birdwatching, Shaded Areas |
| El Paredón Village | A cozy village that offers a glimpse into local Guatemalan culture, perfect for travelers interested in authentic experiences and community interaction. | Local Markets, Traditional Cuisine, Cultural Events, Community Tours, Friendly Locals |
| Tikal National Park | One of the most famous archaeological sites in Guatemala, Tikal offers a unique blend of adventure and history, drawing tourists from all over the world. | Mayan Ruins, Wildlife Tours, Jungle Treks, Cultural Significance, Photography Opportunities |
| Laguna de Ayarza | A hidden gem known for its stunning lake, it’s perfect for those looking to escape into nature and enjoy outdoor activities such as hiking and kayaking. | Kayaking, Hiking Trails, Birdwatching, Swimming, Picnic Areas |
| Antigua Guatemala | A UNESCO World Heritage Site known for its well-preserved colonial architecture and vibrant culture, attracting many tourists year-round. | Historic Churches, Cobblestone Streets, Coffee Tours, Cultural Festivals, Local Crafts |
| Lake Atitlán | Renowned for its breathtaking views and vibrant local cultures, Lake Atitlán is a prime tourist destination for travelers looking for beauty and adventure. | Boat Tours, Hiking, Village Visits, Cultural Experiences, Stunning Views |
| Monterrico | A nearby beach destination known for its black sand beaches and vibrant wildlife, popular among visitors looking for a lively beach experience and nature. | Black Sand Beaches, Turtle Nesting Sites, Giant Lizards, Nature Reserves, Local Nightlife |
Understanding Airbnb License Requirements & STR Laws in El Paredón (2026)
While El Paredón, Escuintla, Guatemala currently shows low STR regulations, specific Airbnb license requirements might still exist or change. Always verify the latest short term rental regulations and Airbnb license requirements directly with local government authorities for El Paredón to ensure full compliance before hosting.
(Source: AirROI data, 2026, based on 1% licensed listings)
Top Performing Airbnb Properties in El Paredón (2026)
Benchmark your potential! Explore examples of top-performing Airbnb properties in El Paredónbased on Trailing Twelve Month (TTM) revenue. Analyze their characteristics, revenue, occupancy rate, and ADR to understand what drives success in this market.

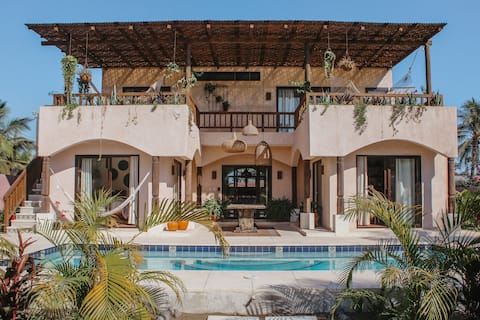
Beachfront Home with Infinity Pool & Calm Sunsets
Entire Place • 4 bedrooms

Maya.elparedon
Entire Place • 5 bedrooms
VILLA ROSA | Private Pool, 4 Bed, WFH Office
Entire Place • 4 bedrooms

Aranxa, El Paredon - Beachfront
Entire Place • 3 bedrooms

SURYA @ El Paredón - beachfront
Entire Place • 3 bedrooms
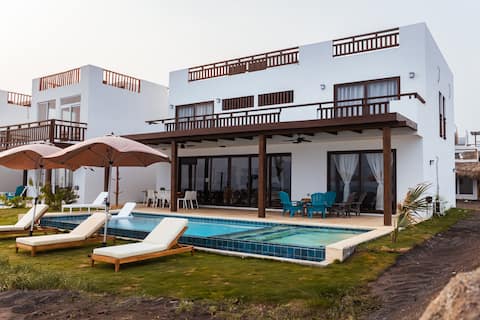
Complete House in El Paredón: Facing the sea!
Entire Place • 4 bedrooms
Note: Performance varies based on location, size, amenities, seasonality, and management quality. Data reflects the past 12 months.
Top Performing Airbnb Hosts in El Paredón (2026)
Learn from the best! This table showcases top-performing Airbnb hosts in El Paredón based on the number of properties managed and estimated total revenue over the past year. Analyze their scale and performance metrics.
| Host Name | Properties | Grossing Revenue | Stay Reviews | Avg Rating |
|---|---|---|---|---|
| BungaLoose | 4 | $249,735 | 91 | 4.78/5.0 |
| José | 1 | $138,266 | 157 | 4.87/5.0 |
| Argelia | 5 | $124,999 | 78 | 4.67/5.0 |
| Alex | 5 | $124,341 | 315 | 4.95/5.0 |
| Ilona | 5 | $120,492 | 280 | 4.99/5.0 |
| Charlotte | 1 | $119,529 | 91 | 4.86/5.0 |
| Olga | 10 | $110,775 | 699 | 4.96/5.0 |
| Ben | 1 | $101,324 | 91 | 4.97/5.0 |
| Diana | 4 | $94,136 | 73 | 4.65/5.0 |
| Cacho | 1 | $90,000 | 94 | 4.91/5.0 |
Analyzing the strategies of top hosts, such as their property selection, pricing, and guest communication, can offer valuable lessons for optimizing your own Airbnb operations in El Paredón.
Dive Deeper: Advanced El Paredón STR Market Data (2026)
Ready to unlock more insights? AirROI provides access to advanced metrics and comprehensive Airbnb data for El Paredón. Explore detailed analytics beyond this report to refine your investment strategy, optimize pricing, and maximize your vacation rental profits.
Explore Advanced MetricsEl Paredón Short-Term Rental Market Composition (2026): Property & Room Types
Room Type Distribution
Property Type Distribution
Market Composition Insights for El Paredón
- The El Paredón Airbnb market composition is heavily skewed towards Private Room listings, which make up 51.2% of the 250 active rentals. This indicates strong guest preference for privacy and space.
- Looking at the property type distribution in El Paredón, House properties are the most common (41.2%), reflecting the local real estate landscape.
- Houses represent a significant 41.2% portion, catering likely to families or larger groups.
- The presence of 35.6% Hotel/Boutique listings indicates integration with traditional hospitality.
- Smaller segments like unique stays, others (combined 2.8%) offer potential for unique stay experiences.
El Paredón Airbnb Room Capacity Analysis (2026): Bedroom Distribution
Distribution of Listings by Number of Bedrooms
Room Capacity Insights for El Paredón
- The dominant room capacity in El Paredón is 1 bedroom listings, making up 57.6% of the market. This suggests a strong demand for properties suitable for couples or solo travelers.
- Together, 1 bedroom and 2 bedrooms properties represent 68.0% of the active Airbnb listings in El Paredón, indicating a high concentration in these sizes.
- With over half the market (57.6%) consisting of studios or 1-bedroom units, El Paredón is particularly well-suited for individuals or couples.
El Paredón Vacation Rental Guest Capacity Trends (2026)
Distribution of Listings by Guest Capacity
Guest Capacity Insights for El Paredón
- The most common guest capacity trend in El Paredón vacation rentals is listings accommodating 2 guests (30.4%). This suggests the primary traveler segment is likely couples or solo travelers.
- Properties designed for 2 guests and 4 guests dominate the El Paredón STR market, accounting for 52.0% of listings.
- 19.6% of properties accommodate 6+ guests, serving the market segment for larger families or group travel in El Paredón.
- On average, properties in El Paredón are equipped to host 3.4 guests.
El Paredón Airbnb Booking Patterns (2026): Available vs. Booked Days
Available Days Distribution
Booked Days Distribution
Booking Pattern Insights for El Paredón
- The most common availability pattern in El Paredón falls within the 271-366 days range, representing 53.6% of listings. This suggests many properties have significant open periods on their calendars.
- Approximately 86.0% of listings show high availability (181+ days open annually), indicating potential for increased bookings or specific owner usage patterns.
- For booked days, the 31-90 days range is most frequent in El Paredón (36.4%), reflecting common guest stay durations or potential owner blocking patterns.
- A notable 14.4% of properties secure long booking periods (181+ days booked per year), highlighting successful long-term rental strategies or significant owner usage.
El Paredón Airbnb Minimum Stay Requirements Analysis
Distribution of Listings by Minimum Night Requirement
1 Night
173 listings
69.2% of total
2 Nights
41 listings
16.4% of total
3 Nights
1 listings
0.4% of total
7-29 Nights
3 listings
1.2% of total
30+ Nights
32 listings
12.8% of total
Key Insights
- The most prevalent minimum stay requirement in El Paredón is 1 Night, adopted by 69.2% of listings. This highlights the market's preference for shorter, flexible bookings.
- A strong majority (85.6%) of the El Paredón Airbnb data shows acceptance of very short stays (1-2 nights), indicating a dynamic, high-turnover market.
- A significant segment (12.8%) caters to monthly stays (30+ nights) in El Paredón, pointing to opportunities in the extended-stay market.
Recommendations
- Align with the market by considering a 1 Night minimum stay, as 69.2% of El Paredón hosts use this setting.
- Explore offering discounts for stays of 30+ nights to attract the 12.8% of the market seeking extended stays.
- Adjust minimum nights based on seasonality – potentially shorter during low season and longer during peak demand periods in El Paredón.
El Paredón Airbnb Cancellation Policy Trends Analysis (2026)
Super Strict 60 Days
7 listings
2.8% of total
Flexible
71 listings
28.4% of total
Moderate
101 listings
40.4% of total
Firm
48 listings
19.2% of total
Strict
23 listings
9.2% of total
Cancellation Policy Insights for El Paredón
- The prevailing Airbnb cancellation policy trend in El Paredón is Moderate, used by 40.4% of listings.
- There's a relatively balanced mix between guest-friendly (68.8%) and stricter (28.4%) policies, offering choices for different guest needs.
- Strict cancellation policies are quite rare (9.2%), potentially making listings with this policy less competitive unless justified by high demand or property type.
Recommendations for Hosts
- Consider adopting a Moderate policy to align with the 40.4% market standard in El Paredón.
- Using a Strict policy might deter some guests, as only 9.2% of listings use it. Evaluate if potential revenue protection outweighs possible lower booking rates.
- Regularly review your cancellation policy against competitors and market demand shifts in El Paredón.
El Paredón STR Booking Lead Time Analysis (2026)
Average Booking Lead Time by Month
Booking Lead Time Insights for El Paredón
- The overall average booking lead time for vacation rentals in El Paredón is 23 days.
- Guests book furthest in advance for stays during December (average 44 days), likely coinciding with peak travel demand or local events.
- The shortest booking windows occur for stays in May (average 17 days), indicating more last-minute travel plans during this time.
- Seasonally, Winter (30 days avg.) sees the longest lead times, while Summer (20 days avg.) has the shortest, reflecting typical travel planning cycles.
Recommendations for Hosts
- Use the overall average lead time (23 days) as a baseline for your pricing and availability strategy in El Paredón.
- For December stays, consider implementing length-of-stay discounts or slightly higher rates for bookings made less than 44 days out to capitalize on advance planning.
- Target marketing efforts for the Winter season well in advance (at least 30 days) to capture early planners.
- Monitor your own booking lead times against these El Paredón averages to identify opportunities for dynamic pricing adjustments.
Popular & Essential Airbnb Amenities in El Paredón (2026)
Amenity Prevalence
Amenity Insights for El Paredón
- Popular amenities like Wifi, Pool, Free parking on premises are common but not universal. Offering these can provide a competitive edge.
- A pool is a highly desired but not standard amenity, making it a key feature for attracting guests seeking leisure in El Paredón.
- Warning: Wifi is not universally provided but is considered essential globally. Ensure reliable Wifi is offered.
Recommendations for Hosts
- Consider adding popular differentiators like Wifi or Pool to increase appeal.
- Highlight unique or less common amenities you offer (e.g., hot tub, dedicated workspace, EV charger) in your listing description and photos.
- Regularly check competitor amenities in El Paredón to stay competitive.
El Paredón Airbnb Guest Demographics & Profile Analysis (2026)
Guest Profile Summary for El Paredón
- The typical guest profile for Airbnb in El Paredón consists of a mix of domestic (58%) and international guests, often arriving from nearby Guatemala City, typically belonging to the Post-2000s (Gen Z/Alpha) group (50%), primarily speaking English or Spanish.
- Domestic travelers account for 57.8% of guests.
- Key international markets include Guatemala (57.8%) and United States (13.7%).
- Top languages spoken are English (41.3%) followed by Spanish (40.1%).
- A significant demographic segment is the Post-2000s (Gen Z/Alpha) group, representing 50% of guests.
Recommendations for Hosts
- Balance marketing efforts between domestic and international channels based on the guest mix.
- Tailor amenities and listing descriptions to appeal to the dominant Post-2000s (Gen Z/Alpha) demographic (e.g., highlight fast WiFi, smart home features, local guides).
- Highlight unique local experiences or amenities relevant to the primary guest profile.
- Consider seasonal promotions aligned with peak travel times for key origin markets.
Nearby Short-Term Rental Market Comparison
How does the El Paredón Airbnb market stack up against its neighbors? Compare key performance metrics like average monthly revenue, ADR, and occupancy rates in surrounding areas to understand the broader regional STR landscape.
| Market | Active Properties | Monthly Revenue | Daily Rate | Avg. Occupancy |
|---|---|---|---|---|
| Santa Catarina Palopó | 52 | $2,910 | $240.56 | 40% |
| Agua Escondida | 11 | $2,601 | $290.02 | 26% |
| La Barrita | 20 | $2,273 | $196.60 | 38% |
| Chulamar | 37 | $2,147 | $323.81 | 26% |
| San Jorge La Laguna | 24 | $2,118 | $205.66 | 40% |
| San Francisco Menéndez | 14 | $1,953 | $220.27 | 30% |
| Tzununá | 37 | $1,830 | $144.48 | 45% |
| Santa Cruz La Laguna | 76 | $1,737 | $131.69 | 46% |
| Puerto Quetzal | 41 | $1,680 | $301.06 | 24% |
| Chiquimulilla | 13 | $1,638 | $250.50 | 19% |